

Fertilizer prices · Data guide
Urea Fertilizer Price Per Ton: Global Trends, Analysis and Impacts
World Bank data show the urea benchmark averaged $423 per tonne in 2025, peaked at $857 in April 2026 and was $408 in September 2026. US retail prices are higher and use short tons. The calculator turns any price into cost per kg of nitrogen.
Key takeaways
- The World Bank urea benchmark averaged $338 per tonne in 2024 and $423 in 2025, a rise of about 25%.
- In April 2026 it reached $857 after Gulf exports were disrupted, then fell back to $408 by September 2026 (World Bank).
- US retail urea was $683 per short ton in early October 2026 (DTN). Retail and wholesale prices use different units and markets.
- Compare fertilizers by cost per kg of nitrogen. Urea is 46% N, anhydrous ammonia 82% and UAN 28% to 32%.
- Asia used about 59% of the world’s nitrogen fertilizer in 2023, so Asian demand matters for world prices.
In this article
- Overview: Why Urea Fertilizer Prices Matter
- Price Trends: Urea Prices Soar Per Ton Worldwide
- Global Influences Driving Urea Fertilizer Costs
- Regional Urea Price Variations: United States, China, India & More
- Comparative Table: Urea Fertilizer Price Per Ton vs.
- Impact of Rising Urea Prices on Agriculture & Forestry
- Sustainability, Policy, and Future Prospects
- How Farmonaut Supports Farmers Amidst Fertilizer Price Fluctuations
- Frequently Asked Questions (FAQ): Urea Fertilizer Price Per Ton & Related Topics
- Conclusion
Overview: Why Urea Fertilizer Prices Matter
Urea fertilizer stands as a cornerstone of global agriculture, supplying essential nitrogen that supports healthy crops and strong yields. In 2025, the price per ton of urea has become a focal point for farmers, agribusinesses, and policy makers worldwide. From food security to supply chain dynamics, the fate of urea prices directly shapes the future of the agricultural sector.
Chart
Urea benchmark price, annual average
US dollars per metric tonne, 2019 to 2025
We are witnessing remarkable fertilizer price fluctuations in 2025 and 2026, driven by various global factors—from supply chain disruptions and geopolitical events to increased demand in key producing countries. These changes impact everything from the cost of food production to the sustainability of our planet’s farmland.
This comprehensive analysis explores urea prices 2025, their causes, regional variations, and their profound implications—so you can work through the fertilizer market trends 2025 with insight and confidence.
What Is Urea Fertilizer and Why Is It So Vital?
Urea fertilizer is a nitrogen-rich chemical compound (CO(NH2)2) used extensively across agriculture and forestry. Its high nitrogen content (46% N by weight) and easy handling make it a preferred choice for crops like wheat, rice, and maize,—driving the intense global demand we see today. Urea left on the soil surface is at higher risk of nitrogen loss, and mixing it into the soil lowers that risk (Montana State University Extension, 1996).
Price Trends: Urea Prices Soar Per Ton Worldwide
Current Urea Price Trajectory: How Much Does Urea Fertilizer Cost Per Ton?
In 2025, urea fertilizer prices have soared, marking one of the most dynamic fertilizer market trends in recent years.
Here are key highlights:
Chart
Urea and DAP prices by month
US dollars per metric tonne, wholesale benchmarks, January 2025 to September 2026
- June 2025: Retail urea prices hit $663 per ton, an increase of 7% from May, reflecting the pressure from strong seasonal demand and ongoing supply chain constraints in both nitrogen and phosphorus markets. (DTN retail survey, 2 to 6 June 2025, US dollars per short ton)
- Early 2025 (February to March): DTN retail urea was $546 per ton in the last week of February, up 6% from January. In the last week of March it was $565 per ton, up 3.5% from February (DTN, 2025).
These sharp increases mean farmers around the world face substantially higher input costs for essential nitrogen fertilizer, affecting the agricultural sector at every level.
- Urea Price Fluctuations: Across regions, price changes are not uniform—more on this in our regional variations section below.

What’s Fueling the Price Increases?
Strong demand, limited supply and external shocks are the main drivers behind the persistent urea price increases in 2025. Rising global fertilizer costs now challenge producers as much as they challenge growers.
Breakdown of Key Price Statistics (Per Ton, USD)
- January 2025: $514 (last week of January, DTN)
- February 2025: $546 (last week of February, +6% on January, DTN)
- March 2025: $565 (last week of March, +3.5% on February, DTN)
- June 2025: $663 (+7% over May)
Such rapid fertilizer price fluctuations have happened before, and the World Bank notes that fertilizer prices rose even more in 2021 and 2022. It helps to understand the underlying factors affecting urea costs.
What changed
The World Bank wholesale benchmark for urea (Middle East prill) averaged $423 per tonne in 2025. It then jumped to $726 in March 2026 and $857 in April, about 80% above February. The Bank linked the rise to disruptions at the Strait of Hormuz, a key route for fertilizer exports from the Middle East, which accounts for nearly one quarter of global urea exports (World Bank Data Blog, May 2026). By July 2026 the benchmark was back near $400, and it was $408 in September (World Bank Pink Sheet, October 2026).
US retail prices followed the same path but stayed higher. DTN’s survey put urea at $838 per short ton for 30 March to 3 April 2026, up 34% in a month (DTN, April 2026). It was $764 in mid-June (DTN, June 2026) and $683 at the start of October (DTN, October 2026). University of Illinois researchers reported $858 per ton for the week of 13 April 2026, 49% above a year earlier (farmdoc daily, April 2026). A short ton is 907 kg and a metric tonne is 1,000 kg, so check the unit before you compare prices. Earlier coverage is in our fertilizer prices news.
Global Influences Driving Urea Fertilizer Costs
Major Factors Affecting Urea Costs
- Supply Chain Disruptions & Weather-Related Issues
Ammonia is the feedstock for urea, and natural gas is the main feedstock for ammonia in the United States (USGS, 2026). Supply can tighten when freezing weather or other shocks hit plants. Any loss of availability of ammonia, a crucial feedstock for urea manufacturing, can lift costs in both the nitrogen and phosphorus fertilizer markets and can trigger a global surge in costs.
- Geopolitical Events & Tariff Announcements
Recent tariff announcements in early 2025 raised worries in the fertilizer sector, especially proposals targeting Canadian potash—which could have raised its cost by 25%. The US delayed the tariffs for 30 days as negotiations continued. The proposals concerned potash, not urea. The uncertainty still added price pressure in the potash market, according to DTN’s February 2025 report.
- Global Demand Escalation
With Asia using about 59% of all nitrogen fertilizer used worldwide in 2023 (FAO data via Our World in Data)—the largest share worldwide—intense usage across major agricultural producing countries like China and India means Asian buying has a large say in world prices, adding to regional urea price variations.
- Logistic and Market Dynamics
Rising global demand and complicated distribution chains have forced up costs for both producers and consumers, with market dynamics varying sharply between regions.
Spotlight on Geopolitical Events & Chain Disruptions
Recent geopolitical events have shaken the global fertilizer market in 2026, led by the Strait of Hormuz disruption, with tariffs and regulatory announcements also playing a part in shaping the urea price per ton. For instance, delays in implementing Canadian potash tariffs moved potash contracts in early 2025, and the 2026 disruption at the Strait of Hormuz showed how one shipping route can move urea prices worldwide.
Regional Urea Price Variations: United States, China, India & More
Why Do Urea Prices Differ by Region?
Various regional dynamics—including local supply-demand conditions, production output, and logistical issues—lead to stark differences in urea fertilizer price per ton across the globe.
Compound blends are priced differently, and balanced NPK fertilizer prices covers that part of the market.
Chart
Nitrogen fertilizer use by world region, 2023
Million tonnes of nitrogen (N), all nitrogen fertilizers
Chart
US retail cost of nitrogen by product
US dollars per kg of nitrogen, survey of 28 Sep to 2 Oct 2026
Compare products by the cost of nitrogen
Urea is 46% nitrogen by weight. Anhydrous ammonia is 82% and liquid UAN is 28% to 32% (University of Minnesota Extension). The same source says 100 lb of nitrogen per acre needs about 217 lb of urea. A product with more nitrogen per tonne can cost more per tonne and less per kilogram of nitrogen. To compare, divide the price per tonne by the kilograms of nitrogen in a tonne: 460 kg for urea.
In the chart above, US retail prices for 28 September to 2 October 2026 (DTN) give about $1.32 per kg of nitrogen for anhydrous ammonia and $1.64 for urea. Cost per kilogram is only one factor. Equipment, safety, timing and nitrogen losses also differ by product. Follow the product label and local rules, then use the calculator below with your own prices.
- United States: In the last week of January 2025, retail urea prices averaged $514 per short ton, up from $489 a month earlier. In the survey for 28 September to 2 October 2026 the average was $683 per short ton, 12% higher than a year earlier (DTN).
- China: The world’s largest ammonia producer (ammonia is the feedstock for urea), with about 49 million tonnes of nitrogen in 2025 (USGS estimate). That is more than three times the output of any other country in the USGS table.
- India: A large ammonia producer as well, at about 15 million tonnes of nitrogen (USGS estimate) in 2025.
Other key regions display their own fertilizer price trends, often driven by policy, local weather events, or trade agreements.

Summary: Key Factors Behind Regional Price Variations
- Production Levels: Countries like China benefit from high local output, reducing import costs.
- Import Dependency: Nations such as India, despite growing output, rely on imports to bridge demand-supply gaps, making them susceptible to global price shocks.
- Government Policies: Subsidies, tariff rules, and market interventions affect both retail prices and farmer access.
- Logistics & Distribution: Infrastructure quality and distance from supply hubs drive price differences within and between countries.
- Currency Fluctuations: Fluctuating exchange rates often amplify international market volatility at the local level.
Try the numbers for your own farm below.
Calculator
What does my urea cost per kg of nitrogen?
Enter your own price, nitrogen share, rate and field size.
- Product needed per hectare: 326 kg
- Cost per hectare: $163
- Cost per acre: $66
- Total product for the field: 13.0 tonnes
- Total cost for the field: $6,522
Example values only, not a benchmark. Urea is 46% nitrogen by weight, anhydrous ammonia 82% and UAN 28% to 32% (University of Minnesota Extension). 1 hectare is 2.471 acres. Enter the price per metric tonne in any one currency. A US short ton is 0.907 tonne, so divide a price per short ton by 0.907 first. Losses, spreading cost and other nutrients are not included. Follow the product label and local rules for rates.
Comparative Table: Urea Fertilizer Price Per Ton vs.
To provide a clear overview of cross-border fertilizer market trends and regional price impacts, here is a table of World Bank benchmark prices for urea, other fertilizers and natural gas. It shows annual averages for 2024 and 2025.
Chart
Fertilizer prices before and at the spring 2026 peak
US dollars per metric tonne, monthly averages, wholesale benchmarks
Gas, plants and ports
The last rows of the table below show natural gas, the main feedstock for ammonia in the United States (USGS, 2026). Gas prices differ a lot by region. In September 2026 the World Bank price was $2.95 per million British thermal units (mmbtu) in the US and $25.42 in Europe (World Bank Pink Sheet, October 2026). A single plant can matter too. In October 2025 a company shut a nitrogen site in Trinidad and Tobago that had made about 85,000 tons of ammonia and 55,000 tons of urea a month (USGS, Mineral Commodity Summaries 2026).
| Benchmark (World Bank) | 2024 average | 2025 average | Percentage Change (%) |
|---|---|---|---|
| Urea (USD per tonne) | $338 | $423 | +24.9% |
| DAP (USD per tonne) | $564 | $685 | +21.6% |
| TSP (USD per tonne) | $475 | $578 | +21.7% |
| Potash (USD per tonne) | $295 | $348 | +17.8% |
| Natural gas, US (USD per mmbtu) | $2.19 | $3.53 | +61.2% |
| Natural gas, Europe (USD per mmbtu) | $10.96 | $11.96 | +9.1% |
As reflected above, urea price per ton in 2025 rose about 25% from the 2024 average, and the other fertilizers in the table rose 18% to 22%. Higher prices have far-reaching sector impacts on farm budgets.
- Want to optimize your fertilizer usage while reducing input costs? Try Farmonaut’s Carbon Footprinting solution, which helps agribusinesses monitor emissions, minimize resource wastage, and comply with international environmental regulations.
- Looking to ensure transparency in your agricultural supply chain? Farmonaut’s Blockchain-Based Product Traceability makes it easy for food, textile, and agro-processing companies to guarantee authenticity and reduce fraud.
- Struggling with logistics due to rising urea prices? Explore Farmonaut’s Fleet and Resource Management Tools for smarter vehicle routing, asset tracking, and cost control across large farms.
- Involved in forest management or crop plantation? Use Farmonaut’s Crop, Plantation & Forest Advisory features for improved monitoring, disaster prediction, and real-time crop health analytics.
- Need verification for agricultural loans or insurance? Make use of Farmonaut’s Satellite-Based Verification Solutions for trusted, tamper-proof field assessments.
For Developers
- Integrate Farmonaut data via our API — get satellite imagery, crop weather data, and more.
- Check out the API Developer Docs for guidelines and quickstart.
Impact of Rising Urea Prices on Agriculture & Forestry
How Do Fertilizer Price Fluctuations Affect Food Production and the Broader Agriculture Sector?
The impact of rising urea prices extends far beyond immediate cost increases. Let’s look at key implications for agriculture and forestry:
- Higher Input Costs: Increased fertilizer prices per ton directly lift the cost of crop production, squeezing farmer profit margins and threatening food affordability for millions worldwide.
- Food Price Inflation: Elevated nitrogen and phosphorus fertilizer costs eventually translate into higher consumer food prices globally—adding to inflationary pressures already faced by many countries.
- Pressure on Crop Yields: Some farmers, especially in cost-sensitive regions, may reduce fertilizer application rates, potentially leading to lower yields and compromised soil health.
- Growing Interest in Sustainable Alternatives: High prices are prompting a shift towards organic fertilizers, crop rotations, and precise nutrient management solutions—paving the way for sustainable farming.
- Government Policy Responses: Many governments are stepping in with subsidies or direct support to safeguard food security and maintain agricultural sector stability.
Impact on Forestry and Non-Food Sectors
- Forestry and related industries reliant on urea for soil enrichment now also face rising management costs, affecting long-term reforestation and land restoration projects.
- Resource-intensive industries like textiles and biofuels must factor in higher raw material costs and potential supply chain disruptions.
Market Trends: Will Fertilizer Prices Continue to Rise?
Forecasts change quickly, so check recent data before you buy. In April 2026 the World Bank expected urea prices to rise nearly 60% in 2026 and to ease in 2027, while wholesale urea was near $400 per tonne from July to September 2026 (World Bank, October 2026). The market may see sustained fertilizer price fluctuations in coming quarters, though some stabilization may occur if supply chain challenges are addressed and trade negotiations yield favorable results.
Sustainability, Policy, and Future Prospects
Soaring urea prices in 2025 are pushing farmers, agribusinesses, and policymakers to rethink fertilizer management. Let’s break down the evolving response:
Policy Actions to Support Farmers & Food Security
- Subsidies: In countries like India and China, targeted subsidies are being used to offset nitrogen fertilizer demand costs for vulnerable groups.
- Import policies: Easing regulatory bottlenecks and securing alternative trade routes to stabilize supply.
- Strategic reserves: Some governments hold fertilizer stockpiles to cushion against short-term supply chain disruptions.
Rise of Sustainable Agriculture Solutions
- Precision Agriculture: Tools like Farmonaut’s satellite-enabled monitoring can help target fertilizer to the parts of a field that need it.
- Organic Alternatives: Composting, green manures, and leguminous cover crops gain traction as high-price fertilizer substitutes.
- Soil Health Monitoring: Smart sensors and remote analytics allow real-time adjustments, ensuring judicious input use and improved crop yields and soil health.
How Farmonaut Supports Farmers Amidst Fertilizer Price Fluctuations
At Farmonaut, we understand the daunting challenge that rising global fertilizer costs create for, especially smallholder farmers and large agricultural operations alike. That’s why our mission is to make precision agriculture affordable and accessible worldwide through a blend of satellite imagery, AI-powered advisory, and blockchain solutions. These innovations can help offset the impact of fertilizer price fluctuations and agricultural supply chain disruptions.
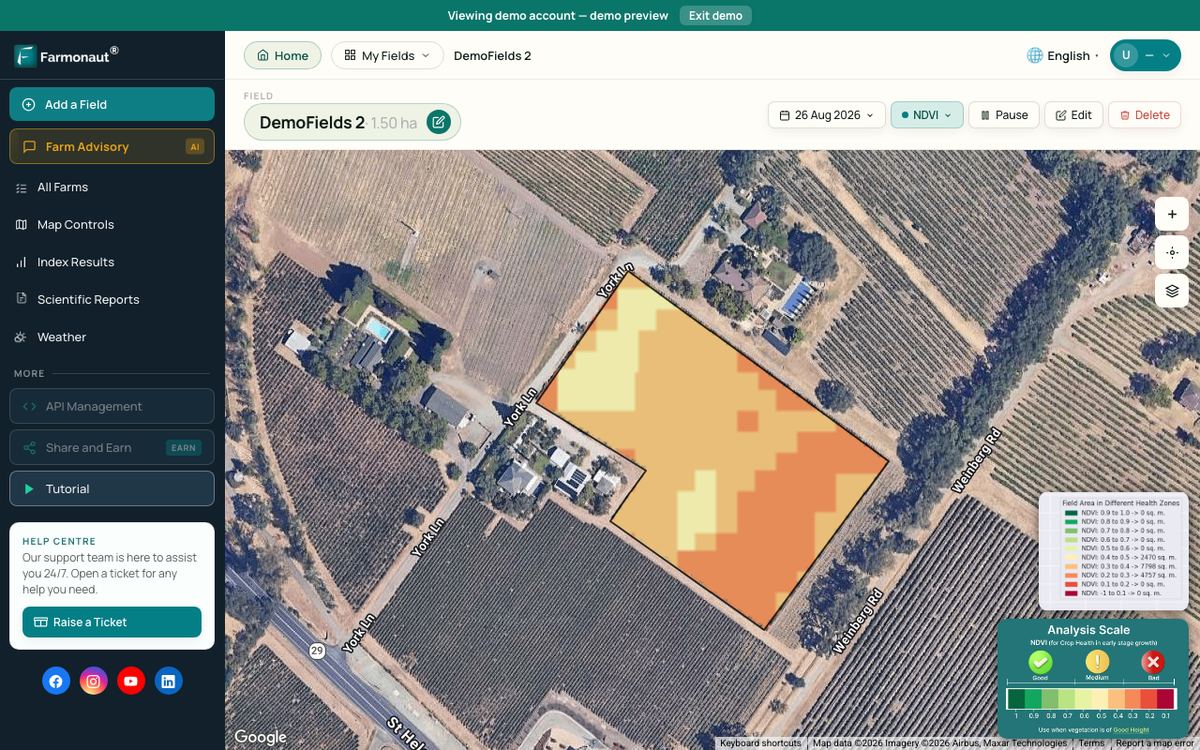
- Satellite-Based Crop Health Monitoring: Our platform delivers detailed NDVI, soil moisture, and health data, enabling farmers to apply urea and other fertilizers only where and when they’re truly needed. This can reduce wastage. Results depend on the field and the crop.
- AI Advisory: Farmonaut Satellite + AI Farm Monitoring System provides field-specific advice to optimize input timing, reduce risks from adverse weather (for example: freezing weather disrupting ammonia feedstock), and maximize efficiency.
- Blockchain Traceability: We enhance supply chain transparency for agribusinesses and end-consumers—ensuring that fertilizer usage, input sources, and yields are all verifiably tracked.
- Carbon Footprinting: Our emissions monitoring allows businesses to balance productivity with sustainability requirements, critical amidst tightening global environmental regulations.
- Fleet and Resource Management: We help farms manage logistics more cost-effectively, a must when price shocks hit the sector.
We offer these solutions via our intuitive Android, iOS, and web apps, ensuring accessibility for everyone from smallholder farmers to multinational agribusinesses. Our flexible, subscription-based pricing means cost-effective scalability—even in the face of fertilizer market trends 2025 and beyond.
For a closer look at a related question, see our guide: Superphosphate Fertilizer: Price & Benefits for Plants.
Frequently Asked Questions (FAQ): Urea Fertilizer Price Per Ton & Related Topics
How much is urea fertilizer per ton globally?
Global urea fertilizer price per ton in 2025 averaged $423 on the World Bank wholesale benchmark (Middle East prill, annual average). In the first nine months of 2026 the same benchmark averaged $543 per tonne, with a peak of $857 in April. US retail urea is a different measure, quoted per short ton, so do not compare it directly with the World Bank figure.
Why are urea prices rising so dramatically?
Significant price hikes are driven by global supply chain disruptions (such as the 2026 Hormuz disruption), geopolitical events and the 2025 potash tariff talks. Demand in Asia is large too, but the World Bank ties the 2026 jump mainly to export disruptions at the Strait of Hormuz.
What regions are most affected by urea price fluctuations?
Regions that depend on imports are exposed when a shipping route closes, as the Strait of Hormuz showed in 2026 (World Bank, 2026). The Asia-Pacific region leads global demand, so price movements there also strongly influence international trends.
How do rising urea prices affect food prices and agriculture?
Higher urea costs increase food production expenses, leading to potential food price inflation. Margins for farmers—especially smallholders—get squeezed, and crop yields may be impacted if fertilizer use is curtailed due to costs.
What can farmers do to manage increased fertilizer costs?
Farmers can adopt precision agriculture practices (such as Farmonaut’s crop health monitoring), explore alternative input sources, optimize application rates, and seek government or institutional support wherever available.
Where can I get access to farm management technology to reduce fertilizer costs?
You can access advanced, affordable satellite-based solutions for real-time crop insights, sustainability management, and logistics optimization via Farmonaut—available on web, Android, and iOS.
Conclusion
The urea fertilizer market in 2025 is marked by a clear trend of rising prices per ton, driven by a dynamic mix of global supply-demand conditions, geopolitical factors, production costs, and chain disruptions. With Asia-Pacific powering global demand and countries worldwide contending with cost increases and market volatility, every link in the agricultural value chain feels the impact.
For farmers and agribusinesses, adapting to these fertilizer market trends 2025 requires a smart, tech-enabled approach. At Farmonaut, we remain committed to advancing modern, sustainable, and data-driven solutions, ensuring growers can respond resiliently to ongoing fertilizer price fluctuations and continue feeding the world’s growing population—efficiently and sustainably.
Stay ahead of the curve by using current agri-tech, staying informed on market trends, and embracing innovative management practices. Explore our platform and find out how Farmonaut can strengthen your farm’s future, today.
Farmonaut crop monitoring
See which parts of a field need attention
Farmonaut Satellite + AI Farm Monitoring System shows crop health maps for your fields on web, Android and iOS.



Keep reading
 MiningAmmonium Sulfate & Nitrogen Content: US Prices & % N Data
 MiningDAP Price 2022 vs Today: What Actually Moves It
 Mining32 Nitrogen Prices & Uses: Powerful Insights to Cut Costs
Sources
- World Bank, Commodity Price Data (The Pink Sheet), October 2026: thedocs.worldbank.org
- World Bank, Commodity Markets Outlook historical data, monthly prices (October 2026 release): thedocs.worldbank.org
- World Bank Data Blog, Fertilizer prices surge as Strait of Hormuz disruptions tighten supplies (May 2026): blogs.worldbank.org
- farmdoc daily, University of Illinois, Middle East ceasefire fails to ease U.S. fertilizer price pressure (April 2026): farmdocdaily.illinois.edu
- USGS, Mineral Commodity Summaries 2026, Nitrogen (fixed), ammonia: pubs.usgs.gov
- FAO FAOSTAT via Our World in Data, Fertilizer use by nutrient: ourworldindata.org
- University of Minnesota Extension, The three biggies: urea, anhydrous ammonia and UAN (2016): blog-crop-news.extension.umn.edu
- Montana State University, Fertilizer Facts 8, Nitrogen fertilizer materials (1996): landresources.montana.edu
- DTN Retail Fertilizer Trends, 5 February 2025: dtnpf.com
- DTN Retail Fertilizer Trends, 5 March 2025: dtnpf.com
- DTN Retail Fertilizer Trends, 2 April 2025: dtnpf.com
- DTN Retail Fertilizer Trends, 11 June 2025: dtnpf.com
- DTN Retail Fertilizer Trends, 8 April 2026: dtnpf.com
- DTN Retail Fertilizer Trends, 17 June 2026: dtnpf.com
- DTN Retail Fertilizer Trends, 7 October 2026: dtnpf.com
Discussion
Questions, corrections or field experience? Share them below. First-time comments are reviewed before they appear, and your email is never published.
No comments yet. Be the first to add a question or your experience.

 JJM Farms
 WeMe Global
 Pixxel
 Agrotoken
 Blue BearX
 Insignito
 Croptimum
 DnCubed
 Field Capacity
 Indosistim Teknologi
 Liquify Digital
 CU Foods
 BeyondTech Global
 Rouge VC
 AgroGreen Dynamics
 AgroRisk
 Oath Inc
 Reddane Farming
 Esri North East Africa
