

Texas Panhandle · Crops and water
What Crops Are Grown in the Texas Panhandle? Ranked List
Winter wheat, corn, grain sorghum and cotton are the main Texas Panhandle crops, with hay and silage for cattle and dairies. The 26 Panhandle counties sold $13.65 billion of farm products in 2022, 88% from livestock (USDA NASS Census, our sum).
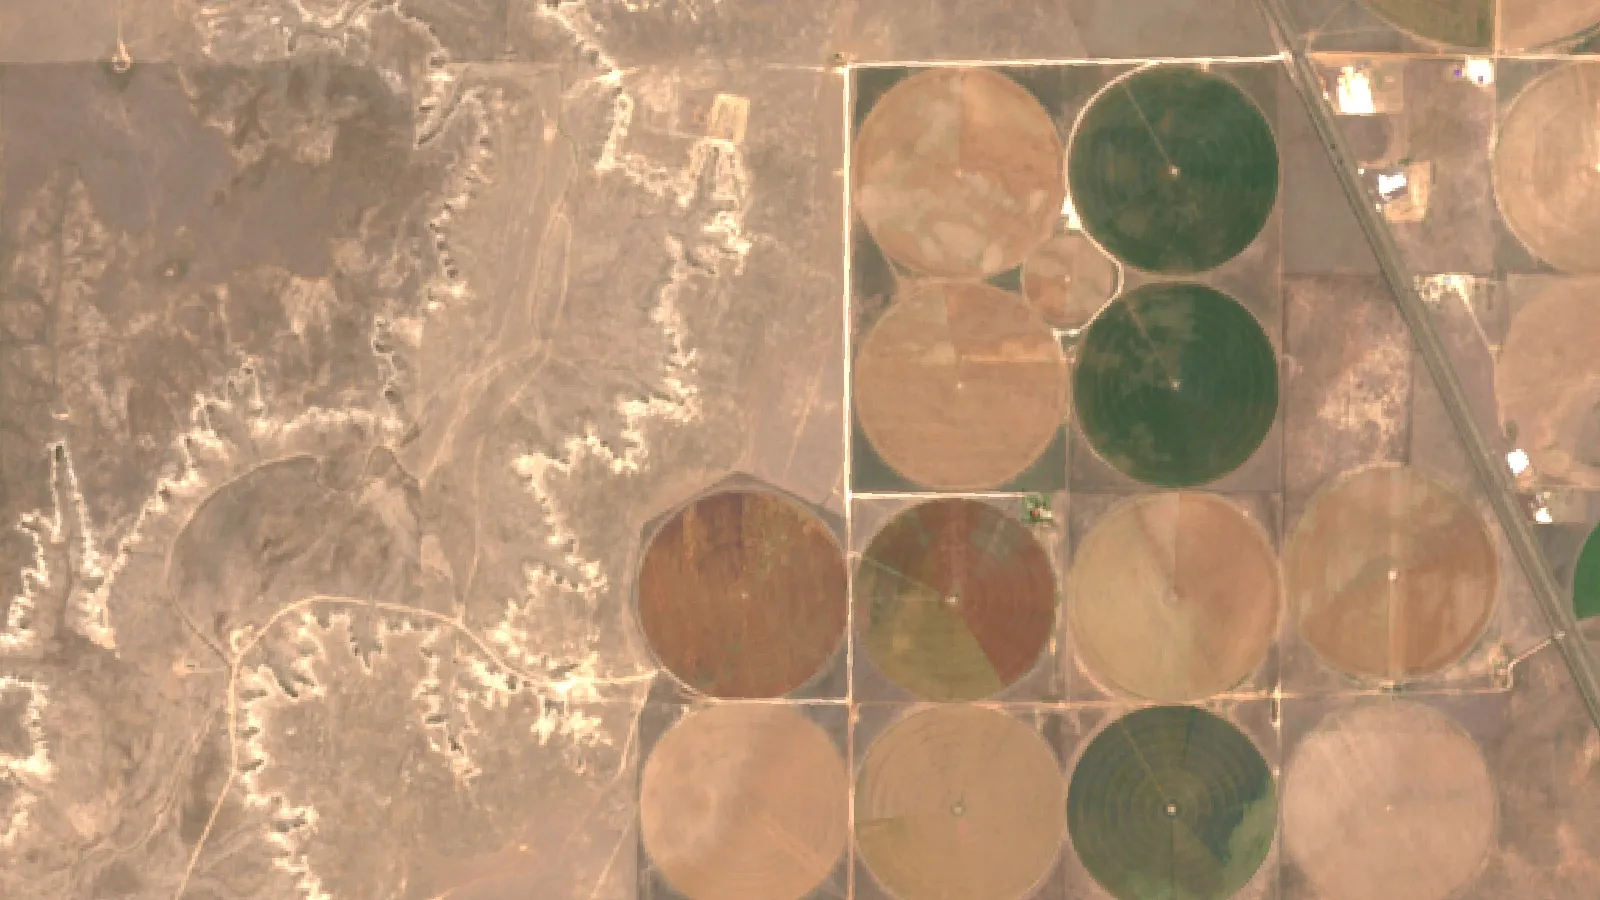
Key takeaways
- Winter wheat covers the most land: 1.09 million acres planted in 2023 in the 10 Panhandle counties with NASS estimates for 2021 to 2023, but only 307,900 acres harvested for grain.
- Corn leads in the irrigated northwest (Sherman, Dallam, Hartley); sorghum fills drier fields; cotton is strongest in Swisher and the southern counties.
- Livestock made up 88% of the $13.65 billion of Panhandle farm sales in 2022; Deaf Smith County ranked first of 3,047 US counties for cattle and calf sales.
- The 26 counties had 1.42 million irrigated acres in 2022, and TWDB says about 95% of Ogallala pumping goes to irrigation; USGS puts the average Texas water-level fall at 41.1 feet from about 1950 to 2015.
- In the High Plains Water District, Castro County fell 17.81 feet in the 10 years to 2026 and the district average fell 0.57 feet from 2025 to 2026.
In this article
- What crops are grown in the Texas Panhandle, ranked
- Texas Panhandle crops by county
- Crop and livestock sales: where the money comes from
- Cattle, feedlots and dairies shape the crop mix
- Irrigation and the Ogallala Aquifer
- Ogallala water levels by county
- How Texas farmers use irrigation water
- How many years of water does your well have?
- Weather and climate: why harvested acres swing
- Agriculture in the Great Plains of Texas
- How satellite and field data help Panhandle growers
- How we checked the numbers
- FAQ
The main crops grown in the Texas Panhandle are winter wheat, corn, grain sorghum and cotton, plus hay and silage that feed the region’s cattle and dairy herds. In the 2022 Census of Agriculture (USDA NASS), the 26 Panhandle counties sold $13.65 billion of farm products, and 88% of that came from livestock, mostly cattle and milk (our sum of the county profiles).
So the crop map and the cattle map are closely linked. Part of the wheat is grazed by cattle before harvest, and much of the corn and sorghum ends up as feed or silage. Below you will find the crops ranked with dated acres and sales, a county table, charts of sales and groundwater, a short history of how irrigation and feedlots shaped the area, and a calculator that estimates how many years of water your own well has left.
What crops are grown in the Texas Panhandle, ranked
The Handbook of Texas (Texas State Historical Association) defines the Panhandle as the 26 northernmost counties of the state, about 25,610 square miles, bounded on the south by the southern line of Swisher County. Most of it sits on the flat High Plains above the Caprock, with rolling plains in the southeast. Lubbock, Hale and Gaines counties lie further south on the South Plains, so they are used here only for comparison.
The order below is based on NASS county estimates of planted acres for 2021 to 2023 and on 2022 Census sales. Wheat is clearly first by area. Corn, sorghum and cotton change places from year to year with rain, water and prices.
1. Winter wheat
Where it leads: Deaf Smith, Hansford, Ochiltree and most dryland farms. Main use: grain, and winter grazing for stocker cattle.
Wheat covers more Panhandle cropland than any other crop. In the 10 Panhandle counties with NASS winter wheat estimates for every year from 2021 to 2023, farmers planted 1,090,800 acres in 2023. Only 307,900 acres were harvested for grain (our sum of the county estimates). The gap is normal here. Some fields are grazed out by cattle, and in drought years many dryland fields are abandoned.
Deaf Smith County shows the pattern well. Farmers planted 260,000 acres of winter wheat there in 2023 and harvested 55,300 acres, with a yield of 38 bushels an acre, according to NASS county estimates for Deaf Smith County. Texas A&M AgriLife describes dual-purpose wheat on the Texas High Plains, where wheat sown in September is grazed by cattle and can still be harvested for grain (AgriLife, 2018). Statewide, Texas harvested 2.3 million of its 5.5 million planted wheat acres in 2025 and produced 85.1 million bushels (USDA NASS Crop Production 2025 Summary).
2. Corn for grain and silage
Where it leads: Dallam, Hartley, Sherman and Hansford in the northwest. Main use: feed for feedlots and dairies, and silage.
Corn is the largest crop in the irrigated northwest corner. In the 2022 Census, corn for grain was the top crop by acres in Sherman (92,815 acres), Dallam (78,188 acres) and Hartley (68,758 acres). Hartley also grew 55,552 acres of corn for silage. Dallam farmers planted 112,000 acres of corn in 2023, up from 93,000 in 2021, per NASS county estimates. Hartley County ranked first in Texas for sales of grains and oilseeds in 2022, with $166.8 million, and Sherman ranked second.
Corn here depends on irrigation from the Ogallala Aquifer, which is why most of the corn acres sit in the counties with the most irrigated land. Statewide, Texas produced 288.9 million bushels of corn grain in 2025 at an average price of $4.60 a bushel (USDA NASS Texas state overview).
3. Grain sorghum and sorghum silage
Where it leads: Ochiltree, Deaf Smith, Sherman and Parmer. Main use: feed grain and silage on dryland and limited-water fields.
Sorghum needs less water than corn, so it fills dryland and limited-irrigation fields. In 2022 it was among the top four crops by acres in Deaf Smith (28,020 acres for grain), Ochiltree (34,944 acres), Sherman (36,951 acres) and Dallam (20,706 acres). Parmer grew 28,116 acres of sorghum for silage. In the 10 Panhandle counties with a published 2023 NASS estimate, farmers planted 466,200 acres of sorghum that year (our sum).
Sorghum is tied to the feedlot story. The Handbook of Texas says the feedlot boom that began around Hereford in 1960 grew from a mix of space, climate, cattle and large areas of irrigated hybrid sorghum. Texas grew 100.7 million bushels of grain sorghum in 2025, about 23% of the US crop (our calculation from the NASS Crop Production 2025 Summary).
4. Cotton
Where it leads: Swisher, Hansford and the southern Panhandle counties. Main use: lint and cottonseed.
Cotton is a big Panhandle crop, but the core of Texas cotton farming lies just south, on the South Plains. In 2022, cotton was the top crop by acres in Swisher County (30,716 acres) and third in Hansford (35,615 acres). Further south, Hale County had 95,850 acres and Gaines 95,123 acres. Panhandle cotton and cottonseed sales were at least $268 million in 2022; five counties withheld the figure.
Cotton area swings hard with rain. In the 10 Panhandle counties with NASS estimates for both 2022 and 2023, farmers planted 734,700 acres of upland cotton in 2022 but harvested 271,100, because of severe drought. In 2023 they planted 340,500 acres and harvested 159,270 (our sums of NASS county estimates).
5. Hay, haylage and silage
Where it leads: Castro and Parmer, near the dairies. Main use: roughage for dairy cows and feedlot cattle.
Forage crops are easy to miss in a list of cash crops, but they rank high on Panhandle land. In the 2022 Census, forage (hay and haylage) was the top crop by acres in Castro County (61,669 acres) and Parmer County (50,714 acres), and second in Deaf Smith and Dallam. Corn silage was in the top three in Castro, Hartley, Parmer and Deaf Smith. Statewide, hay and haylage were worth $1.48 billion in 2025, the highest value of any Texas crop, ahead of upland cotton at $1.44 billion (NASS state overview).
6. Potatoes, vegetables and other crops
The Census groups vegetables, melons and potatoes together. Panhandle sales in that group were at least $102 million in 2022, with six counties not shown to protect individual farms. Other crops and hay added at least $143 million. These are small next to grain and cattle, but they matter to some local farms.
Texas Panhandle crops by county
The table shows the top four crops by harvested acres in ten of the largest farm counties by sales. Randall ($730 million) is left out because nearly all its sales are cattle. The acres are from the 2022 Census, a drought year, so harvested areas were lower than usual.
| County | Farm sales, 2022 | Top crops by harvested acres (2022) |
|---|---|---|
| Deaf Smith | $1.89 billion | Wheat 46,447; forage 43,758; corn silage 31,306; sorghum 28,020 |
| Castro | $1.84 billion | Forage 61,669; corn silage 39,924; wheat 26,279; cotton 24,231 |
| Hartley | $1.74 billion | Corn grain 68,758; corn silage 55,552; forage 39,957; wheat 32,305 |
| Parmer | $1.38 billion | Forage 50,714; corn silage 44,246; wheat 30,861; sorghum silage 28,116 |
| Dallam | $1.09 billion | Corn grain 78,188; forage 66,323; wheat 35,643; sorghum 20,706 |
| Sherman | $988 million | Corn grain 92,815; wheat 39,357; cotton 38,414; sorghum 36,951 |
| Hansford | $900 million | Corn grain 57,089; wheat 54,227; cotton 35,615; forage 16,868 |
| Swisher | $750 million | Cotton 30,716; wheat 30,364; forage 17,909; sorghum 13,786 |
| Moore | $707 million | Corn grain 23,824; wheat 23,552; cotton 17,872; sorghum 12,567 |
| Ochiltree | $378 million | Wheat 44,687; sorghum 34,944; corn grain 23,500; cotton 9,728 |
Farm sales in these counties are mostly cattle and milk, not crops. In Deaf Smith and Castro, crops were only 5% of 2022 sales. Hartley and Dallam, with more irrigated grain, were at 16% and 17%. In the South Plains counties used for contrast, the mix flips: Gaines County earned 93% of its $169 million from crops (Gaines County profile).
Chart
Farm sales in the largest Panhandle counties
Market value of agricultural products sold, million US dollars, 2022; 8 of 26 counties
Crop and livestock sales: where the money comes from
Across all 26 Panhandle counties, crops brought in $1.69 billion in 2022 and livestock, poultry and their products $11.96 billion. The Panhandle as a whole made up about 42% of the $32.17 billion of farm products sold in Texas that year (our calculation from the 2022 Census Texas state profile).
Some counties withhold a figure when it would reveal one farm’s sales, marked (D) in the Census. Where that happens our totals are a floor, so the chart says “at least”.
Chart
What Panhandle farms sold, by product group
All 26 Panhandle counties, million US dollars, 2022; at least, where counties withheld data
Cattle, feedlots and dairies shape the crop mix
To understand which crops are grown, start with the cattle. Panhandle cattle and calf sales were at least $8.5 billion in 2022, more than half of the Texas total of $15.5 billion. Deaf Smith ranked first among all 3,047 US counties for cattle and calf sales, Castro third, Hartley sixth and Parmer tenth, according to their Census profiles. Hartley and Castro ranked first and second in Texas for milk sales.
NASS county estimates put cattle and calves in the 26 counties at about 4.33 million head in 2023, up from 3.77 million in 2022. Statewide, Texas had 12.1 million cattle and 2.54 million cattle and calves on feed for slaughter on 1 January 2026 (USDA NASS Cattle report, January 2026).
That demand for feed explains the crop list. Feedlots and dairies buy corn, sorghum, silage and hay close to home, and stocker cattle graze winter wheat. The Handbook of Texas traces the feedlot boom to Hereford in 1960, when space, climate, cattle and irrigated sorghum came together, followed by a collapse in the early 1970s and a more carefully managed industry after it.

▶ Why farms mix crops and cattle: manure, crop leftovers as feed, and spreading risk. · 2:55
Irrigation and the Ogallala Aquifer
Water decides what can be grown. The 26 Panhandle counties had 1.42 million irrigated acres in the 2022 Census (our sum), with the most in Dallam (189,730 acres), Hartley (165,041) and Sherman (151,456). The Ogallala Aquifer lies beneath these counties, and the Handbook of Texas calls it the region’s most valuable resource. The Texas Water Development Board says about 95% of the groundwater pumped from the Ogallala is used for irrigated agriculture, and that water levels have fallen by more than 300 feet in some areas over the last 50 to 60 years, although the rate of decline has slowed.
Chart
Average Ogallala water-level change, about 1950 to 2015
Feet, area-weighted average by state, High Plains aquifer
Texas has lost more water from the aquifer than any other state. The US Geological Survey estimates an area-weighted average fall of 41.1 feet in Texas from about 1950 to 2015, against 15.8 feet for the whole aquifer. Texas accounted for 157.6 million of the 273.2 million acre-feet lost from storage over that period (USGS Scientific Investigations Report 2017-5040). That is about 58% of the total.
Ogallala water levels by county
The High Plains Underground Water Conservation District measured about 1,340 wells in early 2026. Its 2026 water-level summary shows an average drop of 0.57 feet from 2025 to 2026 across the district, and an average saturated thickness of 51 feet. Over 10 years, the Panhandle counties in the district fell by between 17.81 feet (Castro) and 1.08 feet (Randall), while Armstrong rose by 2.20 feet. Northern Panhandle counties such as Dallam and Hartley are not covered by this district’s table.
Chart
10-year water-level change in Panhandle counties of the High Plains Water District
Average change in feet, 10 years to early 2026; Armstrong and Potter averages rest on 10 and 6 wells
How Texas farmers use irrigation water
In the 2023 Irrigation and Water Management Survey, Texas farms applied an average of 1.2 acre-feet of water per irrigated acre. Most decided when to water by looking at the crop: 9,172 of 10,896 irrigating farms named crop condition, while 1,133 used a soil-moisture sensor (USDA NASS Irrigation and Water Management Survey). For the economics of land with wells, see our guide to irrigated agriculture.
Research near Amarillo shows what tighter scheduling can do. At the USDA-ARS lab in Bushland, deficit irrigation at 75% of full kept cotton yields while using at least 20% less water in 2021 and 16% less in 2022, and an automated plant-sensor system scheduled it as well as manual scheduling did, in a two-year study at one site (Frontiers in Plant Science, 2023). The state plans for less irrigation water overall: the 2022 State Water Plan projects Texas irrigation demand falling from 9.4 million acre-feet a year in 2020 to about 7.6 million in 2070, and says more than one-third of irrigation and livestock supply in 2020 came from the Ogallala and Edwards-Trinity (High Plains) aquifers.

▶ Seven farm technologies that save water, fuel and fertilizer, ranked. · 2:24
How many years of water does your well have?
Water districts publish average saturated thickness and yearly declines, but each well is different. Enter your own numbers below. The calculator divides the usable thickness by your yearly decline to give a rough planning figure, and works out how much water you apply. It does not model recharge, well spacing or pump limits, so check the result with your water district.
Try the numbers for your own farm below.
Calculator
How many years of water does your well have left?
Enter your own well and irrigation numbers.
- Water applied per year: 140.0 acre-feet
- Water applied per acre: 1.17 acre-feet
- Above (+) or below (-) the Texas average of 1.2: -0.03 acre-feet/acre
- Pumping cost per year: $16,800
- Pumping cost per acre: $140
Example values only, not a forecast or benchmark. Years left is a straight-line estimate: (saturated thickness minus the minimum thickness you can still pump) divided by the yearly decline; it ignores recharge, well yield and neighbours. The workable minimum is your own judgement; ask your groundwater district. Fixed constants: 12 inches per foot, and the Texas average of 1.2 acre-feet applied per irrigated acre (USDA NASS, 2023 Irrigation and Water Management Survey). For reference, the High Plains Water District average saturated thickness was 51 feet and the average 2025 to 2026 change was a 0.57-foot fall (HPWD, 2026).
Weather and climate: why harvested acres swing
The Panhandle is dry and windy. The Handbook of Texas gives average rainfall of about 17 inches a year in the western counties and about 21.5 inches in the east, with a growing season of 178 to 217 days. Elevation falls from about 4,700 feet in Dallam County to about 2,000 feet in Childress County. By comparison, the long-term average for all of Texas is 27.2 inches (NOAA Texas State Climate Summary, 2022).
Heat, dry air and wind together hurt wheat most. A study in Nature Communications (2022) found that these hot-dry-windy events became more frequent in the US Great Plains from 1982 to 2020, that each 10 hours of them between heading and maturity cut wheat yields by about 4%, and that the panhandles of Texas and Oklahoma and southwest Kansas were among the most affected areas. The USDA Southern Plains Climate Hub notes $16.5 billion in drought crop-insurance payouts in the region since 1989.
The result shows in the gap between planted and harvested wheat. In the 10 counties with NASS wheat estimates for all three years, 45% of planted wheat acres were harvested for grain in 2021, 23% in the 2022 drought and 28% in 2023 (our calculation from NASS county estimates). Grazing explains part of the gap in every year.
Chart
Winter wheat planted vs harvested for grain, Panhandle
Thousand acres, the 10 Panhandle counties with NASS estimates in all three years
Agriculture in the Great Plains of Texas
The Texas Panhandle is the northern part of the High Plains, which the Handbook of Texas describes as the northern and western side of Texas from the Panhandle to the Pecos River. The Handbook places most of the Texas Panhandle in the hard winter wheat belt of the Great Plains, with cotton and grain sorghum dominant south of Plainview. The Handbook’s High Plains entry notes that the area was once all grazing country, and that ranching remains important in the drier west and in the deep-sand areas of the southwest.
The High Plains aquifer that supports this farming underlies about 111.8 million acres in eight states, from South Dakota and Wyoming to Texas and New Mexico (USGS, 2017). The same mix of irrigated grain, dryland wheat and cattle is found across the Southern Plains, which is why the Texas and Oklahoma panhandles and southwest Kansas face similar water and weather risks.
Natural resources and economic activities
Farming is the largest land use, but not the only economic activity in the Great Plains region of Texas. The Handbook of Texas lists the Ogallala Aquifer as the region’s most valuable resource, describes deep, loamy and clayey High Plains soils and native short-grass prairie, and notes oil and gas fields, helium extraction in Moore County from 1943, and the Pantex plant in Carson County. Amarillo grew up where the railroads crossed and remains the main trade center.
The main farm activities are:
- Cattle feeding and ranching: the largest source of farm income, as shown above.
- Dairies: among counties that publish the figure, the largest Panhandle milk sales in 2022 were in Hartley, Castro, Moore and Deaf Smith counties (Parmer, Dallam and six other counties withheld it).
- Irrigated grain: corn and sorghum for feed, mainly on Ogallala wells.
- Dryland and grazed wheat: the largest crop by planted acres.
- Cotton: mainly in the southern counties and on the South Plains below them.
Our separate article on farming the Great Plains covers technology and challenges across the whole region. This page stays with the Texas Panhandle crops question.
How satellite and field data help Panhandle growers
Large Panhandle farms spread over thousands of acres, with pivots, dryland fields and grazed wheat side by side. Satellite images can show which fields are growing well and which are falling behind, so scouting time goes where it is needed. They show changes in plant growth, not the cause, so a field visit is still needed to find out whether the problem is water, pests or nutrients.
The Farmonaut Satellite + AI Farm Monitoring System offers field-level crop-health maps, viewed through the Large-Scale Farm Management Platform or the Farmonaut app.
Related pages on our site: Agriculture API, Satellite Data API, Developer Docs, Fleet Management, Carbon Footprinting, Product Traceability and Crop Loan and Insurance.
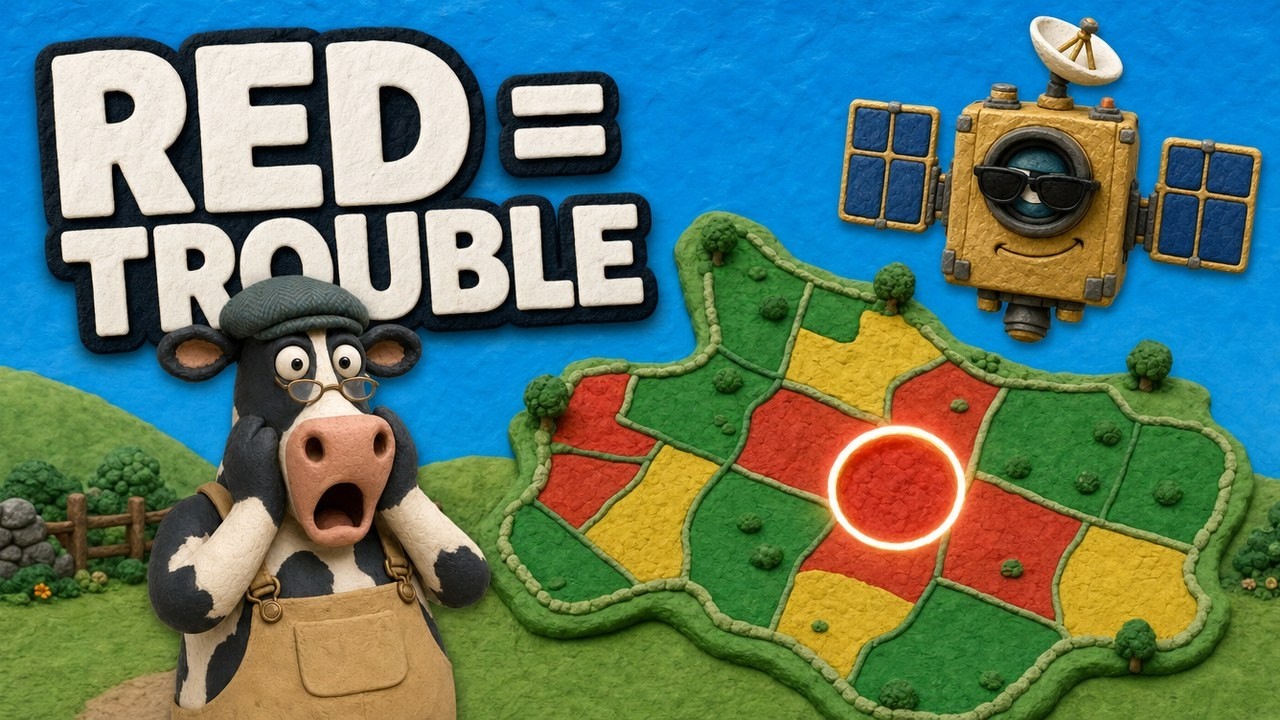
▶ How satellite NDVI maps show crop stress across a large farm before it is visible from the ground. · 4:09
How we checked the numbers
All acres and sales come from USDA NASS: the 2022 Census of Agriculture county profiles for the 26 Panhandle counties and the NASS Texas county estimates for 2021 to 2023. We added up the county figures ourselves, so totals are labelled as our sums. Where NASS withholds a value (D), or does not publish a county estimate, the total is a lower bound. Sums that compare years use only the counties NASS published in every year shown. Statewide prices and production come from the NASS Crop Production 2025 Summary (January 2026) and the NASS Texas state overview (Quick Stats, October 2026). The 2022 Census year was a severe drought year, so harvested acres and crop sales for that year are lower than in a normal season.
We cover a connected topic in Texas Agriculture Commissioner: 7 Ways to Advance Farming.
FAQ
What is the main crop in the Texas Panhandle?
Winter wheat covers the most acres. In 2023, the 10 Panhandle counties with NASS wheat estimates for 2021 to 2023 planted 1.09 million acres of it. Much of it is dryland, and part of it is grazed by cattle rather than harvested for grain.
Is the Texas Panhandle good for farming?
Yes, where water is available. The soils are deep and the land is flat, and the 26 counties sold $13.65 billion of farm products in 2022. Rain is only about 17 to 21.5 inches a year, so high yields depend on Ogallala wells, which are falling in many places.
Does the Texas Panhandle grow cotton?
Yes. Panhandle farmers planted 734,700 acres of upland cotton in 2022 and 340,500 acres in 2023 in the 10 counties with NASS estimates for both years. The largest cotton area in Texas is just south, around Lubbock, Hale and Gaines counties on the South Plains.
Why are there so many feedlots in the Texas Panhandle?
Space, a dry climate, local cattle and large supplies of feed grain. The Handbook of Texas dates the feedlot boom to Hereford in 1960. In the 2022 Census, Deaf Smith County led all US counties in cattle and calf sales.
How fast is the Ogallala Aquifer falling in the Panhandle?
It varies by county. In the High Plains Water District, the 10-year change to 2026 ranged from a 17.81-foot drop in Castro County to a 2.20-foot rise in Armstrong County. The district average fell 0.57 feet between 2025 and 2026.
What are the economic activities in the Great Plains region of Texas?
Cattle feeding, ranching, dairies, irrigated corn and sorghum, wheat and cotton are the main farm activities. The region also has oil and gas, helium and the Pantex plant in Carson County, according to the Handbook of Texas.
Farmonaut agriculture API
Add field-level satellite data to your agtech product
Use the Farmonaut agriculture API to pull crop-health and weather layers for Panhandle fields into your own platform.




Keep reading
Sources
- USDA NASS, 2022 Census of Agriculture, Deaf Smith County profile (2024): nass.usda.gov
- USDA NASS, 2022 Census of Agriculture, Castro County profile (2024): nass.usda.gov
- USDA NASS, 2022 Census of Agriculture, Hartley County profile (2024): nass.usda.gov
- USDA NASS, 2022 Census of Agriculture, Sherman County profile (2024): nass.usda.gov
- USDA NASS, 2022 Census of Agriculture, Gaines County profile (2024): nass.usda.gov
- USDA NASS, 2022 Census of Agriculture, Texas state profile (2024): nass.usda.gov
- USDA NASS, 2022 Census of Agriculture, Texas county profiles index (all 26 Panhandle county profiles): nass.usda.gov
- USDA NASS, Texas county estimates 2021-2023, Deaf Smith County: nass.usda.gov
- USDA NASS, Texas county estimates 2021-2023, Dallam County: nass.usda.gov
- USDA NASS, Texas county estimates index (crop and cattle county estimates, all 26 Panhandle counties): nass.usda.gov
- USDA NASS, Crop Production 2025 Summary (January 2026): release.nass.usda.gov
- USDA NASS, 2025 State Agriculture Overview: Texas (Quick Stats, accessed October 2026): nass.usda.gov
- USDA NASS, Cattle (January 30, 2026): release.nass.usda.gov
- USDA NASS, 2023 Irrigation and Water Management Survey (2024): nass.usda.gov
- USGS, McGuire: Water-level and recoverable water in storage changes, High Plains aquifer, predevelopment to 2015, SIR 2017-5040 (2017): pubs.usgs.gov
- USGS, High Plains aquifer water-level changes publication brief (June 2017): ne.water.usgs.gov
- High Plains Underground Water Conservation District, 2026 Water Level Measurements: hpwd.org
- Texas Water Development Board, Ogallala Aquifer: twdb.texas.gov
- Texas Water Development Board, Water for Texas: 2022 State Water Plan: twdb.texas.gov
- Texas State Historical Association, Handbook of Texas: Panhandle (Rathjen): tshaonline.org
- Texas State Historical Association, Handbook of Texas: High Plains: tshaonline.org
- Texas A&M AgriLife, High Plains wheat Top Picks list released (September 18, 2018): soilcrop.tamu.edu
- O’Shaughnessy et al., Sensor feedback system enables automated deficit irrigation scheduling for cotton, Frontiers in Plant Science (2023): frontiersin.org
- Zhao et al., U.S. winter wheat yield loss attributed to compound hot-dry-windy events, Nature Communications (2022): nature.com
- NOAA NCEI / NCICS, Texas State Climate Summary (2022): statesummaries.ncics.org
- USDA Southern Plains Climate Hub, Weather and climate risks in the Southern Plains: climatehubs.usda.gov
Discussion
Questions, corrections or field experience? Share them below. First-time comments are reviewed before they appear, and your email is never published.
No comments yet. Be the first to add a question or your experience.

 Green Bite Farm
 FCF India
 Unifrutti Gulf
 Deluxe Conseil
 TVS Electronics
 BW Pipelines
 WICO
 Gen Chayat
 Chimera Innovation
 SkyHarvest
 Polaris Digitech
 Teledarbas
 Wild Oak Farm
 SFX
 Doodlakine

 Licence holder · Niger · Gold










