

Farm testing tools · Buyer guide
Agricultural Machinery Testing Instruments and Lab Costs
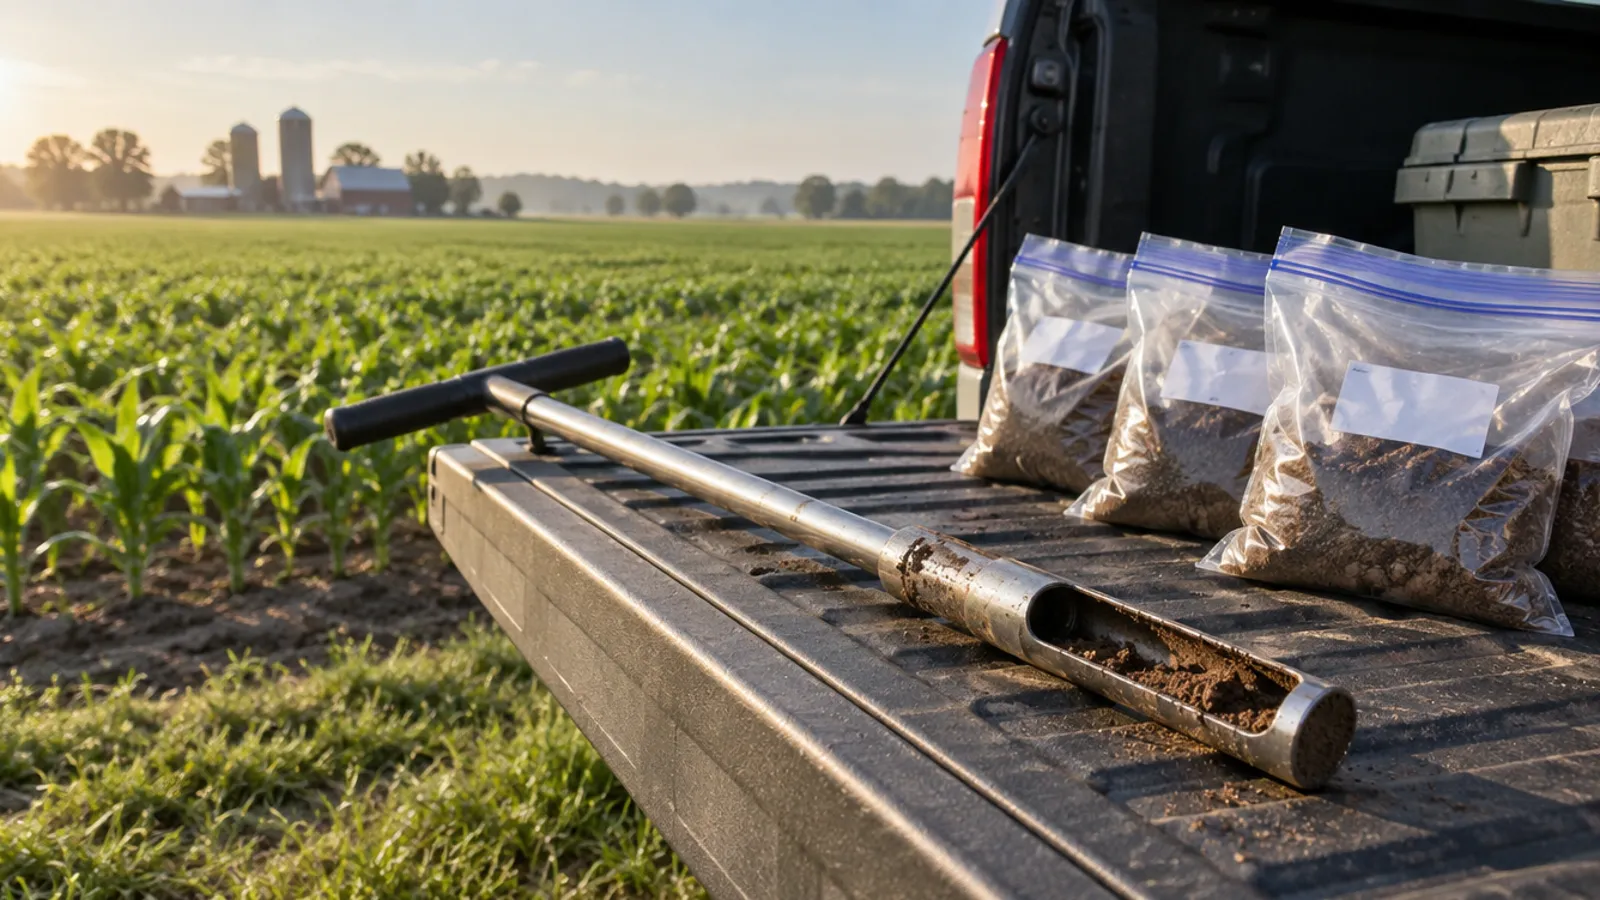
Agricultural machinery testing instruments check what a tractor or sprayer delivers; soil lab equipment checks what the field needs. Among the packages compared here, list prices per sample run from US$10 at Penn State to US$180 at Cornell (read 26 October 2026).
Key takeaways
- Sprayer checks need a tape, a watch and a measuring jar; adjust if the rate is more than 5 percent off or a nozzle is 10 percent off the average (Ohio State Extension).
- The Nebraska Tractor Test Laboratory reports PTO, hydraulic, three-point and drawbar tests to OECD Code 2 and reports 2,053 tractors tested since 1920.
- Soil test list prices, read 26 October 2026: Penn State US$10, Oregon State US$66 (basic nutrient, plus US$7 preparation), Cornell US$100 to US$180.
- A 160-acre field is 16 samples at one per 10 acres or 64 on a 2.5-acre grid (Iowa State Extension).
- With modest sample numbers, mailing samples usually beats owning an analyzer; the calculator uses your own quotes to test that.
In this article
- Agricultural machinery testing instruments and what they check
- Soil testing lab equipment for agriculture: price per sample
- Which instrument sits behind each test
- How the price spread looks across labs
- Should you buy an analyzer or send samples out?
- How many samples will you need, and what will they cost?
- A checklist for choosing equipment or a lab
- From lab result to machine
- Common mistakes with machine and soil tests
- What a soil test does not tell you
- Satellite checks between sample dates
- How we checked the numbers
- FAQ
- Summary: match the tool to the question
Agricultural machinery testing instruments are the tools that check what a tractor or sprayer really delivers: dynamometers, flow meters, measuring jars and stopwatches. The soil-side tools answer a different question, what the field needs, and they are priced per sample. A boom sprayer check needs only a tape, a watch and a measuring jar, according to Ohio State Extension. A soil sample costs US$10 at Penn State’s lab and US$180 for Cornell’s top package (list prices read on 26 October 2026).
This guide covers both sides. It shows how the machine tests work, what labs charge, which instruments sit behind each test, and when owning an analyzer beats mailing samples. It also has a break-even calculator, two charts built from the labs’ own price pages and one on sprayer rate errors.
Agricultural machinery testing instruments and what they check
Machine tests fall into three groups: the tractor itself, the sprayer or spreader behind it, and the soil the wheels run on. Each uses a different tool, and each has a public method you can follow.
Tractor performance: the Nebraska test
The University of Nebraska Tractor Test Laboratory is the officially designated tractor testing station for the United States. It tests to the OECD codes, and a report that is officially approved must be accepted by every country that follows the codes. Its power take-off (PTO) runs are done on a dynamometer, and drawbar runs are done on a track when the outdoor temperature is between 40 and 80 degrees. Its home page reports 2,053 tractors tested since 1920 (the page does not date the count).
Under OECD Code 2, the mandatory procedures are PTO testing, hydraulic flow testing, three-point linkage testing and drawbar testing, as the lab’s own history page explains. The same page says hydraulic power measurement began in 1988 and noise testing in 1971. For a buyer, the point is simple: a published test report gives measured PTO and drawbar numbers, so you can compare them with the brochure.
How to read a tractor test report
A test report is only useful if you know which line matches your work. Look at PTO power if you run a baler, mower or pump. Look at drawbar pull and slip if you pull tillage tools or a planter. Look at hydraulic flow if your implements run on remotes, and at three-point lift capacity if you carry heavy mounted tools. The lab says its reports follow the OECD tests, so the same line means the same thing from one report to the next.
The Nebraska lab also checks whether a maker’s claims hold. Its history page describes Board Action No. 18, which sets how PTO and drawbar performance claims are evaluated. It also notes that field implements often draw power from more than one source, for example drawbar and hydraulics together, and that the lab is working with USDA-funded researchers to link engine data from the tractor’s data bus with the power measured in official tests. Until that work lands, a test report tells you what the tractor can deliver on the test track, not exactly what your tillage tool will draw in your soil.
Sprayer calibration: tape, watch and jar
Sprayer checks are the cheapest machine test, because the tools cost very little. Ohio State’s method catches the output of each nozzle for the time the sprayer needs to cover 1/128 of an acre. Because a gallon holds 128 ounces, the ounces caught equal the application rate in gallons per acre. If one nozzle is more than 10 percent above or below the average, clean or replace it. If the overall rate is more than 5 percent from the rate you intend, change pressure or speed and test again (Ohioline FABE-520).
Colorado State Extension gives the nozzle sizing formula: flow in gallons per minute equals gallons per acre times miles per hour times nozzle spacing in inches, divided by 5,940. It also reports that a brass nozzle can pass 10 to 15 percent more liquid after 50 hours of spraying, against about 2 percent for hardened stainless steel. It cites a Nebraska study in which two-thirds of applicators had rate errors above 5 percent, and a North Dakota study in which 60 percent of tested sprayers had errors above 10 percent (CSU Extension 5.003). Always follow the product label and local rules for the rate itself.
A worked sprayer example
Say the label asks for 15 gallons per acre, you drive 6 miles per hour and your nozzles sit 20 inches apart. The Colorado State formula gives 15 x 6 x 20 / 5,940 = 0.30 gallons per minute per nozzle. For the jar test, Ohio State’s table says to drive 204 feet at 20-inch spacing, time the run, then catch each nozzle’s spray for that same time. If the jars average 15 ounces, the sprayer applies 15 gallons per acre. These numbers are an example of the method, not a recommendation: use the rate and nozzle chart for your own product, and follow the product label and local rules.
Compaction and in-cab sensors
Soil compaction is measured with a penetrometer. Cornell’s lab even lends one, and it lists a penetrometer loan service next to its sample guides. In the cab, yield monitors show bushels per acre and how yield changes over small areas. USDA’s Economic Research Service dates yield monitors and precision soil sampling to 1993 and variable-rate equipment to 1995 (ERS EIB-248, February 2023).
| Instrument | What it checks | Where the method is set |
|---|---|---|
| PTO dynamometer | Engine power at the shaft | OECD Code 2, Nebraska lab |
| Drawbar load car | Pull force, speed and slip | OECD Code 2, Nebraska lab |
| Catch jar and stopwatch | Output of each spray nozzle | Ohio State FABE-520 |
| Nozzle flow chart | Correct nozzle size for the rate | CSU Extension 5.003 |
| Penetrometer | Soil hardness and compaction | Cornell Soil Health Lab |
| Yield monitor | Yield change across a field | USDA ERS EIB-248 |
Chart
Sprayers and applicators with rate errors
Percent of those tested, two studies with different error limits
Soil testing lab equipment for agriculture: price per sample
Most farms never buy a lab instrument. They pay a university or private lab per sample, and the lab owns the analyzers. These are the list prices on three lab pages, read on 26 October 2026. They are list prices for mail-in samples, not quotes, and labs change them without notice.
| Lab and package | Price per sample | What is included |
|---|---|---|
| Penn State, fertility test | US$10.00 | pH, lime requirement, P, K, Mg, Ca by Mehlich 3 (ICP) |
| Oregon State, basic nutrient | US$66.00 | pH, lime, ammonium-N, nitrate-N, P, K, Mg, Ca, total C and N |
| Oregon State, advanced nutrient | US$81.00 | Basic plus Mn, Cu, Zn, Fe, B |
| Cornell, Basic | US$100.00 | pH, organic matter, P, K, aggregate stability, active carbon |
| Cornell, Standard | US$140.00 | Basic plus texture and respiration |
| Cornell, Standard PLUS | US$160.00 | Standard with a measured ACE protein value |
| Cornell, NRCS-216 | US$180.00 | Standard PLUS with pipette-method particle size |
Read the fine print before you compare. Oregon State’s prices are for 1 to 15 samples and add US$7.00 per sample for grinding, sieving and drying; its page lists a lower price for 16 or more samples and a higher rush price. Penn State charges US$10.00 per sample and notes that volume discounts exist. Cornell’s packages need 5 cups of soil per sample and ask you to ship cool and fast (Cornell package page; Oregon State price table).
Extras add up. Penn State lists nitrate nitrogen at US$8, organic matter at US$5, soluble salts at US$5 and combustion total nitrogen at US$15 per sample, on top of the standard test. Oregon State lists a pH test at US$9 and electrical conductivity at US$10 for 1 to 15 samples, and a heavy-metal panel (arsenic, cadmium, chromium, copper, nickel, lead, zinc) at US$41.
Which instrument sits behind each test
A lab price is really a bundle of instrument time. These are the links between a test and the equipment, as the labs describe them.
- Plasma emission (ICP) analyzers: Penn State runs its standard fertility test by the Mehlich 3 (ICP) method, which gives phosphorus, potassium, magnesium and calcium in one run. Oregon State notes that some extractions need an extra colorimetric or ICP step.
- pH and conductivity meters: the cheapest lines on every price list. Oregon State sells pH, EC or both as single tests.
- Combustion analyzers: measure total nitrogen and total carbon. Penn State lists total nitrogen by combustion at US$15 per sample.
- Texture methods: Oregon State’s CEMA 216 Core package reports texture by hydrometer, while Cornell’s NRCS-216 package uses the pipette method.
- Soil health procedures: Cornell’s packages bundle aggregate stability, active carbon, respiration and ACE protein, and its page lists the tests included in each tier.
Instrument purchase prices vary by maker, configuration and service contract, so use written quotes rather than a rule of thumb. The calculator below takes your quote as an input.

▶ Why organic matter matters in soil and what it does for farming. · 7:33
How the price spread looks across labs
The spread is wide because the packages answer different questions. A fertility test tells you what to put on this season. A soil health package tells you how the soil is changing over years, and it costs 10 to 18 times as much per sample at Cornell as the Penn State fertility test.
Chart
List price per sample, selected packages
US$ per sample, read from lab pages on 26 October 2026; Oregon State excludes US$7 preparation and uses the 1-15 sample price
Volume matters too. Oregon State charges less per sample from the 16th sample on, and the chart below shows the gap for six tests. The saving per sample is small, but a whole-farm grid multiplies it.
Chart
Oregon State price per sample by batch size
US$ per sample, excluding US$7 preparation, tests with both prices listed
Should you buy an analyzer or send samples out?
If your sample count is modest, sending samples out is usually cheaper. A lab spreads the instrument cost over many customers, and a single farm often has far fewer samples. Ownership only makes sense when the number of samples is high enough that lab fees exceed the yearly cost of the instrument, supplies, upkeep and a trained person.
The calculator below compares the two. Every input is yours. The defaults are round examples chosen to land near break-even, not benchmarks or quotes.
Try the numbers for your own farm below.
Calculator
Is owning an analyzer cheaper than sending samples out?
Enter your own quotes and sample counts.
- Lab fees per year: $60,000
- Cost of owning per year: $61,000
- Break-even samples per year: 2,040 samples
- Owning cost per sample: $30
Example values only, not benchmarks or quotes: replace every price with today’s quote. The sum counts the analyzer price spread evenly over its life, plus upkeep and supplies. It leaves out staff time, space, training, quality checks and interest on the purchase money, which add to the cost of owning, and any resale value, which lowers it. A positive result means owning costs more than sending samples out.
How many samples will you need, and what will they cost?
The sample count drives everything above. Iowa State Extension recommends that each sample represent 10 acres or less of uniform soil, and gives one sample per 2.5 acres as a suggested minimum grid size, so no finer than that (Iowa State PM 287). The University of Arizona says a composite sample is the standard and that 15 to 20 cores are collected per site (Arizona AZ2147).
That means a 160-acre field sampled at one per 10 acres is 16 samples, while the same field on a 2.5-acre grid is 64. At a US$10 test, that is US$160 against US$640 before shipping. At a US$100 soil health package it is US$1,600 against US$6,400.
| Package | 16 samples | 64 samples |
|---|---|---|
| Penn State fertility | US$160 | US$640 |
| Oregon State basic nutrient | US$1,024 | US$4,096 |
| Cornell Basic | US$1,600 | US$6,400 |
| Cornell Standard | US$2,240 | US$8,960 |
The Oregon State line uses the 16-plus price of US$57.00 plus US$7.00 preparation per sample. All lines exclude shipping, and Cornell’s list shows no volume price. Totals are list prices times sample count, nothing more.
A checklist for choosing equipment or a lab
- List the parameters you need. Fertility needs pH, lime requirement and the main nutrients. Soil health adds carbon, aggregates and respiration. Contaminant screening needs a metals panel.
- Compare the sample basis. Check whether the price includes sample preparation, and which sample-count band it applies to.
- Ask for the method. Mehlich 3 and Modified Morgan results are not interchangeable. Keep the same lab and method year to year so you can compare results.
- Check the data format. Make sure results export in a file your farm software or variable-rate controller can read.
- Ask about turnaround. Penn State asks you not to call the lab unless results are long overdue, and recommends tracking your shipment. Cornell asks for rapid shipping and cool samples.
- Sample at a consistent time. Iowa State advises against winter sampling or sampling in a growing crop for pH, phosphorus and potassium, because the research calibrations rest on fall or spring samples.
- Check cost-share. NRCS conservation practice 216 covers soil health testing. State offices publish their own payment schedules; Pennsylvania’s bulletin dated 11 March 2026 lists several practice 216 components and expired on 30 September 2026, so ask your state office for the current schedule (NRCS Pennsylvania bulletin).
From lab result to machine
A soil test only helps when it changes what a machine does. The link is the map. Variable-rate spreaders and planters read a prescription built from sample points, and those points are only as good as your sampling plan. USDA’s Economic Research Service found that auto-steer and guidance systems covered 5.3 percent of planted corn acres in 2001 and 58 percent in 2016, but that except for cotton, fewer than 25 percent of the smaller row-crop farms (the first acreage quintile) used any of yield maps, soil maps, variable-rate technology or guidance (ERS EIB-248, 2023). ERS notes that scale benefits may explain part of that gap.
Before you rely on a prescription, run the machine checks above. A spreader or sprayer that is 10 percent off puts a good map to waste. Calibrate first, then apply.
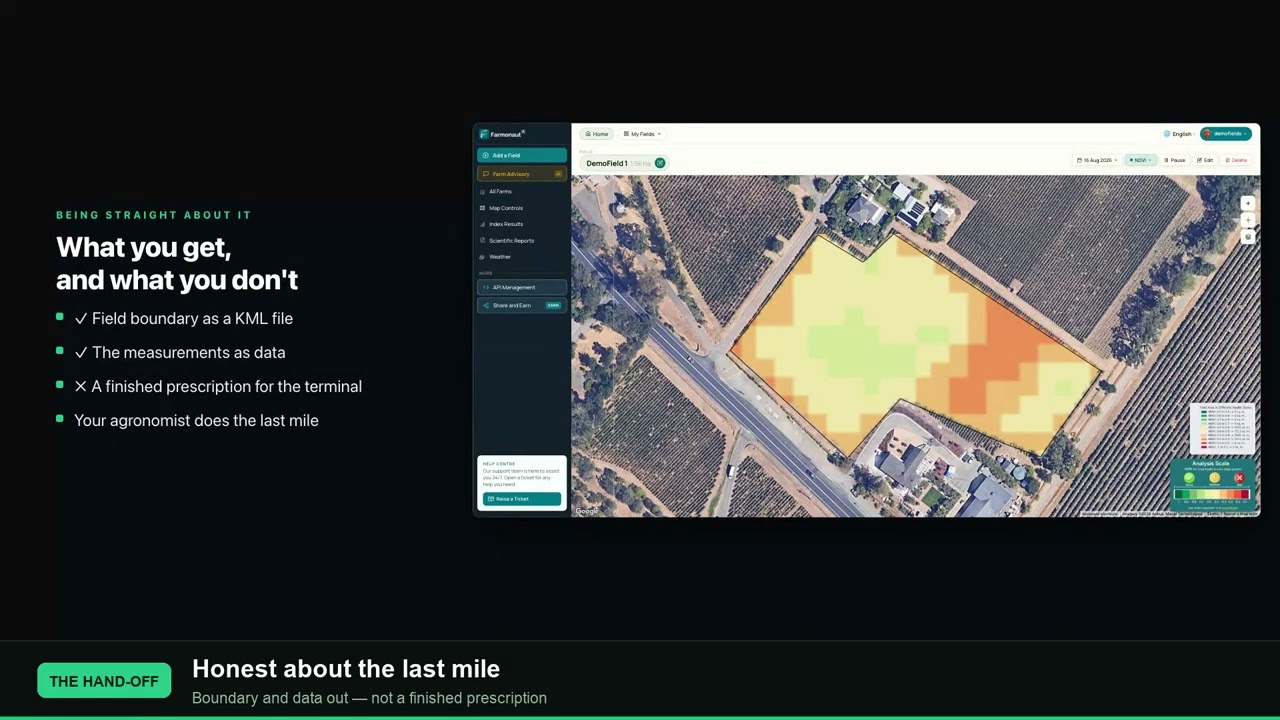
▶ How satellite maps and precision farming equipment work together. · 2:12
Common mistakes with machine and soil tests
- Calibrating with a worn nozzle set. Replace worn tips first, or the jar test measures a problem you are about to repeat.
- Testing at a different speed from the field. Ohio State’s method times the real drive over the measured distance, so use your normal spraying speed.
- Changing labs every year. A change in method can look like a change in the soil.
- Comparing list prices without the basics. Check preparation fees, batch bands, shipping and which nutrients are in the package.
- Sampling once and forgetting where. Record the lab, package and date so a later test is comparable. Mark the sampling points on a map or in your farm software.
What a soil test does not tell you
A soil test result depends on the method as much as on the soil. Penn State reports its main nutrients by Mehlich 3, while Cornell’s packages report phosphorus and potassium by Modified Morgan extraction. Each lab calibrates its recommendations to its own method, so moving a sample from one lab to another can change the number and the advice. Pick a lab whose recommendations are written for your crop and region, and stay with it.
A test also reflects the sample, not the field. If the cores come from one corner, or from a headland where lime was dumped, the result misleads whatever the instrument. This is why the sampling guides above set the number of cores, the depth and the area each sample may represent. Good instruments cannot fix a poor sample.
Satellite checks between sample dates
Lab tests give you a point in time. Satellites show vegetation change across the whole field between samples, though they do not measure nutrients. The Farmonaut Satellite + AI Farm Monitoring System offers this kind of field-wide view, and it works alongside lab sampling rather than in place of it. A probe or lab still wins when you need a number for a nutrient, pH or moisture at depth.
Use satellite change maps to decide where to send the next samples: sample the zones that look different, not only the ones that are easy to reach.
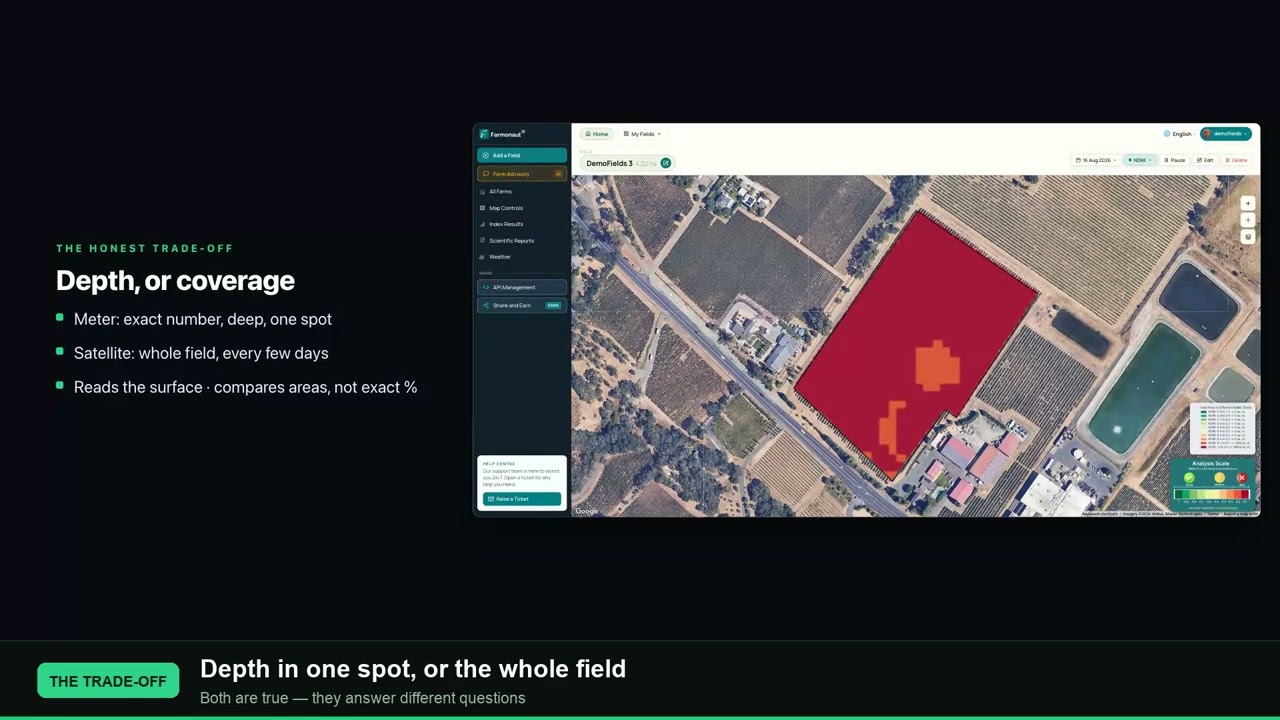
▶ What a satellite measures across a field and where a soil moisture probe still wins. · 2:11
How we checked the numbers
Prices come from the three lab pages named above and were read on 26 October 2026. Machine-test facts come from the Nebraska Tractor Test Laboratory, Ohio State Extension and Colorado State Extension. Adoption figures come from USDA’s Economic Research Service (February 2023). We did not use market-research estimates, because we could not check them against a primary source. Where a source gives no figure, we leave it out.
Related pages on our site: agronomic soil testing, carbon footprinting, fleet management, product traceability, crop loans and insurance, satellite and weather API documentation, developer API and farm admin app.
FAQ
What are agricultural machinery testing instruments?
They are the tools used to measure how farm machines perform: dynamometers and load cars for tractor power, catch jars and flow meters for sprayers, and penetrometers for compaction. The Nebraska Tractor Test Laboratory publishes the official US tractor tests, and Extension services publish the sprayer methods.
How much does a basic soil test cost?
Penn State’s standard fertility test lists at US$10.00 per sample (read 26 October 2026). Oregon State’s basic nutrient package lists at US$66.00 per sample for 1 to 15 samples, plus US$7.00 for sample preparation. Cornell’s soil health packages run from US$100 to US$180.
How often should I calibrate a sprayer?
Calibrate whenever you change nozzles, pressure or speed, and check often for wear. Colorado State reports that brass nozzles can pass 10 to 15 percent more liquid after 50 hours, against about 2 percent for hardened stainless steel. Follow the product label and local rules for the rate.
How many soil samples does a field need?
Iowa State Extension recommends that each sample represent 10 acres or less of uniform soil, with a grid no finer than one sample per 2.5 acres when you want detailed maps. Arizona Extension says a composite sample takes 15 to 20 cores per site.
Do I need to own soil lab equipment?
Usually not. Owning only pays off when lab fees per year exceed the yearly cost of the analyzer, supplies, upkeep and staff. Use the calculator with your own quotes to test it.
What does NRCS practice 216 cover?
It covers soil health testing. Oregon State sells CEMA 216 Core and Advanced packages, and Cornell’s NRCS-216 package lists at US$180 per sample. Payment rates are set by state, so ask your NRCS office. Check local rules and get professional advice before you commit to a programme.
Summary: match the tool to the question
If the question is whether a machine applies what you set, use a jar, a watch and the published method. If the question is what the field needs, buy the cheapest package that answers it and send enough samples to cover the field. Own an analyzer only when your own numbers say so.
Farmonaut crop monitoring
Watch your fields between lab tests
Use Farmonaut Satellite + AI Farm Monitoring System to see vegetation change across each field and pick where to sample next.




Keep reading


Sources
- Penn State Agricultural Analytical Services Lab, soil fertility testing fees (read 26 Oct 2026): agsci.psu.edu
- Penn State Agricultural Analytical Services Lab, soil testing: agsci.psu.edu
- Cornell Soil Health Laboratory, soil health analysis packages (read 26 Oct 2026): soilhealthlab.cals.cornell.edu
- Cornell Soil Health Laboratory, testing services: soilhealthlab.cals.cornell.edu
- Oregon State University Soil Health Lab, soil testing prices (read 26 Oct 2026): cropandsoil.oregonstate.edu
- University of Nebraska Tractor Test Laboratory, home page: tractortestlab.unl.edu
- University of Nebraska Tractor Test Laboratory, history: tractortestlab.unl.edu
- Ohio State University Extension, Boom Sprayer Calibration FABE-520: ohioline.osu.edu
- Colorado State University Extension, Pesticide Sprayer Calibration Fundamentals 5.003: extension.colostate.edu
- USDA Economic Research Service, Precision Agriculture in the Digital Era, EIB-248 (February 2023): ers.usda.gov
- Iowa State University Extension, Take a Good Soil Sample, PM 287: crops.extension.iastate.edu
- University of Arizona Extension, A Guide to Effective Soil Sampling, AZ2147: extension.arizona.edu
- USDA NRCS Pennsylvania, Bulletin PA 440-26-06 cost list and payment caps (11 March 2026): nrcs-prod.azureedge.us
Discussion
Questions, corrections or field experience? Share them below. First-time comments are reviewed before they appear, and your email is never published.
No comments yet. Be the first to add a question or your experience.

 ZOL Zimbabwe
 Innomick
 Juligerm
 AdBio
 MISE Maroc
 Drift-Sense
 NWNS
 Red August Group
 Farm Inc
 WeMe Global
 Agrotoken
 Blue BearX
 Insignito
 Croptimum
 DnCubed
 Field Capacity
 Indosistim Teknologi
 Liquify Digital

 Licence holder · Niger · Gold
 Licence holder · Nigeria · Gold + lithium










