

Uranium · Mine closure status
Ranger Uranium Mine: Closure Cost, Status and Timeline
Ranger stopped mining in 2012 and processing in January 2021. ERA’s remaining cleanup spend was A$3,127 million at 30 June 2026, and Pit 3 capping, now extended by about 14 months, sets the pace.
Key takeaways
- Ranger produced about 132,000 tonnes of uranium oxide; pit mining ended in 2012 and stockpile processing in January 2021 (Mining.com, 2021; World Nuclear News, 2024).
- ERA’s remaining rehabilitation spend was A$2,959 million undiscounted at 31 December 2025, rising to A$3,127 million at 30 June 2026 (ERA, ASX, 2026).
- Pit 3 capping was suspended in December 2025, resumed in April 2026, and ERA’s August 2026 report adds about 14 months and raises the provision to A$2,435 million (ERA, ASX, August 2026).
- A new rehabilitation authority applies from 9 January 2026; funding now covers work to about the fourth quarter of 2027 (ERA, August 2026).
- Independent monitoring reported no environmentally significant downstream effect over 25 years to 2009 (Supervising Scientist Division, 2009).
In this article
- Ranger uranium mine at a glance
- Where Ranger is and who has a say in it
- Ranger uranium mine history: from discovery to the last oxide
- How much uranium did Ranger produce each year
- What the Ranger mine closure involves
- How much will Ranger rehabilitation cost
- Why the Ranger cleanup timeline slipped
- How water leaving Ranger is monitored
- Who pays for the Ranger cleanup
- Jabiluka and the uranium still in the ground
- What mine planners can learn from the Ranger closure
- Frequently asked questions
Ranger uranium mine at a glance
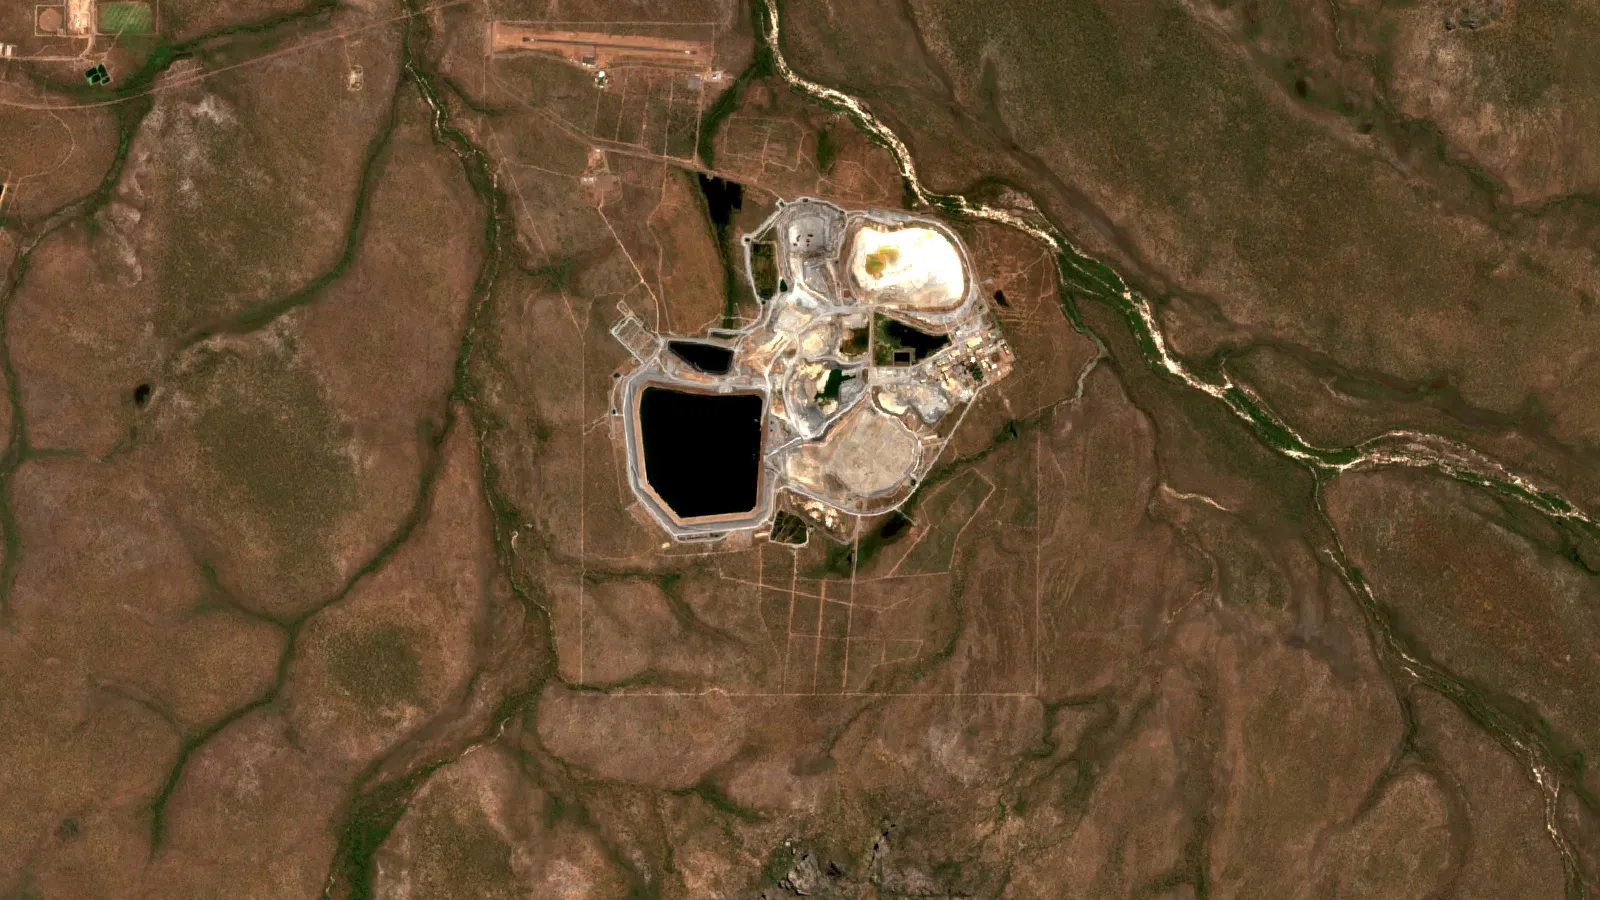
The Ranger uranium mine is a former open-cut mine in Australia’s Northern Territory, about 230 km east of Darwin, next to the town of Jabiru and surrounded by Kakadu National Park (World Nuclear Association). Open-cut mining began in 1980 and the mine produced about 132,000 tonnes of uranium oxide (Mining.com, 2021). It no longer mines anything. The owner, Energy Resources of Australia (ERA), is now cleaning up the site so that it can rejoin Kakadu National Park.
That cleanup is the story today. ERA reported a rehabilitation provision of A$2,301 million at 31 December 2025, and the work that sets the pace, capping the tailings in Pit 3, ran behind plan; in August 2026 ERA added about 14 months to the capping works (ERA full-year report to the ASX, February 2026). A provision is the amount a company sets aside on its books for a known future cost. This page sets out the history, the production record, the cost figures with their dates, what the cleanup involves, how water leaving the site is checked, and what mine planners can take from the case.
| Question | Short answer | Source |
|---|---|---|
| Where is it? | Northern Territory, about 230 km east of Darwin, surrounded by Kakadu National Park | World Nuclear Association |
| When did it mine? | Opened 1981; pit mining ended 2012; stockpile processing ended January 2021 | WNA; World Nuclear News |
| How much uranium? | About 132,000 tonnes of uranium oxide | Mining.com |
| Who owns it? | ERA, held more than 98% by Rio Tinto after the 2024 share offer | ERA, ASX |
| What is left to pay? | A$3,127 million undiscounted, nominal, at 30 June 2026 (A$2,959 million at end of 2025) | ERA, ASX |
Where Ranger is and who has a say in it
Ranger sits inside the Alligator Rivers Region. The mine lease is surrounded by World Heritage-listed Kakadu National Park and lies only a few kilometres upstream of the Ramsar-listed Magela Creek wetlands (Supervising Scientist Division paper, 2009). A Ramsar listing marks a wetland of international importance. That position is why water rules at Ranger are strict, and why the cleanup is a matter for the national government as well as the company (Mining.com).
Ranger and the earlier Nabarlek mine are on Aboriginal land. The World Nuclear Association reports that Aboriginal people receive a 4.25% royalty on sales of uranium from Northern Territory mines (WNA, Australia’s Uranium). The Mirarr Traditional Owners also hold a veto over the neighbouring Jabiluka deposit: under a 2005 long-term care and maintenance agreement it cannot be developed without their consent (ERA, 2026).
Ownership has narrowed over time. Rio Tinto held about 68.4% of ERA for many years and moved to about 86.3% in early 2020 to fund the cleanup (Mining.com, 2021). After ERA’s 2024 share offer, Rio Tinto held more than 98% and began compulsory acquisition of the rest in April 2025. Shareholders holding about 43% of the shares in the notice objected. On 5 June 2026 the Federal Court determined that the purchase may proceed; one shareholder lodged an appeal on 3 July 2026, and ERA’s shares have been suspended from quotation since 15 June 2026 (ERA, 2026).
Ranger uranium mine history: from discovery to the last oxide
Geologists following up airborne radiometric anomalies found the orebody in late 1969, and drilling over the next two years outlined several deposits (Mining.com). The federal government announced in 1977 that new uranium mining would go ahead, starting with Ranger, after a national inquiry. The mine opened in 1981 at about 3,300 tonnes of oxide a year and was later expanded to 5,500 tonnes a year capacity. Ore was treated by conventional acid leach (WNA). Jabiru town was built in 1982, first as a closed community for mine staff.
- 1969: orebody found by radiometric survey work.
- 1981: mine opens; Ranger is the first project cleared after the national inquiry.
- 1997 to 2012: mining of the second pit, which is now being backfilled (WNA).
- June 2015: ERA defers the Ranger Deeps underground project, after spending A$177 million, citing a slow uranium market and the end date of its authority (WNA).
- January 2021: final uranium oxide made from stockpiled ore; mining itself had stopped in 2012 (World Nuclear News, 2024).
- 2022: the last uranium oxide from the project area is sold, so 2023 is the first year with no uranium sales.
Some summaries still say the mine “closed in 2021”. That is only half true: pit mining ended in 2012 and 2021 marks the end of processing stockpiles. The distinction matters when you read older cost and tailings figures.
How much uranium did Ranger produce each year
The chart below shows annual output in tonnes of uranium oxide (U3O8), the form uranium is sold in. Output was between about 1,750 and 2,350 tonnes a year from 2015 to 2019, fell to 1,574 tonnes in 2020, and then collapsed to 29 tonnes in 2021 as the stockpiles ran out (WNA). Geoscience Australia counted Ranger as one of three producing Australian uranium mines in 2019, alongside Olympic Dam and Four Mile (Geoscience Australia, 2020).
Chart
Ranger annual output
Tonnes of U3O8, 2015 to 2022
The resource did not run out; the permission did. WNA lists Ranger with 8,081 tonnes of U3O8 in reserves and 44,883 tonnes of measured and indicated resources, mostly underground. Any restart would have needed a new authority, which is not part of the current cleanup plan.
What the Ranger mine closure involves
The legal target is plain. ERA must restore the Ranger Project Area to a condition suitable for incorporation into Kakadu National Park (ERA, 2026). The main work packages are these.
- Move tailings into Pit 3. Tailings are the fine waste left after uranium is leached out of the ore. Pit 3 is the mined-out pit where they are being stored long term. The 2018 cost rise was largely driven by this transfer (World Nuclear News, 2018).
- Cap and backfill Pit 3. Capping means laying waste rock and a cover over the tailings. ERA calls it the critical path activity, meaning every other step waits on it.
- Treat process water. Water from the plant and tailings is cleaned in a brine concentrator and reverse osmosis plants. The leftover salt waste is injected by borehole below the tailings in Pit 3.
- Shape the final landform and plant it. The site must blend with the surrounding park, and release of treated water depends on closure criteria that are still to be finalised.
- Monitor and maintain. A new Section 41CA Rehabilitation Authority came into force on 9 January 2026 and covers long-term monitoring and maintenance as well as the earthworks.
The 2023 Mine Closure Plan was approved on 6 February 2025, with some exclusions (ERA quarterly report, July 2025). Our earlier note on the Ranger rehabilitation programme covers the same site from the restoration side.

▶ The 7 environmental impacts of mining, explained in clay (2:31) · 2:31
How much will Ranger rehabilitation cost
The estimate has moved up in steps. In December 2018 ERA lifted it from A$512 million to A$808 million, with most of the A$296 million rise tied to moving tailings into Pit 3, more water treatment and revegetation (World Nuclear News, 2018). After the 2022 feasibility study the provision rose sharply in December 2023, and ERA booked a net loss of A$1.6 billion for that year (World Nuclear News, 2024).
Chart
Remaining rehabilitation spend, undiscounted
A$ million, year end and 30 June 2026
| Date | Figure | What it is |
|---|---|---|
| December 2018 | A$808 million | Preliminary feasibility estimate, up from A$512 million |
| 31 December 2024 | A$2,423 million | ERA rehabilitation provision, discounted |
| 31 December 2025 | A$2,301 million | ERA rehabilitation provision, discounted |
| 30 June 2026 | A$2,435 million | Provision (discounted) after the Pit 3 capping method was revised; ERA half-year report, August 2026 |
The provision is a discounted figure, so it is lower than the cash still to be spent. Undiscounted and in nominal dollars, ERA put the remaining spend at A$2,959 million at the end of 2025, down from A$3,080 million a year earlier. By 30 June 2026 it had risen to A$3,127 million nominal (A$2,728 million in real terms) because of the revised Pit 3 capping plan. At the end of 2025 the real-terms figure was A$2,593 million, against A$2,744 million (ERA, 2026). ERA also warns that activities after 2027 and their costs remain highly uncertain.
Yearly payments run at about A$200 million. ERA paid A$211 million in 2023, A$176 million in 2024 and A$221 million in 2025. The 2025 spend came in under forecast because some scope was deferred to later years, not because work finished early. Use the calculator below to test how long a given pot of money lasts at a given spending rate.
Calculator
How long does a rehabilitation fund last?
Enter your fund, yearly spend and remaining closure cost.
- Gap to remaining spend (A$): 2,053 A$ million
- Years to spend remaining total: 15.5 years
Example values only. Defaults are ERA’s 30 June 2026 figures: A$1,074 million of cash and security receivables (including A$573 million in the Trust Fund), A$3,127 million remaining undiscounted nominal spend, and about A$202 million a year (twice the A$101 million paid in H1 2026) (ERA half-year report, August 2026). This is simple division, not ERA’s forecast, and it ignores interest and timing. ERA says it cannot count on drawing more Trust Fund cash until a review of the security agreement is complete, and expects its own funds to last to about the fourth quarter of 2027. Replace the numbers with your own project’s.
Why the Ranger cleanup timeline slipped
The original authority required cleanup to finish by January 2026 (World Nuclear News, 2018). That date passed with work still under way, and a new authority took over on 9 January 2026. Three problems explain most of the delay.
Chart
Rehabilitation payments by year
A$ million paid on rehabilitation
- Wet tailings. Pit 3 capping was held back by slower than planned drying of the tailings surface, mainly in the middle of the pit. Capping was suspended in December 2025 for the rest of the wet season and resumed in April 2026. A trial of the finger-filling method finished in June 2026, and a trial of end tipping for the softest areas is scheduled for the third quarter of 2026. ERA now expects the capping works to run about 14 months longer and cost more (ERA half-year report to the ASX, 21 August 2026).
- More water than modelled. The Ranger Water Dam holds more process water than the December 2024 forecast assumed, although the total salt load is about as expected. A larger volume means more treatment.
- Equipment delays. The Brine Squeezer was due to start on process water from mid-2026, about 12 months later than ERA said in December 2024; ERA’s August 2026 report now expects it in the third quarter of 2026.
ERA’s August 2026 half-year report says the capping change added about 14 months to the works and raised the provision to A$2,435 million. ERA says further increases may follow once it finishes assessing the wider reforecast. Its cash is now expected to last to about the fourth quarter of 2027, and it says more funding will likely be needed by then (ERA half-year report to the ASX, 21 August 2026).
How water leaving Ranger is monitored
The Australian Government’s Supervising Scientist Division is responsible for independent supervision, monitoring and audit of uranium mines in the Alligator Rivers Region. Its aquatic programme combines grab samples for chemistry and radiochemistry, continuous readings of pH, conductivity and turbidity, in-stream toxicity tests, radionuclide levels in freshwater mussels, and surveys of fish and invertebrates at the end of each wet season (Jones et al., 2009).
That paper reported that 25 years of independent monitoring had not shown an environmentally significant effect on aquatic ecosystems downstream. It is a 2009 finding, so it does not cover the cleanup years. Mine-derived water is released to Magela Creek only in the wet season, typically late November to mid-April, through the Coonjimba and Corridor Creek catchments. When the creeks connect to Magela Creek they are diluted by its flow.
Satellite data adds a wide-area check on the surface: vegetation cover, bare ground and surface water can be tracked across a large site and compared with surrounding land through the seasons. It does not replace water sampling or radiation measurements, which need instruments on the ground. For other sites, Farmonaut’s satellite mineral detection work covers exploration screening before any ground is disturbed.
▶ Remote sensing for mining explained in 3 minutes (2:01) · 2:01
Who pays for the Ranger cleanup
Under the 1980 Government Agreement, ERA must provide financial security for rehabilitation, held as cash in the Ranger Rehabilitation Special Account (the Trust Fund) and bank guarantees. At 31 December 2025, ERA held A$1,159 million of cash and security receivables: A$58 million cash at bank, A$540 million in term deposits and A$561 million in the Trust Fund held by the Australian Government. It had no debt and A$126 million of bank guarantees (ERA, 2026). By 30 June 2026 the total was A$1,074 million: A$296 million cash, A$205 million in term deposits and A$573 million in the Trust Fund, with the A$126 million of bank guarantees unchanged (ERA half-year report, August 2026).
Chart
ERA cash and security, 31 December 2025
A$ million, total 1,159 (31 December 2025; at 30 June 2026 the total was 1,074)
ERA raised about A$766 million in its 2024 entitlement offer, its fourth since 2011. It said in February 2026 that this covered planned work to about the third quarter of 2027; lower spending has since stretched that to about the fourth quarter of 2027 (ERA, August 2026). ERA still faces a capital and reserves shortfall of more than A$1 billion. In mid-2025 ERA said it could not count on drawing more Trust Fund cash until a review of the security arrangement with the Commonwealth is complete (ERA quarterly report, July 2025). Rio Tinto has said it remains committed to the rehabilitation reaching a standard similar to the adjacent park (World Nuclear News, 2024).
Jabiluka and the uranium still in the ground
Jabiluka is a separate undeveloped uranium deposit on the same Mirarr country. WNA lists it with 82,945 tonnes of U3O8 in measured and indicated resources. ERA applied in March 2024 to renew the Jabiluka mineral lease. The Northern Territory minister said in July 2024 the lease would not be renewed, ERA started court action, and the Federal Court stayed that decision. ERA’s February 2026 report says the matter is ongoing, and the lease is fully impaired in its accounts (ERA, 2026). Whatever the outcome, development needs the consent of the Mirarr Traditional Owners.
What mine planners can learn from the Ranger closure
Ranger is useful to consultants and licence holders because the numbers are public and have been revised several times. Five checks follow from it.
- Price the water, not only the earthworks. ERA lists water treatment volume and the date direct release is allowed as swing factors. Closure criteria for released water were still to be finalised.
- Test tailings behaviour early. Slow drying and consolidation of wet tailings delayed the capping. ERA models consolidation from in-situ tests, and says the result affects how long expressed water must be collected and treated.
- Keep the authority and the security in step with the schedule. The cleanup outlasted its first permit, and the level of security was set from a 2020 plan while estimates have risen since.
- Plan for repeated reforecasts. The estimate rose from A$512 million to A$808 million in 2018, and the provision reached A$2.4 billion within six years.
- Agree the end use with the land owners. The target of reincorporation into the park is stated in the licence conditions and in ERA’s accounts.
None of this makes Ranger typical. ERA describes it as the largest project of its kind in Australia, and it sits in an unusually sensitive setting. Treat its figures as a reference for the order of magnitude of closure risk, not as a unit cost.
If this topic matters to you, read AMC Hycroft Mining Investment: Cost, Sale and Stake next.
Related reading on this site: Rare Earth Mine Timeline: Real Projects, Years and Costs.
Frequently asked questions
Is the Ranger uranium mine still operating?
No. Pit mining ended in 2012, and the last uranium oxide was made from stockpiled ore in January 2021. ERA’s work now is rehabilitation of the Ranger Project Area.
Where is the Ranger uranium mine located?
It is in the Northern Territory of Australia, about 230 km east of Darwin, beside Jabiru and surrounded by Kakadu National Park.
Who owns the Ranger mine?
Energy Resources of Australia (ERA) holds the project. Rio Tinto owns more than 98% of ERA and has started compulsory acquisition of the remaining shares, which the Federal Court ruled on 5 June 2026 that it may proceed, after holders of about 43% of the shares in the notice objected. An appeal was lodged on 3 July 2026 and is pending.
How much uranium did Ranger produce?
About 132,000 tonnes of uranium oxide over four decades, according to Mining.com. Annual output was 1,574 tonnes in 2020 and 29 tonnes in 2021.
How much will the Ranger cleanup cost?
ERA’s remaining estimated spend was A$3,127 million undiscounted in nominal terms at 30 June 2026 (A$2,959 million at the end of 2025), with a discounted provision of A$2,435 million. Costs after 2027 are described as highly uncertain.
When will Ranger be finished and handed back?
ERA has not given a completion date. A new rehabilitation authority has applied from 9 January 2026, and in August 2026 ERA said Pit 3 capping would take about 14 months longer than planned. ERA’s cash is expected to last to about the fourth quarter of 2027, and more funding will likely be needed by then.
Why was Pit 3 capping delayed?
Tailings in the middle of the pit dried more slowly than planned, which delayed the handover of work areas to the capping contractor. Capping was suspended in December 2025 for the wet season and resumed in April 2026; ERA’s August 2026 report adds about 14 months to the capping works.
Is Ranger inside Kakadu National Park?
The mine lease is surrounded by the park, and the aim is to restore the site so that it can be incorporated into the park.
Who monitors water quality downstream of Ranger?
The Australian Government’s Supervising Scientist Division carries out independent monitoring and audit, and ERA also samples. Both sample upstream and downstream sites on Magela Creek.
What happens to the Jabiluka deposit?
The lease renewal is in court. Under a 2005 agreement the deposit cannot be developed without the consent of the Mirarr Traditional Owners.
Can satellites help monitor a mine closure?
They can track vegetation cover, bare ground and surface water across a whole site over time. They complement, and do not replace, sampling of water and soil on the ground.
This page is for information only. It is not investment advice or legal advice. Cost and schedule figures are the company’s own estimates and can change; confirm them against ERA’s latest ASX announcements.
Farmonaut mining
Map your mining site from space
Request a quote for satellite maps of a licence area, before and during fieldwork.

Mining Pro sample view, synthetic data
Keep reading
Sources
- World Nuclear Association, Australia’s Uranium: world-nuclear.org
- Mining.com, Australia’s Ranger uranium mine ceases production (January 2021): mining.com
- World Nuclear News, ERA updates Ranger rehabilitation costs (December 2018): wnn.world-nuclear.org
- World Nuclear News, Australian miners provide updates (February 2024): wnn.world-nuclear.org
- ERA, Appendix 4E full-year report 2025 (ASX, February 2026): announcements.asx.com.au
- ERA, Appendix 4E full-year report 2024 (ASX, February 2025): announcements.asx.com.au
- ERA, quarterly report to June 2025 (ASX): announcements.asx.com.au
- ERA, Appendix 4D half-year report to 30 June 2026 (ASX, 21 August 2026): clients3.weblink.com.au
- Jones et al., Supervising Scientist Division, integrated monitoring paper (IMWA, 2009): imwa.info
- Geoscience Australia, Australia’s Identified Mineral Resources 2020, commodity summaries: ga.gov.au
Discussion
Questions, corrections or field experience? Share them below. First-time comments are reviewed before they appear, and your email is never published.
No comments yet. Be the first to add a question or your experience.

 Mining SARL
 SenGold Invest SAS
 Sania Corporation
 Sean Mining Limited
 NTS Group (Pty) Ltd
 Mine4Africa
 Lithspo Minerals Limited
 Tintina Mining Group
 Dalgety Minerals Pty Ltd
 Vortex Minerals Pty Ltd
 Faith At Work (Pty) Ltd
 Geotech Mining Solutions plc
 Vulcan International Limited
 Kidepo Associates
 GKY Mining
 Alkimy SARL
 Double A Trading
 GemSprout Metals Limited
 Qader Group
 Ileys General Trading
 SG Gold Mining LLC
 VRV Global Pte Ltd
 Omsri International FZE
 G.I.T.T.











