

Crop Monitoring System: AI, Satellite Data & Costs
Reviewed August 2026 against USDA’s Economic Research Service farm-technology surveys and the USDA NASS Census of Agriculture.
Try it: Satellite vs. Manual Scouting Coverage Calculator →
A crop monitoring system combines satellite or drone imagery, weather data, and machine-learning analysis to flag crop stress, irrigation needs, and yield risk across a field — often days before those problems are visible on foot. The strongest systems pair that detection with a recommendation, so a grower sees not just “this zone is stressed” but what to do about it. Below: how these systems work, what separates the solutions on the market, and where satellite-based monitoring genuinely outperforms scouting versus where it doesn’t.
Demand is real, but adoption is still thin. The global crop monitoring market was valued at $3.02 billion in 2025 and is projected to grow from $3.45 billion in 2026 to $10.09 billion by 2034 — a 14.35% compound annual growth rate — according to Fortune Business Insights. Yet USDA survey data shows most U.S. row-crop acres still aren’t scouted by satellite or drone at all. That gap between market size and on-farm adoption is exactly what this article works through.
What Is a Crop Monitoring System?
At minimum, a crop monitoring system needs four layers working together:
- An imagery layer — satellite passes (public missions like Landsat and Sentinel-2, or commercial constellations), drone flights, or both, capturing multispectral bands that reveal plant stress before it’s visible to the eye.
- An analytics layer — algorithms that turn raw pixels into indices such as NDVI, soil-moisture estimates, and anomaly flags.
- An advisory layer — turning “this zone is stressed” into a specific action: irrigate, scout for pests, or hold off on fertilizer.
- An access layer — a mobile app, web dashboard, or API that puts the data in front of a decision-maker before the window to act closes.
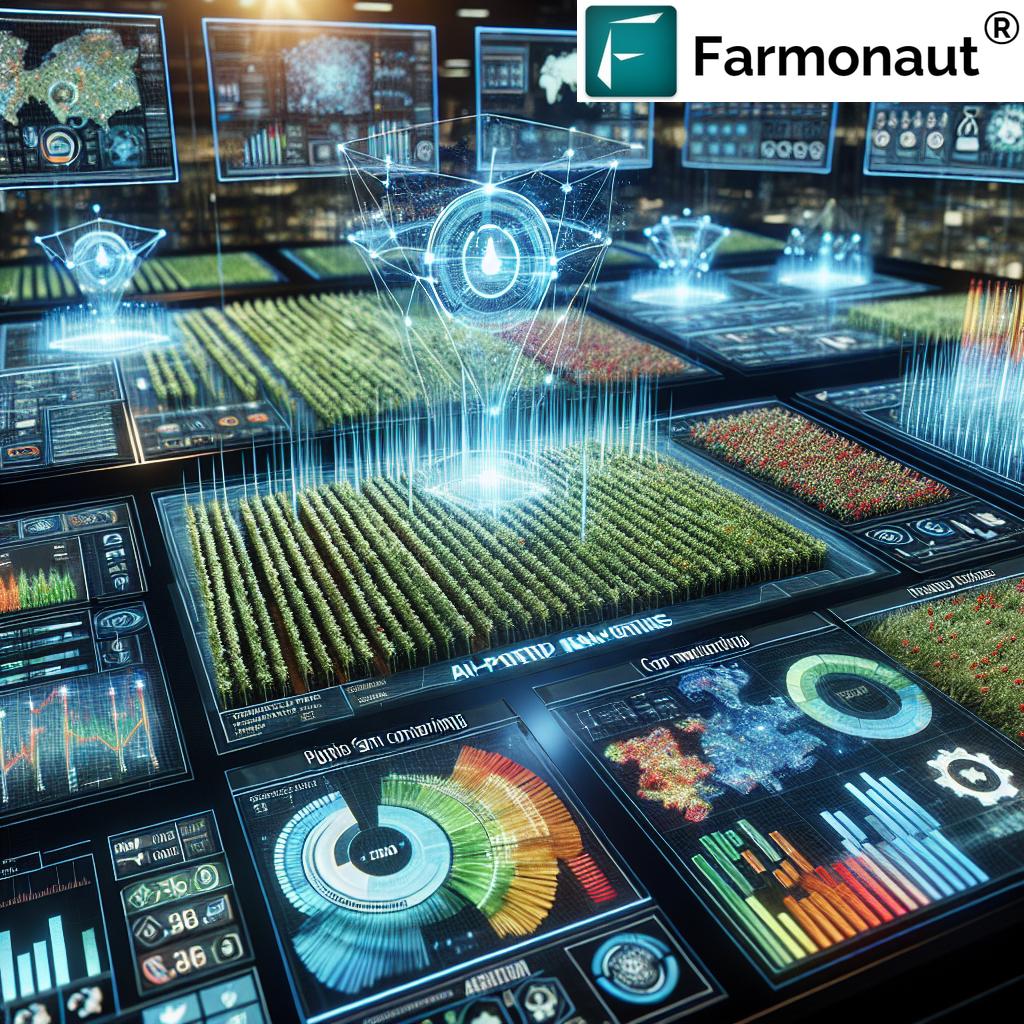
Despite more than a decade of vendors selling into this space, USDA’s Economic Research Service found that aerial imagery — from aircraft, drones, or satellites — was used on just 7.0% of U.S. corn acres in 2016 and 9.8% of soybean acres in 2018, against 3.5% of winter wheat acres in 2017, 2.8% of cotton acres in 2019, and 4.6% of sorghum acres in 2019 (USDA ERS). For comparison, yield maps were already on 43.7% of acres and soil maps on 21.5% in that same period — imagery has lagged well behind other precision tools.
Crop Monitoring Solutions Compared: Scouting, Drones, and Satellite AI
“Crop monitoring solutions” spans a range of tools that trade off cost, coverage, and update frequency very differently. Here’s how the three main approaches compare on the variables that actually drive a buying decision:
| Approach | Field coverage per pass | Revisit frequency | Labor required | Best fit |
|---|---|---|---|---|
| Manual scouting | Limited to what one person can walk in a session | As often as staff time allows | High — one scout, one field at a time | Small acreage, spot-checks between other visits |
| Drone imagery | One field per flight, capped by battery life — check your drone model’s spec sheet for acres per flight | On-demand, limited by pilot availability and airspace rules | Moderate — trained pilot plus flight planning per outing | High-value, close-range detail on select fields |
| Satellite-based AI monitoring | Whole farm, every field, in the same pass | Every 5 days from the Sentinel-2 constellation; every 8 days from Landsat 8/9 combined | Low — no flight or field visit needed to get the image | Multi-field or multi-farm operations wanting continuous coverage |
Those revisit numbers are real satellite specs, not vendor marketing: the European Space Agency confirms Sentinel-2’s two-satellite constellation images the same equatorial location every 5 days (10 days per individual satellite), per ESA. NASA confirms Landsat 8 and 9 together deliver 8-day repeat coverage of global landmasses (16 days per satellite alone), per NASA. A crop monitoring system built on either constellation inherits that cadence; cloud cover can skip a usable pass, which is why AI-driven systems increasingly blend multiple satellite sources to fill gaps.
Use the calculator below to see what that cadence means for your own acreage against your own scouting capacity.
Satellite vs. Manual Scouting Coverage Calculator
Sentinel-2 and Landsat Specs: Resolution, Bands and Revisit
Revisit sets how often you get a new image. Pixel size sets how small a problem you can see. The two free public missions most crop monitoring systems use differ on both.
| Spec | Sentinel-2 | Landsat 8 and 9 (OLI / OLI-2) |
|---|---|---|
| Finest multispectral pixel | 10 m (blue, green, red, near-infrared) | 30 m |
| Other bands | 6 bands at 20 m (red-edge and shortwave infrared); 3 at 60 m for atmosphere checks | 15 m panchromatic band |
| Spectral bands | 13 | 9 on OLI |
| Swath width | 290 km | 185 km |
| Revisit | 10 days per satellite; 5 days at the Equator with two | 16 days per satellite; 8 days with both |
Sources: Copernicus SentiWiki, Sentinel-2 mission; NASA, Operational Land Imager; ESA eoPortal, Landsat 9.
In practice, one 10 m Sentinel-2 pixel covers 100 square metres, and one 30 m Landsat pixel covers 900. A stressed patch a few metres across will be blurred into its neighbours on either. That is why these satellites suit zone-level alerts across a whole farm, while drones remain the tool for plant-level detail on a single field. Sentinel-2 also carries dedicated red-edge bands at 20 m, which the red-edge indices below rely on.
How AI Powers Modern Crop Monitoring Technology
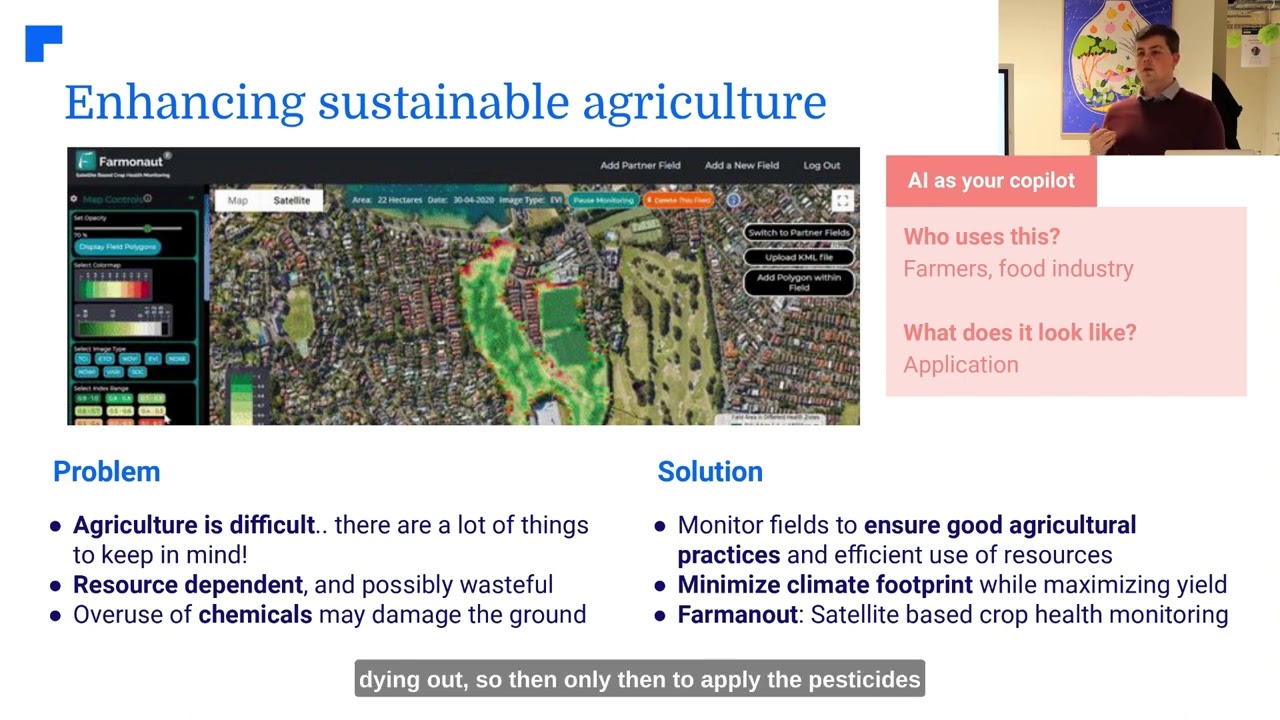
“Crop monitoring AI” isn’t one algorithm — it’s a pipeline. Machine-learning models are trained to recognize what healthy versus stressed vegetation looks like across thousands of prior fields, then applied to new imagery to flag anomalies a human eye would miss at a glance: a 10-acre patch of early drought stress inside an otherwise green field, or a nutrient deficiency showing up in the near-infrared band weeks before it shows up as yellowing leaves. Farmonaut’s Jeevn AI advisory layer takes that a step further, cross-referencing the imagery against weather forecasts and field history to generate a specific recommendation — irrigate this zone, hold fertilizer on that one — rather than a raw stress map. That kind of layered, sensor-plus-model approach is part of the broader shift toward AI-driven smart sensors in farming, where the value isn’t the sensor itself but what the model does with its output.

The commercial case for AI-driven monitoring shows up in market growth, not just farm-level anecdotes. The global crop monitoring market moved from $3.02 billion in 2025 to a projected $3.45 billion in 2026, then to a projected $10.09 billion by 2034 — a 14.35% CAGR over that window, per Fortune Business Insights. That trajectory tracks a broader pattern USDA has documented across precision technologies generally: adoption of guidance autosteering systems reached 52% of midsize farms and 70% of large-scale crop farms in 2023, while yield monitors, yield maps, and soil maps combined were used on 68% of large-scale farms that same year (USDA ERS). Imagery-based monitoring started later than those tools and still trails them in adoption.
Remote Crop Monitoring: What Satellites See That Scouting Misses
“Remote crop monitoring,” “agriculture monitoring,” and “agricultural monitoring” all point at the same core capability: assessing field conditions without a person physically present. The mechanism is multispectral imaging — satellites capture reflectance in bands the human eye can’t see, most importantly near-infrared, which healthy chlorophyll reflects strongly and stressed or dying plant tissue does not. The normalized difference between near-infrared and red reflectance, (NIR − Red) / (NIR + Red), is the NDVI score referenced earlier, and it’s the single most-used vegetation index in agricultural remote sensing because it correlates directly with canopy density and plant vigor.
That correlation has been tested against real harvest data, not just imagery. A 2018 study in the peer-reviewed journal Sensors mapped maize and sunflower yields across the Hetao Irrigation District in North China using NDVI time series from 30-meter HJ-1A/1B satellite imagery spanning 2010–2015. The best-performing model produced a maize yield estimate with a relative error of 6.1% (RMSE 0.75 t/ha) and a sunflower estimate with a relative error of 10.1% (RMSE 0.40 t/ha), with R² between 0.80 and 0.90 for both crops during calibration — and the researchers found yields could be estimated well using NDVI from as early as 50 days before harvest (Yu & Shang, Sensors, 2018). That’s the durable finding to check against any new crop or region: run the same NDVI-vs-harvest comparison on your own fields for two seasons before trusting a monitoring system’s yield estimate at face value, since accuracy varies by crop, soil background, and cloud-free image availability.

Crop Health Indices Compared: NDVI, NDRE and NDWI
Crop health monitoring using remote sensing rests on a few band ratios. Each answers a different question, so a good system shows more than one.
| Index | Formula | What it tracks | Watch out for |
|---|---|---|---|
| NDVI | (NIR − Red) / (NIR + Red) | Green leaf cover and vigour; values run from −1 to +1, and dense green canopy sits around 0.6 to 0.9 (NASA Earth Observatory) | Flattens out once the canopy closes |
| NDRE | (NIR − Red-edge) / (NIR + Red-edge) | Chlorophyll and nitrogen status in mid- and late-season crops | Needs a red-edge band, such as Sentinel-2’s 20 m bands (Copernicus SentiWiki) |
| NDWI (Gao) | (NIR 0.86 µm − SWIR 1.24 µm) / (sum) | Water held in the leaves and canopy (Gao, Remote Sensing of Environment, 1996) | Satellite versions swap in whichever shortwave-infrared band the sensor has |
The NDVI ceiling is the main reason NDRE exists. Once leaves fully cover the rows, red NDVI readings commonly bunch into a narrow range of about 0.85 to 1.0. In corn nitrogen-rate trials at 15 North Dakota sites using ground-based active sensors, red-edge NDVI at the V12 growth stage predicted yield better than red NDVI in most comparisons (Sharma et al., Sensors, 2015). A practical rule follows. Use NDVI early in the season, move to NDRE for nitrogen decisions once the canopy closes, and read NDWI next to rainfall and irrigation records when moisture stress is the worry.
Crop Monitoring and Analytics: Turning Pixels Into Decisions
“Crop monitoring and analytics” is the layer that separates a pretty stress map from a system worth paying for. Raw NDVI imagery tells you where a problem exists; analytics tells you whether it’s new, how it compares to the same field last season, and whether it’s worth acting on before the next satellite pass. Three capabilities do most of the work: pattern recognition across seasons (is this stress recurring in the same corner of the field every year, which usually means a drainage or soil issue rather than a one-off weather event), benchmarking against comparable fields, and risk scoring that combines imagery with weather-forecast data to prioritize which flagged zones need a visit first.
Analytics is also where resource-use decisions get made: matching fertilizer and water application to what a field’s imagery-derived stress history actually shows, rather than applying a flat rate across every acre. That approach is covered in more depth in our breakdown of how data analytics boosts yield, including the specific metrics worth tracking season over season.
Crop Monitoring and Management: From Field Data to Farm Plans
“Crop monitoring and management” is the practical question behind all of the above: once a system flags 40 stressed zones across a season, who decides what happens next, and how does that decision get scheduled and logged? A monitoring system earns its keep only when it’s wired into actual farm management — task scheduling tied to what the imagery shows, a record of what was applied where and when, and a way to compare planned versus actual field activity against the season’s monitoring data. Our guide to strategic farm management covers the five practices that make that connection work in practice, from task prioritization to financial tracking tied back to per-field performance.
The gap between monitoring and management is where most precision-ag investments quietly fail: a system that generates alerts nobody acts on is a more expensive version of not monitoring at all. Before adopting any crop monitoring system, confirm it can push its flags into whatever task-scheduling or record-keeping tool your operation already uses — API access matters here as much as imagery quality.
Crop Monitoring System for Dallas, TX and North Texas Growers
Searches for a “crop monitoring system dallas tx” usually come from one of two places: row-crop and hay operations in the counties ringing the Dallas-Fort Worth metroplex, or agribusinesses managing land across North Texas from an office inside the metro. Both face the same regional pressure — working land near a fast-growing metro is being converted and repriced faster than almost anywhere else in the state, which raises the value of knowing exactly what each remaining acre is producing.
Texas lost nearly 3.7 million acres of working lands to non-agricultural use between 1997 and 2022, with 1.8 million of those acres converted in the final five years of that period alone, according to the Texas A&M Natural Resources Institute’s Texas Land Trends program. Over the same 25 years, the average appraised market value of Texas working lands rose from $499 per acre in 1997 to $1,951 per acre in 2017 and $3,021 per acre in 2022 — a 55% jump in the five years to 2022 alone. Texas Land Trends attributes the pace of fragmentation directly to population growth and rising land values concentrated around the state’s major metro areas, of which Dallas-Fort Worth is one of the largest and fastest-expanding. For growers operating on the shrinking edge of that footprint, a crop monitoring system that documents yield and land condition field-by-field is also documentation that supports land-value and land-use decisions, not just an agronomy tool.
For farm-level counts and current-year figures specific to Dallas County, the USDA NASS 2022 Census of Agriculture county profile is the authoritative source and is republished each five-year census cycle — check it directly for the latest release rather than relying on any figure quoted secondhand.
The Future: Autonomous Equipment and Expanding Coverage
Monitoring data is increasingly the input layer for automated action rather than just a human decision aid. The clearest example is autonomous farm equipment, where a stress zone flagged by satellite imagery can, in principle, route a self-driving sprayer or planter directly to that section of a field without a human first walking it. That integration is still early — most operations today still have a person in the loop between the alert and the machine — but it’s the direction imagery-driven monitoring is heading as both satellite revisit rates and on-farm autonomy mature in parallel.

Getting Started: Apps, API, and Access
Farmonaut’s crop monitoring system is available as a web application, mobile apps for Android and iOS, and a developer API for teams building monitoring into their own software:



For developers integrating satellite and weather data directly into an existing farm-management stack, see the API and the API Developer Docs.
Frequently Asked Questions
Q: How is a crop monitoring system different from a yield map?
A: A yield map records what already happened at harvest, built from combine sensor data. A crop monitoring system tracks conditions during the season — often weekly or better, depending on satellite revisit rate — so a grower can still intervene before harvest.
Q: Does satellite crop monitoring work on cloudy days?
A: Optical satellites like Sentinel-2 and Landsat can’t see through cloud cover, so a scheduled revisit doesn’t guarantee a usable image that day. Systems that blend multiple satellite sources, or that add radar imagery (which isn’t blocked by clouds), reduce how often a pass is wasted.
Q: Is satellite monitoring accurate enough to replace scouting entirely?
A: Published accuracy for NDVI-based yield estimates runs from roughly 6% to 10% relative error depending on crop, per the Hetao Irrigation District study cited above — good enough to prioritize where to scout, not yet a full substitute for ground-truthing on high-value decisions.
Q: Does this work for smaller farms, not just large operations?
A: Yes — USDA data shows adoption is heavily skewed toward large-scale farms today, but the underlying satellite imagery (Sentinel-2, Landsat) is free and public regardless of farm size; the cost difference between providers is in the analytics and advisory layer, not the imagery itself.
A crop monitoring system’s value comes down to whether its imagery, analytics, and advisory layers actually change what gets done in a field before it’s too late to matter — not the resolution number on a spec sheet. Check the adoption and accuracy figures above against your own crop and region using the sources linked throughout, run the coverage calculator against your own acreage, and weigh satellite-based monitoring against scouting and drones on the coverage-versus-labor tradeoff that fits your operation.

 Yaduka Agrotech
 Kalustyan
 Tucor
Tucor Geno
Geno Hayleys Agriculture
 Linx Agritech
 Adinet
 Save Your Soils
 Grandstream Algérie
 XOS Realty
 Geospatial Lab Africa
 Agro La Gándara
 HIPSAC
 ZOL Zimbabwe
 Juligerm
 MISE Maroc
