

China Precision Agriculture Market: Size, Growth, Data
Reviewed August 2026 against USDA Economic Research Service, Market Research Future, and Research and Markets.
China’s applied-AI-in-agriculture market was worth $531.89 million in 2025 and is forecast to reach $6,944.75 million by 2035, a 29.3% compound annual growth rate, according to Market Research Future. Europe’s precision agriculture market stood at $4.87 billion in 2025 with a 13.7% CAGR through 2034. In the United States, 68% of large-scale crop farms used information technologies like yield monitors and mapping software in 2023, versus 13% of small crop farms, per USDA’s Economic Research Service. Those three data points are the actual state of the china agriculture analytics market, china applied ai in agriculture market, and china precision agriculture market right now — not projections dressed up as facts.
This article breaks down what’s driving each of those numbers, how the US and European markets compare, and gives you a way to check whether precision agriculture technology pays back on your own acreage or hectares before you buy it.
Table of Contents
- China’s Precision Agriculture and Applied-AI Market
- US Farm Technology Adoption: What the Data Actually Shows
- Europe and Germany: The Third Data Point
- Comparative Table: US, China, Europe
- Precision Agriculture’s Latest Developments
- Precision Planting Market
- Equipment Maintenance and Consulting: What’s Actually Published
- Payback Calculator
- Where Farmonaut Fits
- FAQ
- Jump to the calculator
China’s Precision Agriculture and Applied-AI Market
Market Research Future sizes China’s applied-AI-in-agriculture market at $531.89 million in 2025, projecting growth to $6,944.75 million by 2035 — a 29.3% CAGR over that ten-year window. That figure covers AI-driven crop management, predictive analytics, and automated monitoring systems sold into Chinese agriculture, not the broader precision agriculture hardware market (sensors, guidance systems, drones) which Chinese government reporting tends to bundle together with AI services rather than break out separately. If you need the two disaggregated, that split isn’t in current public reporting — treat any single figure claiming to cover both as a rough combined estimate rather than a precise breakdown.
What’s driving the 29.3% CAGR is a combination of three forces reported alongside the market sizing: continued government investment in smart-agriculture pilot programmes, rapid uptake of AI-powered crop management systems by commercial-scale operations, and the push toward food self-sufficiency that makes yield optimization a policy priority, not just a farm-economics one. None of that is unique to 2025 — it’s the shape of a decade-long build-out, which is why the CAGR window runs to 2035 rather than stopping at a single year.
For a refreshed number: China’s Ministry of Agriculture tracks Smart Agriculture initiatives on a quarterly basis, and market forecasts for this segment get updated annually by Statista, Market Research Future, and TechSci Research. If you’re modeling this market for planning purposes, pull the latest Market Research Future update rather than treating the $531.89 million 2025 baseline as current beyond this year.
Why This Market Doesn’t Show Up as a Single Clean Number
One reason china precision agriculture market and china connected agriculture market searches turn up scattered, inconsistent figures is that Chinese market reports genuinely conflate categories that Western analysts keep separate — equipment sales, AI software and services, and connectivity/IoT infrastructure often appear in the same topline number depending on the report. Market Research Future’s $531.89 million figure is specifically the applied-AI segment. If a source quotes a much larger number under a similar label, check whether it’s including hardware and connectivity spend before treating the two as comparable.
US Farm Technology Adoption: What the Data Actually Shows
The US market question isn’t really “how big is precision agriculture” — it’s “who’s actually using it,” and USDA’s Economic Research Service has the clearest answer. As of 2023, 68% of large-scale crop farms in the US used information technologies such as yield monitors and yield maps, compared with just 13% of small crop farms. That’s a 55-percentage-point gap, and it’s the single most important number in the entire US precision agriculture story: this is a scale-driven adoption curve, not a uniform rollout.
Autoguidance tells a similar story from a different angle. Among acres receiving custom chemical or fertilizer application, 85% were treated using autoguidance systems in 2023, according to USDA’s survey of precision agriculture dealers. That figure reflects adoption at the custom-applicator level — the businesses large farms hire to spray and spread inputs — rather than on-farm ownership of guidance-equipped machinery, so it’s a proxy for how deeply autoguidance has penetrated commercial application work, not a count of farmer-owned GPS tractors.
These figures come from USDA ERS’s chart series, drawn from the Agricultural Resource Management Survey (ARMS). The next full USDA Census of Agriculture lands in 2029, but ARMS-based adoption estimates update annually in between census years. If you’re citing US adoption rates for planning past 2026, pull the current release from USDA NASS QuickStats rather than reusing the 2023 figures above — that’s the actual database these numbers are drawn from, and it updates as new ARMS rounds are processed.
Precision Agriculture’s Latest Developments
Three structural shifts define where US and global precision agriculture technology is actually heading, independent of any single year’s headlines:
- The adoption gap is the story, not the technology. A 55-point gap between large and small farms (68% vs. 13%) means the ceiling for market growth is bounded by how fast mid-size and small operations close that gap — not by whether the technology itself improves further.
- Custom application is where autoguidance actually lives. At 85% of custom-applied acres, autoguidance is close to saturated in that channel. Further growth in this metric has to come from on-farm ownership rather than the custom-applicator segment, which is already near its ceiling.
- Regional markets are diverging in scale and driver. China’s growth is policy- and food-security-driven with a 29.3% CAGR off a small base; Europe’s is regulation- and farm-structure-driven off a much larger $4.87 billion base with a 13.7% CAGR. These are not the same market maturing at different speeds — they’re structurally different markets.
The durable way to track this going forward: watch the large-farm/small-farm adoption gap in USDA’s annual ARMS-based releases, watch China’s Ministry of Agriculture quarterly Smart Agriculture reporting, and watch Eurostat/Destatis annual farm-structure updates. Those three data streams, not any single forecast headline, are what actually move this market.
Europe and Germany: The Third Data Point
Europe’s precision agriculture market was valued at $4.87 billion in 2025, with a projected 13.7% CAGR through 2034, according to Research and Markets. Germany accounts for roughly 24% of that European total as of 2024 — the largest single-country share on the continent, ahead of France and the UK.
Germany’s adoption pattern mirrors the US large-farm/small-farm split closely. The average German farm is about 60 hectares, and among the roughly 260,000 farms tracked, farms larger than 100 hectares show markedly higher technology adoption: 65% of German farms over 100 hectares use three or more precision agriculture technologies, as of 2024. That’s the same scale-driven pattern USDA finds in the US, expressed in hectares instead of acres.
For current European figures, Eurostat and Germany’s Destatis both publish annual precision-agriculture and farm-structure updates, and the EU Farm Accountancy Data Network (FADN) refreshes farm-size data yearly. Those are the sources to check rather than reusing the 2024/2025 baseline above once a new farming year has closed.
Comparative Table: US, China, Europe
| Metric | United States | China | Europe (incl. Germany) |
|---|---|---|---|
| Market size / adoption baseline | 68% of large farms use info tech (2023) | $531.89M applied-AI market (2025) | $4.87B precision ag market (2025) |
| Forecast / gap metric | 13% of small farms use info tech (2023) | $6,944.75M projected by 2035 | 13.7% CAGR through 2034 |
| Growth rate | Not separately forecast in this dataset | 29.3% CAGR, 2025–2035 | 13.7% CAGR, 2025–2034 |
| Primary driver | Farm-scale economics (custom application 85% autoguided) | Food security policy, government smart-ag programmes | Farm structure — Germany 65% of 100+ ha farms use 3+ techs |
| Source | USDA Economic Research Service, 2023 | Market Research Future, 2025 | Research and Markets / market intelligence, 2024–2025 |
The comparison matters because these three markets aren’t racing toward the same finish line. The US question is closing the scale gap between large and small operations. China’s question is whether a 29.3% CAGR off a $531.89 million base can actually reach $6.9 billion by 2035. Europe’s question is whether the rest of the continent can catch up to Germany’s 65% adoption rate among its largest farms.
[Image 1]
Precision Planting Market
Precision planting — seed placement technology using GPS guidance, variable-rate seeders, and row-by-row control — sits inside the broader information-technology adoption figures USDA tracks, rather than as its own separately sized market in current public data. The clearest proxy available is the same 68%-versus-13% large-farm/small-farm split above: planting technology adoption follows farm size just as closely as yield-monitoring adoption does, because both require the same upfront capital outlay and the same GPS/guidance infrastructure investment.
If you need planting-specific figures broken out from general information-technology adoption, USDA NASS’s Census of Agriculture and ARMS surveys are the source to check — the ERS chart series cited throughout this article is drawn from that same underlying survey data, and more granular equipment-category breakdowns are available directly through USDA NASS QuickStats.
Equipment Maintenance and Consulting: What’s Actually Published
Two adjacent questions worth a straight answer rather than a guess: how much does it cost to maintain precision agriculture equipment, and what does precision agriculture consulting cost?
On maintenance: market research reports covering US precision agriculture equipment repair and service spending exist, but they sit behind paid industry-research paywalls rather than in public USDA, USGS, or Eurostat datasets. There’s no free, citable government figure for this specific line item at the time of this review. If maintenance cost is central to your budgeting, the practical path is a paid report from an agricultural-equipment market research provider, or direct quotes from your equipment dealer’s service department, rather than a public benchmark.
On consulting: precision agriculture consulting market size and billing rates in the US and Germany are similarly thin in public data — what exists is largely proprietary industry survey material, not government statistics. The honest answer is that no verified public figure for either market currently exists in USDA, Eurostat, or Destatis reporting. Treat any specific dollar figure you see quoted for either market with real skepticism unless it cites a named, checkable source.
Precision Agriculture Adoption Payback Calculator
Use the figures above to estimate your own payback timeline for adopting information-technology-based precision agriculture (yield monitors, mapping, guidance) rather than relying on a market-wide average that may not reflect your farm’s scale.
Assumptions: this calculator applies a flat percentage yield gain uniformly across all acres and assumes that gain converts directly to added revenue at your entered per-acre price, with no adjustment for input-cost changes, weather variability, or gradual adoption ramp-up. It excludes maintenance and consulting costs, since no verified public benchmark exists for either (see above) — add your own dealer or consultant quotes to the investment figure for a fuller picture. It is a planning estimate, not a financial projection.
Where Farmonaut Fits
The USDA and Research and Markets figures above are about aggregate adoption and market size — they don’t tell you whether precision agriculture technology will pay back on your specific fields. That’s the gap satellite-based monitoring is built to close at a per-farm level, without requiring the upfront hardware investment that skews adoption toward the large-farm end of USDA’s 68%/13% split.
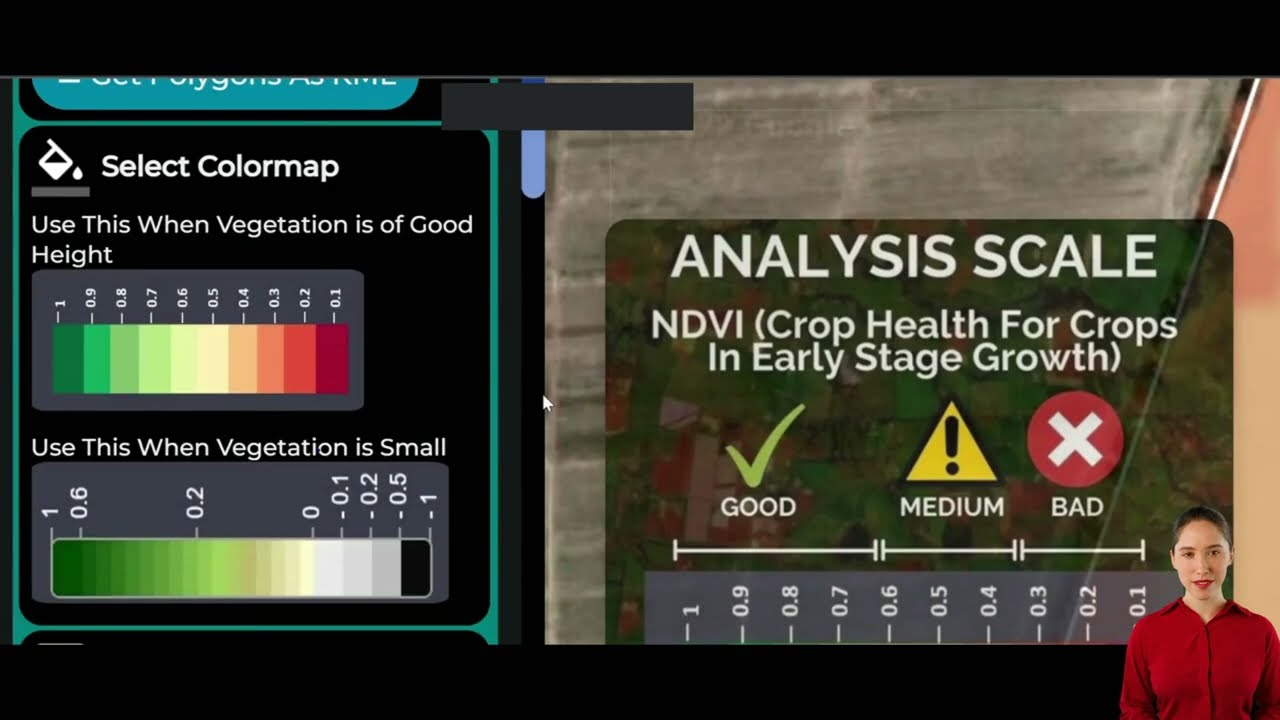
Farmonaut’s platform provides satellite-based crop health monitoring, an AI-powered advisory system (Jeevn AI) for input recommendations, blockchain-based traceability for supply chains, and resource management tools for water and fertilizer optimization — all accessible without the capital outlay that keeps small farms at 13% information-technology adoption versus large farms’ 68%, per USDA ERS.
Try the web app directly:

Developers integrating satellite and weather data into their own tools can use the API and API Developer Docs.
For a walkthrough of the platform, this video covers AI-driven monitoring in practice:

[Image 2]
Mobile access matters for the same reason: farmers checking field conditions between equipment passes need it on a phone, not just a desktop dashboard.


Related reading on adoption drivers and specific use cases: our breakdown of precision agriculture market growth trends and drivers, how agritech is affecting rural areas, and China’s approach to urban farming and vertical agriculture given its land constraints.
For platform basics, see the web app tutorial, and for the sensor and IoT side of adoption, our guides on IoT breakthroughs in farming technology and space farming tools cover the hardware layer this article’s adoption figures are measuring.
This recap covers platform milestones and roadmap direction:

Frequently Asked Questions
Q: How big is China’s applied-AI-in-agriculture market?
A: $531.89 million in 2025, projected to reach $6,944.75 million by 2035 — a 29.3% CAGR — per Market Research Future’s China Applied AI in Agriculture Market report.
Q: What share of US farms actually use precision agriculture technology?
A: 68% of large-scale crop farms used information technologies (yield monitors, mapping) in 2023, versus 13% of small crop farms, according to USDA’s Economic Research Service. That 55-point gap is the central fact of US adoption, not a footnote to it.
Q: How does Europe’s precision agriculture market compare to China’s?
A: Europe’s market was $4.87 billion in 2025 with a 13.7% CAGR through 2034 — roughly nine times China’s applied-AI market size in dollar terms in 2025, though the two figures measure different scopes (Europe’s covers broader precision ag; China’s figure is AI-services specific). Germany holds about 24% of the European total as of 2024.
Q: Is there a separate precision planting market figure?
A: No separately published figure exists in current USDA or Eurostat data; planting technology adoption is folded into the general information-technology adoption rates (68% large farms, 13% small farms, 2023). USDA NASS QuickStats has more granular equipment-category data if you need it broken out further.
Q: What’s not publicly available about this market?
A: US precision agriculture equipment maintenance/repair spending and precision agriculture consulting market size and rates are not covered by public government statistics as of this review — both exist only in paid industry research or proprietary surveys. Don’t trust an uncited number for either.
Q: What’s driving autoguidance adoption in the US specifically?
A: Custom-application acreage — fields treated by hired applicators rather than the farm’s own equipment — reached 85% autoguidance use in 2023, per USDA’s survey of precision agriculture dealers. This reflects near-saturation in the custom-applicator channel specifically, not full on-farm ownership of guided equipment.
Conclusion: Track the Sources, Not the Headlines
The durable way to use this article isn’t to memorize the 2025 figures — it’s to know where each one comes from and how often it refreshes. China’s applied-AI market gets an annual forecast update from Market Research Future, Statista, and TechSci Research, with quarterly government tracking underneath it. US adoption rates update through USDA’s Agricultural Resource Management Survey annually between Census of Agriculture years, with the next full census due in 2029. European and German figures refresh annually through Eurostat, Destatis, and the EU Farm Accountancy Data Network. Check those four sources directly — USDA NASS QuickStats, Market Research Future’s China report, and Research and Markets’ Europe report — before citing any of these numbers past this review date.
For deeper platform-level detail on interpreting satellite data day to day, this tutorial walks through the workflow:
Explore subscription options for satellite-based crop monitoring:
For more on the technology layer behind these adoption numbers, see our guide to smart agriculture and yield-boosting tools.

 SFX
SFX BACF Africa
 Nivia
Nivia Doodlakine
 Exurbia Geospatial
 FieldZero
 Indico Company
 Kubota
 FFBS
FFBS Jontra
 Tucor
Tucor Hayleys Agriculture
