

Agriculture Accounting & Delivery Software: US Buyer’s Guide
Reviewed August 2026 against Mordor Intelligence’s Farm Management Software Market report and USDA NASS commodity price data.
Try it: Run your own numbers →
Farm management software adoption sits at 61% across North American operations as of 2024, rising to 68% among farms larger than 400 hectares (roughly 990 acres), according to Mordor Intelligence. If you’re comparing agriculture accounting software against a general delivery or logistics platform, the honest answer is that most operations need both, connected — not a single tool that claims to do everything. This guide breaks down what each category actually does, what it costs, and how to check the numbers yourself before you buy.
The Market: Adoption Rates and Size
The global farm management software market — the category that includes both accounting and delivery/logistics tools — was valued at $3.4 billion in 2024, per multiple industry sources tracked by Grand View Research / GMI Insights. Projections from MarketsandMarkets put it at $5.8 billion by 2029, which implies roughly 11% compound annual growth from the 2024 base. That growth is being driven less by new-farmer adoption and more by large operations replacing spreadsheets with connected systems.
Two adoption figures matter here and they measure different things. Mordor Intelligence puts North American farm management software adoption at 61% for 2024, and that rate climbs to 68% specifically on farms larger than 400 hectares. Market Research Future separately reports 63% adoption across all farm sizes reporting any software usage in the 2024-2025 period — a broader, softer definition that includes partial or single-module use. The gap between 61-68% and 63% is mostly about scale: bigger operations adopt full platforms; smaller ones adopt a spreadsheet replacement or a single mobile app and stop there. If you run under 200 acres, expect to be shopping in that second, lighter-adoption tier, and price accordingly.
One adoption number worth naming for a durable comparison point: yield monitoring and mapping software specifically sits at 76% adoption among large North American farms as of 2024, per Mordor Intelligence — meaningfully higher than farm management software as a whole, because combine-mounted yield monitors have been standard equipment for two decades and the software just rides along. Full accounting and delivery-logistics platforms are newer purchases and adopt slower.
“Software Agriculture” — What the Category Actually Covers
Searches for “software agriculture” typically mean one of three distinct things, and vendors blur the lines on purpose because it’s good for sales:
- Farm accounting software — bookkeeping, chart of accounts, tax prep, crop-wise margin tracking. See this guide to building an agriculture chart of accounts for the accounting-specific setup steps.
- Precision agriculture / farm management software — yield mapping, variable-rate input planning, satellite and drone imagery. Trimble Ag Software and similar platforms sit here.
- Delivery and supply chain software — order capture, route optimization, fleet tracking, cold-chain monitoring for produce and inputs moving between farm, distributor, and buyer.
These three categories share almost no code and solve almost no overlapping problems, which is exactly why buying “an agriculture software” without specifying which of the three you need is how operations end up with three unconnected logins and no single ledger. The rest of this guide treats each separately, then shows where an integration layer — like satellite data feeding into an accounting system’s crop budgets — actually saves work.
Agriculture Accounting: What It Tracks and Why It’s Different
“Accounting for agriculture,” “accounting agriculture,” and “accounting in agriculture” are effectively the same search intent with different word order, and the answer doesn’t change: farm accounting differs from general small-business accounting because revenue and cost don’t align to a calendar year, assets depreciate on schedules general ledgers don’t model well (breeding livestock, orchards, irrigation systems), and a single crop’s true cost-to-produce spans multiple accounting periods between planting and sale.
What Modern Farm Accounting Software Adds Beyond a Ledger
- Crop-wise and field-wise margin analysis — cost-to-produce broken out by field or crop, not just by expense category.
- Commodity price integration — USDA NASS published a 2024/2025 marketing-year average price of $4.24 per bushel for corn and $5.52 per bushel for wheat (USDA NASS, February 2025 report) — software that pulls current MYA prices into revenue projections saves a manual lookup every planning cycle.
- Equipment depreciation schedules tuned to IRS farm-specific rules (Section 179, MACRS for ag equipment).
- Bank and lender reporting templates formatted for the balance sheets ag lenders expect at loan renewal.
We looked for published data on hours saved or dollar ROI from adopting farm accounting software — no farmer-survey or peer-reviewed study turned up a citable figure for this. If a vendor quotes you a specific ROI percentage or hours-saved number, ask for their source; treat an unsourced claim the same way we’re treating this gap — as absent, not as false.
Similarly, we found no published per-acre or per-tonne figures for 2024-2025 fertilizer, fuel, seed, or labor costs that we could cite with confidence — USDA’s Economic Research Service tracks this under Farm Income and Wealth Statistics, but the specific dataset we tried to pull was inaccessible in this pass. If your accounting software’s crop budget templates ask for input costs, pull your own recent invoices or check USDA ERS’s farm income data directly rather than trusting a vendor’s default assumption.
Satellite-based crop monitoring data feeding into loan and insurance underwriting is one place accounting and precision-ag data are starting to merge — lenders increasingly want field-level verification alongside the ledger.
Agriculture Delivery Software
Agriculture delivery software automates order capture, dispatch, and status tracking for inputs (seed, fertilizer, crop protection) moving to the farm and produce moving off it. The core capability set:
- Order capture and inventory sync across multiple warehouses or distribution points.
- Route optimization — shortening transit time and fuel spend on repeat delivery runs.
- Real-time status tracking from dispatch to confirmed delivery.
- Batch and lot traceability tying a delivered product back to harvest date and origin field.
General-purpose delivery management platforms built for broader logistics — not agriculture-specific — are also a legitimate option for operations whose main pain point is routing and fleet visibility rather than crop-specific traceability. Metrobi’s delivery management software is one example of that general category, useful to evaluate against ag-specific tools if your delivery problem is really a routing problem.

Farmonaut Web System Tutorial: Monitor Crops via Satellite & AI
Fleet and Transport Layer
Where delivery software schedules and confirms, transport/fleet software manages the vehicles and drivers underneath it — load assignment, cold-chain temperature monitoring for perishables, and compliance recordkeeping. Fleet and resource management tools that track driver routes and vehicle utilization directly reduce the idle-time and misassignment costs that show up as delivery delays.

JEEVN AI: Smart Farming with Satellite & AI Insights
Agri Supply Chain Platforms
Buyers searching “agri supply chain platforms” are usually evaluating traceability and multi-party coordination — connecting grower, processor, distributor, and retailer on a shared record. The two things a supply chain platform needs to do that a plain delivery tool doesn’t: maintain chain-of-custody across ownership transfers, and expose that record to a buyer or auditor without giving them your operational dashboard.
Blockchain-based product traceability is one approach to that chain-of-custody problem — a tamper-evident record travels with the batch instead of living in one party’s private system. Whether that’s necessary for your operation depends on whether your buyers (a co-op, an export contract, a certification body) actually require third-party-verifiable provenance, or just want a delivery confirmation.
We did not find published figures quantifying agri supply chain complexity — number of intermediaries, logistics cost as a percentage of farm-gate price, or similar metrics — for US operations specifically. If you need that number for your own supply chain, the most direct method is tracking your own landed cost from farm-gate to final buyer across at least one full season, since no industry-wide benchmark for this was available in the sources we checked.

BEE True: A Smart, Scalable Honey Traceability Solution
Precision Farming Tools and the Trimble Question
Trimble Ag Software is the most-searched named vendor in the precision-ag category, and its footprint is real: Trimble’s guidance systems and yield-monitoring integrations sit behind a large share of that 76% large-farm yield-monitoring adoption figure cited above, since Trimble hardware has been an OEM fixture on North American combines for years. Recent licensing developments from Trimble affect which mapping and guidance platforms a given piece of equipment can run — if you’re evaluating a Trimble-equipped operation, check the current terms directly with Trimble or your dealer rather than assuming last season’s licensing model still applies, since this is an area that changes with vendor agreements rather than on a fixed schedule.
What Precision Ag Software Adds
- Satellite and drone field mapping for soil health, canopy vigor, and moisture.
- Variable-rate input planning — reducing fertilizer and seed waste by adjusting rate within a field rather than applying a flat rate across it.
- Real-time yield monitoring during harvest, feeding directly into the marketing and storage decisions that determine what price you actually realize against that $4.24/bushel corn or $5.52/bushel wheat marketing-year average.
European context for adoption pacing: Denmark’s precision agriculture adoption rate stood at 40% as of 2023, according to EU digital policy tracking (European Commission Digital Strategy) — notably lower than the 61-68% North American farm-software adoption range, which suggests US and Canadian operations are ahead of at least one leading EU market on this specific technology, likely reflecting average farm size differences between the two regions.
Carbon footprint monitoring is increasingly bundled into precision-ag platforms as buyers and lenders ask for sustainability documentation alongside yield data.
Comparison Table: Accounting, Delivery, and ERP Software
| Category | Primary Job | Typical Buyer | Core Data Output | Where It Falls Short Alone |
|---|---|---|---|---|
| Farm accounting software | Ledger, crop-wise margin, tax prep, lender reporting | Any farm filing Schedule F or managing multi-crop budgets | Profit & loss by field/crop, depreciation schedules | No field-level yield or input-use verification without a precision-ag feed |
| Delivery/logistics software | Order capture, dispatch, route optimization | Operations moving inputs or produce across multiple sites | Delivery confirmations, transit-time data | No cost accounting unless integrated with a ledger |
| Precision ag / farm management (e.g., Trimble) | Field mapping, variable-rate application, yield monitoring | Row-crop operations with GPS-equipped equipment | Yield maps, input-rate prescriptions | No accounting or delivery-tracking function built in |
| Supply chain / traceability platforms | Chain-of-custody across multiple parties | Growers selling into certified, export, or branded-premium markets | Batch-level provenance record | Doesn’t replace a general ledger or route planner |
| Satellite monitoring + advisory (Farmonaut) | Crop health, weather-linked advisory, blockchain traceability, fleet tracking | Operations wanting field data without owning field hardware | NDVI-style crop health signals, AI advisory, traceability records | Not an accounting ledger or an input marketplace — pairs with one |
This table maps job-to-category, not vendor rankings — the right stack is usually one accounting platform plus one or two of the others, integrated rather than replaced.
Calculator: Is Accounting Software Worth It for Your Acreage?
Farm accounting software pricing scales with acreage and transaction volume more than with feature count. Use your own numbers below to see where a subscription cost lands relative to your farm-gate revenue — the calculator doesn’t assume any ROI figure, since none is published; it only converts your inputs into a cost-per-acre and a percentage-of-revenue so you can judge the tradeoff yourself.
Run your own numbers
Assumes corn as the sole reference crop for revenue comparison and a flat monthly subscription with no setup or per-transaction fees; excludes any accounting-software time savings, since no published study quantifies that figure (see the accounting section above). Substitute your own crop, yield, and price for a realistic estimate — the $4.24/bushel default is USDA NASS’s 2024/2025 marketing-year average for corn, not a forecast for your sale.
Where Farmonaut Fits
Farmonaut is not an accounting ledger, a delivery dispatcher, or an input marketplace — it’s a satellite monitoring and advisory layer that feeds data into whichever accounting or delivery system you already run. That distinction matters for search intent: if you searched “farmonaut” directly, here’s what the platform actually does and doesn’t do.
- Satellite-driven crop health monitoring — no field hardware required.
- JEEVN AI advisory — combines satellite and weather data into crop-specific recommendations.
- Blockchain traceability — tamper-evident batch records for crops, honey, and other tracked commodities.
- Fleet and resource management — driver routing and vehicle utilization tracking.
- Carbon footprint tracking for sustainability compliance reporting.




Farmonaut Agro Admin App: Revolutionizing Large-Scale Farm Management
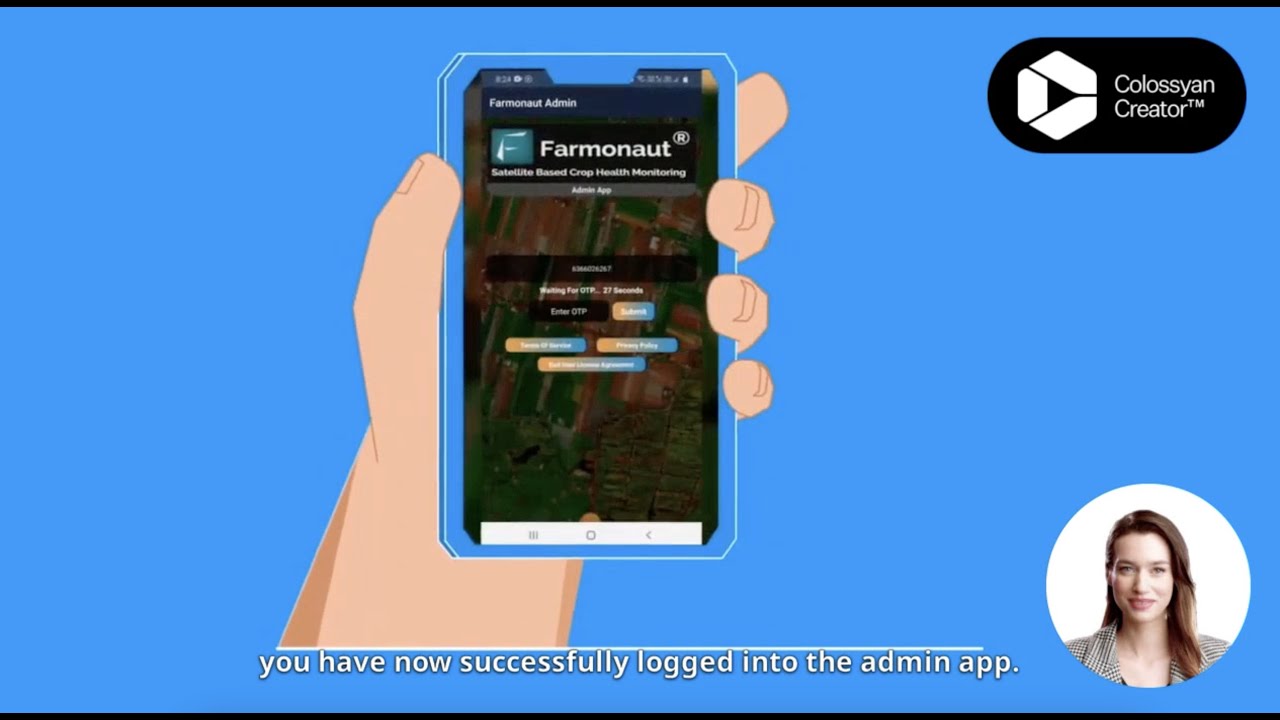
Farmonaut For Admins Tutorial Video
Developers building against farm data directly can use the Farmonaut API and the satellite and weather API developer documentation to pull field-level data into a custom accounting or delivery integration rather than relying on manual entry.
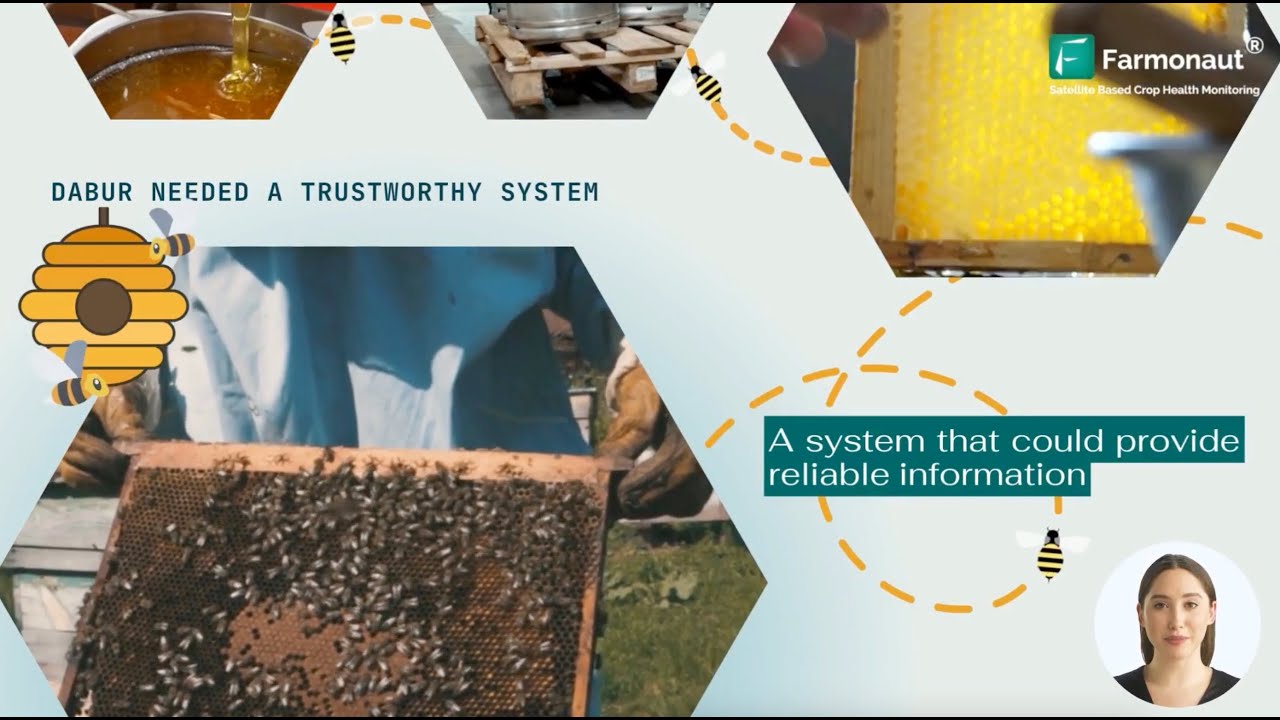
Farmonaut®’s Traceability solution for Honey is going live with Dabur
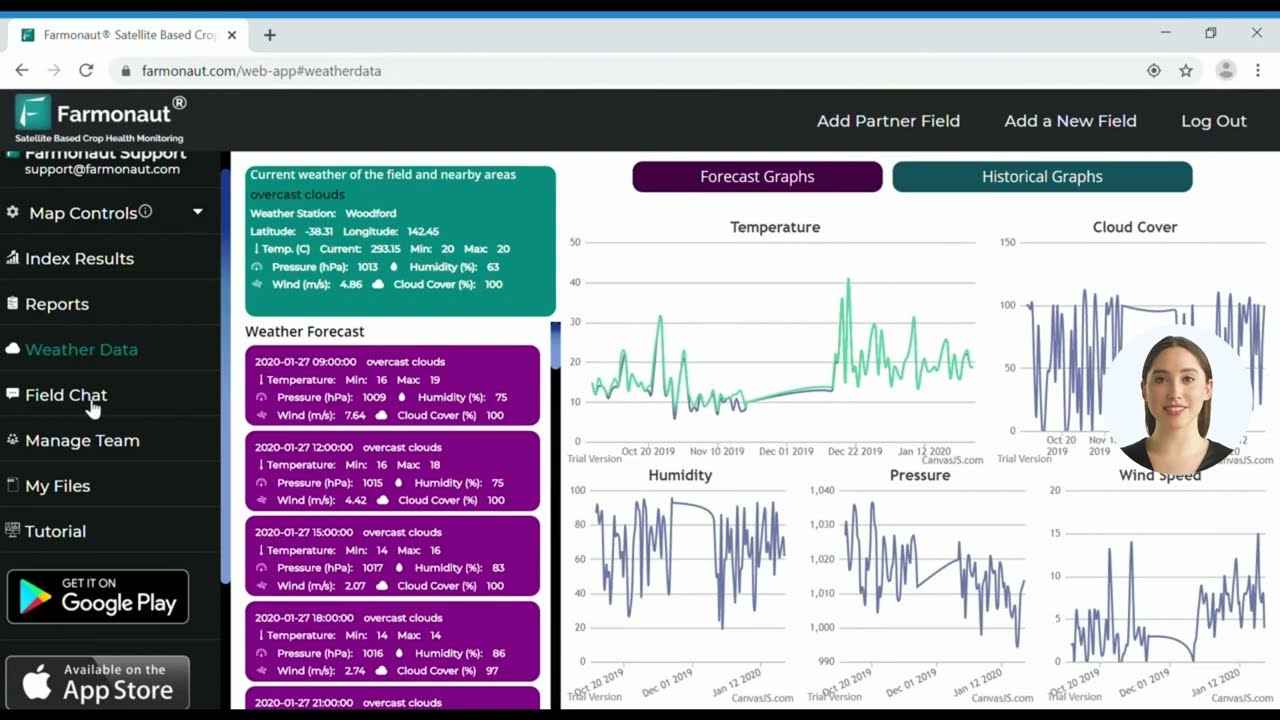
Farmonaut Web App | Satellite Based Crop Monitoring
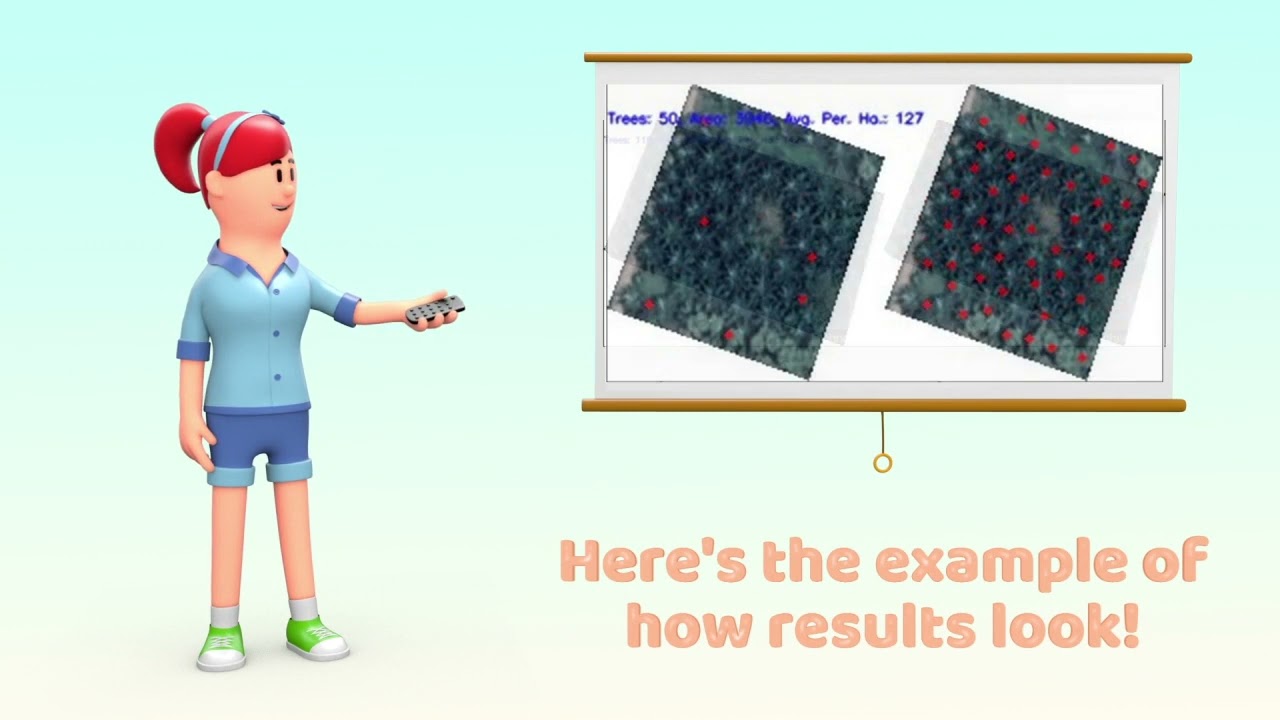
Farmonaut For Oil Palm Plantation
Buyer’s Checklist
The market context above — $3.4 billion in 2024 growing toward $5.8 billion by 2029, 61-68% North American adoption — tells you this category isn’t experimental anymore; the software works and operations like yours are running it. The checklist below is the durable part: it holds regardless of which specific price or adoption number is current when you read this.
- Match the tool to the category first. Decide whether your gap is accounting, delivery, precision-ag, or traceability before evaluating vendors — most disappointment comes from buying a delivery tool to solve an accounting problem.
- Check integration, not just features. A standalone accounting tool that can’t import yield data, and a delivery tool that can’t export cost data to your ledger, both create manual re-entry work that erases the time savings you bought the software for.
- Ask every vendor for their adoption and ROI sources. If they cite a savings percentage, ask which study it comes from — we could not find a published, citable ROI figure for farm accounting software adoption, so a vendor-supplied number deserves the same scrutiny.
- Verify current pricing and licensing directly with the vendor, especially for named-platform tools tied to equipment licensing terms that change on the vendor’s schedule rather than a fixed calendar.
- Re-run your own cost-per-acre math using the calculator above with your actual yield and price, not the defaults — commodity prices move every marketing year.
FAQ
What does “agriculture accounting software” actually track that regular accounting software doesn’t?
Crop-wise and field-wise margin analysis, farm-specific depreciation schedules for equipment and breeding livestock, and multi-season cost tracking that spans a single crop’s planting-to-sale cycle across accounting periods. See the chart of accounts guide for the specific account structure this requires.
How is agriculture transport software different from delivery software?
Delivery software manages order capture, scheduling, and status tracking; transport/fleet software manages the vehicles and drivers underneath it — load assignment, route optimization, and cold-chain monitoring. General delivery management platforms can serve either function depending on configuration.
Is Farmonaut an accounting platform, ERP, or marketplace?
No. Farmonaut doesn’t sell inputs, equipment, or act as a marketplace, and it isn’t a general ledger. It’s a satellite, AI, and blockchain data layer that feeds field-level data into whichever accounting or delivery system an operation already runs.
What’s a reasonable adoption rate to expect from other farms my size?
For farms above roughly 990 acres (400 hectares), 68% report using farm management software as of 2024-2025. For farms of any size reporting some usage, the figure is 63% over the same period. Below that scale, expect adoption closer to the lower end, per Mordor Intelligence and Market Research Future data.
Where do I check current commodity prices to update my own accounting projections?
USDA NASS publishes marketing-year average prices in its crop values reports; the corn and wheat figures cited in this article ($4.24 and $5.52 per bushel) are the 2024/2025 marketing-year averages published there, and the report is reissued each marketing year with the current figures.
How can I access Farmonaut’s API or developer documentation?
Through the Farmonaut API and the satellite and weather API developer documentation.
Conclusion
Adoption data settles the “should I bother” question — 61-68% of North American farms above 400 hectares already run some form of farm management software, and the market is growing at roughly 11% annually toward $5.8 billion by 2029. The harder question is which category of tool actually fixes your specific gap: an accounting platform for margin and tax clarity, a delivery/logistics tool for routing and dispatch, a precision-ag platform for yield and input optimization, or a traceability layer for certified and export markets. Most operations end up running two of the four, integrated. Use the checklist and calculator above with your own numbers, verify vendor claims against a named source before trusting them, and re-check USDA NASS pricing each marketing year rather than carrying last season’s figures forward.