

Geography · Definition guide
Intensive Subsistence Farming: Meaning and Examples
Intensive subsistence farming is small-plot, labor-heavy farming that feeds the household first. Examples from China and Vietnam, a comparison with US and EU farm size, and a calculator to test a plot.
Key takeaways
- Small plots, hand labor and repeated cropping define intensive subsistence farming; extensive systems use more land and fewer hours per hectare.
- Farms under 2 hectares are more than 80% of farms worldwide but cover about 12% of farmland in the census data FAO used (FAO, 2014).
- The Hani rice terraces in China cover about 70,000 ha and are listed by FAO as a heritage system (FAO GIAHS).
- The average US farm is 463 acres, about 187 ha (USDA NASS, 2022); the average farm in China was 0.6 ha in the 2010 census (FAO, 2014).
- One third of EU farms, 2.9 million, produce under €2,000 a year and make 1% of EU farm output (Eurostat, 2023).
In this article
- What intensive subsistence farming means
- Why households farm this way
- Intensive vs extensive subsistence farming
- Where intensive subsistence farming is practiced
- Examples of intensive subsistence farming
- Examples of extensive subsistence farming
- Intensive subsistence farming by region
- How high are the yields?
- How this compares with US and EU farm scale
- Plot-size calculator: can a small plot feed a household?
- Strengths and limits at a glance
- Intensive subsistence vs commercial intensive farming
- Key practices of intensive systems
- Reading small farms on a map
Intensive subsistence farming is small-plot, hand-worked farming where a household grows most of its own food and gets as much as it can from every square meter, often with two or three crops a year. One textbook, Howard Community College’s world geography text, calls it the most abundant type of farming worldwide and says it is commonly practiced in humid tropical regions with dense populations and little spare land (Howard Community College).
This guide gives the meaning in plain words, the difference from extensive systems, real examples from China, Vietnam and Southeast Asia, and a comparison with US and EU farm size using census numbers. It also has a calculator that shows whether a small plot can cover a household’s grain needs.
What intensive subsistence farming means
Three traits define it. The plots are small, usually under a few hectares. Most of the work is done by family members, by hand or with draft animals. And the land is cropped hard, with little or no fallow, so the same plot may give two or three harvests in a year.
The food is meant first for the household. Some surplus may be sold or traded locally, but the goal is to eat, not to supply an export chain. That is why the term is not a counted category in farm statistics from the US or the EU, although Eurostat does call its smallest farms the semi-subsistence end of the scale. Those count farms by size and by economic output, not by what the family intends to do with the crop.
A simple test works for any farm you read about. If a household has little land and makes up for it with labor and repeated cropping, it is intensive. If it has little labor or money and makes up for it with more land, it is extensive.
Why households farm this way
The reason is arithmetic. When many people live on little land, each extra hour of work on a plot still adds some food, so families keep adding hours. FAO says rapid population growth in rural areas has led to more landholders and a general fall in average farm size in many low- and middle-income countries (FAO, 2014). The same report explains that family farming is common because using family members instead of hired workers usually makes economic sense, since hired labor needs supervision.
The trade-off is on the labor side. Our World in Data notes that smaller farms tend to reach higher yields per hectare, but that this is very labor-intensive work, with lower output per hour of labor (Our World in Data). A household can raise output per hectare for years and still stay poor, because each hour of work earns little.
That is also why the pattern changes when other work becomes available. If family members take jobs elsewhere, the plot may be rented out, left in one crop a year or merged with a neighbor’s. Farm size follows these choices over a generation or two.
Intensive vs extensive subsistence farming
Both types feed the household first. They solve the same problem in opposite ways. One uses labor to make up for a shortage of land. The other uses land to make up for a shortage of labor and inputs.
| Feature | Intensive | Extensive |
|---|---|---|
| Main constraint | Land is scarce | Labor or money is scarce |
| Plot size | Small, often under 2 ha | Large, several hectares or more |
| Labor per hectare | Very high, mostly by hand | Low to moderate |
| Cropping | Several crops a year, little fallow | Short cropping, long fallow |
| Fertility | Manure, compost, green manure | Fallow rebuilds the soil |
| Typical systems | Wet-rice paddies, terraces, garden plots | Shifting cultivation, herding |
Neither is “more primitive”. Each fits the resource that is short in that place.
Where intensive subsistence farming is practiced
It sits where many people share little arable land and the climate allows long growing seasons. Howard Community College’s text names East and Southeast Asia as the areas where population density is high and land is limited (Howard Community College). Three settings stand out:
- River deltas and valleys with reliable water, where paddy rice can be grown two or three times a year.
- Terraced hillsides, where steep slopes are cut into stepped, irrigated plots.
- Humid lowlands, where warmth lets farmers plant again soon after each harvest.
Small farms are very common worldwide. FAO’s State of Food and Agriculture 2014 reports that farms under 2 hectares make up more than 80% of all farms but cover only about 12% of farmland in the census data FAO used, which mostly reflects richer countries. In low-income countries they hold about 40% of the land (FAO, 2014). The same report notes that the average farm in China shrank from 0.7 ha in 2000 to 0.6 ha in 2010 in the agricultural censuses.
Not every small farm is a subsistence farm, and not every subsistence farm is intensive. Farm size is only a clue.
Examples of intensive subsistence farming
Hani rice terraces, China
The Hani Rice Terraces in Yunnan cover about 70,000 hectares in the Honghe Hani and Yi Autonomous Prefecture, on mountainsides below village forests. FAO lists them as a Globally Important Agricultural Heritage System since 2010. Rice, beans and vegetables are the main crops, and fish and ducks are raised or harvested from paddy fields, streams and ponds, and FAO says the crops feed the local communities. Water runs from the forest through a channel network, and manure and forest humus are washed onto the terraces (FAO GIAHS).
Rice deltas of Vietnam
Rice is grown mainly in the Red River and Mekong River deltas of Vietnam. In the Red River Delta, FAO’s paper (using 1999 data) says farmers grow an upland crop such as potato, vegetables or beans between two rice crops, with spring rice harvested in June and the second crop at the start of November (FAO, Crop diversification in Viet Nam). FAO’s paper, which uses 1990s data, describes Viet Nam as the second largest rice exporter and notes upland cash crops, so delta rice is best described as intensive smallholder farming with part of the output sold.
Intercropped garden plots
FAO’s Viet Nam paper describes legumes such as peanut and soybean grown between rows of corn, and intercropping on sloping land to cut soil loss.
A word of caution: no single list covers all farms, and a given household may mix intensive plots with some extensive grazing or fallow land.
One year on a paddy plot
The Red River Delta pattern gives a clear picture of the calendar. Spring rice is harvested in June and the second rice crop (called the “mua” crop) at the beginning of November. An upland crop such as potato, vegetables or beans is then sown after the November harvest; the paper gives November to May or June as the upland window (FAO, Crop diversification in Viet Nam). FAO says this rice-rice-upland pattern is practiced on hundreds of thousands of hectares in the north, including the Red River Delta, and that upland crops can bring farmers more cash. The same FAO paper says upland crops grown between rice crops pay off only if farmers can afford the inputs and get a net return.
More than rice
The Hani terraces show that these systems are not only about one grain. FAO reports that the terraces grow rice, beans and vegetables, including wild vegetables from paddy fields and upland fields, and that local farmers keep 48 local rice varieties. Timber, firewood, thatch and herbal medicines come from the forests and grasslands around the villages (FAO GIAHS). Water is shared by a ditch leader who clears the channels and allocates water, which shows how much of the system rests on community rules and not only on the plot itself.
FAO also lists the risks. The region is prone to soil and water loss, landslides and terrace collapse because of steep slopes and heavy rain, and the terraces suffer in drought years. FAO adds that fewer young people take up the traditional knowledge, as markets and cities pull them away.
Examples of extensive subsistence farming
Extensive systems are the other end of the scale: more land, fewer hours per hectare. FAO notes that the definition of shifting cultivation varies greatly between authors (FAO Unasylva 147), so check which one a source uses.
- Shifting cultivation. FAO defines it as relatively short periods of continuous cultivation followed by relatively long periods of fallow. FAO notes it is no longer as common in Africa as it was, and is often combined with other forms of farming (FAO Unasylva).
- Slash-and-burn cropping. Howard Community College’s text describes clearing and burning land, cropping it for 2 to 3 years, and returning after 5 to 20 years of regrowth.
- Pastoral nomadism. Herders move animals over large territories for milk, clothing and trade. The same text places most of them in dry regions such as the Middle East and North Africa.
Intensive subsistence farming by region
| System | Type | Where it is described |
|---|---|---|
| Wet-rice paddies, two or three crops | Intensive smallholder, part sold | Red River and Mekong deltas, Vietnam (FAO) |
| Terraced rice with fish and ducks | Intensive | Hani terraces, Yunnan, China (FAO) |
| Rice with an upland crop in between | Intensive | Red River Delta, Vietnam (FAO) |
| Shifting cultivation | Extensive | Parts of Africa (FAO) |
| Pastoral nomadism | Extensive | Dry regions, including the Middle East and North Africa |
How high are the yields?
Intensive systems aim for high output per hectare, and FAO says smaller farms in individual countries tend to have higher yields per hectare than larger farms. The result is not the same everywhere. National rice yields from FAO data show a wide spread, and they mix commercial and household farms, so they are not a measure of subsistence farming alone.
Chart
National rice yields, 2023
tonnes per hectare, selected countries, all farm types
Output per hectare is high but output per hour of work is low. The labor behind a terrace or a triple-cropped paddy is large, which is why a drop in the number of working-age people in a household cuts how intensively the land can be used.
How this compares with US and EU farm scale
Neither the US nor the EU counts “subsistence farms” by method. The closest figures are farm size and economic size.
Chart
Average farm size: US, EU and China
hectares per farm; US 2022 census, EU 2023 survey, China 2010 census
In the United States, the 2022 Census of Agriculture counted about 1.9 million farms on 880 million acres, an average of 463 acres, or about 187 hectares (USDA NASS, 2022). The EU has much smaller farms on average. Eurostat counted 8.8 million holdings in 2023, with 62.8% under 5 hectares, farming 156 million hectares in total, which is about 18 hectares per farm on average (Eurostat, 2023).
Eurostat also sorts farms by standard output. One third of EU farms, 2.9 million, produced under €2,000 a year and made only 1% of EU farm output. Eurostat calls these very small farms the semi-subsistence end of the scale. Farms under €8,000 together were 62.2% of holdings and 3.4% of output, while 330,000 farms with €250,000 or more made 60.1%.
The share of the world’s food from small farms is a debated number. Our World in Data, drawing on the Ricciardi et al. dataset, reports that farms under 2 hectares produce 29% of the world’s crops in calories on about 24% of agricultural land (Our World in Data). OWID says this is less than half of earlier claims.
No agency publishes yields split into subsistence and commercial farms for the US or EU. For that, start from NASS Quick Stats size classes or Eurostat’s farm accountancy data.
Chart
EU farms by economic size, 2023
percent of all EU farms and percent of EU standard output
Plot-size calculator: can a small plot feed a household?
The calculator below turns a plot size, number of crops and yield into the amount of grain a household harvests, and compares it with what the household needs.
Try the numbers for your own farm below.
Calculator
Can a small plot cover a household’s grain?
Enter your own plot, yield and household numbers.
- Paddy harvested a year: 1.50 t
- Edible rice a year: 975 kg
- Edible rice per person: 162 kg
- Plot area per person: 417 sq m
Example values only, not benchmarks or forecasts; every number is your input. Yield is paddy (unmilled) rice per crop, the milling rate turns it into edible rice, and the yearly need per person is an example. Fallow, crop loss, seed, feed and sales are not counted.
Strengths and limits at a glance
| Strength | Limit |
|---|---|
| High output per hectare on small plots | Low output per hour of labor |
| Several crops a year spread risk | Timing depends on rain and water supply |
| Manure and compost cut input costs | Soil can wear down with no fallow |
| Mixed crops give a varied diet | Little surplus to sell or invest |
| Shared water rules keep terraces working | Plots shrink as land is divided |
Each item is a general pattern from the sources cited on this page, not a measured average for any one region.
Intensive subsistence vs commercial intensive farming
The word “intensive” can mislead. A large US corn farm or a European dairy is also intensive in the sense of high output per hectare, but it gets there with machines, bought seed, fertilizer and credit, and it sells its crop. Howard Community College’s text describes the commercial grain system of the US, Canada and Western Europe as highly productive and often combined with penned livestock (Howard Community College).
Intensive subsistence farming gets its intensity from labor and cropping frequency instead. The goal is also different. A commercial farm tries to maximize profit per hectare. A subsistence household tries first to secure its own food supply and only then to sell what is left.
Real farms sit on a spectrum. Many rice households sell part of the crop, buy some food and take wage work. When you read a case study, ask three questions: who supplies the labor, what share of the harvest is eaten at home, and how many crops a year the land carries.
Key practices of intensive systems
- Multiple cropping. Two or more harvests a year from the same plot, made possible by water and a long growing season.
- Family labor. Land prep, transplanting, weeding and harvest are done by hand or with animals. Small plots rarely justify a machine.
- Manure and compost. Organic matter replaces much purchased fertilizer. If you do buy fertilizer or crop protection products, follow the product label and local rules.
- Small-scale irrigation. Channels, check dams and small pumps reduce dependence on rain.
- Mixed crops and animals. Interplanting and keeping a few animals spreads risk and recycles nutrients.
▶ Mixing crops and animals on one farm: manure, crop leftovers as feed and spread risk. · 2:55
Reading small farms on a map
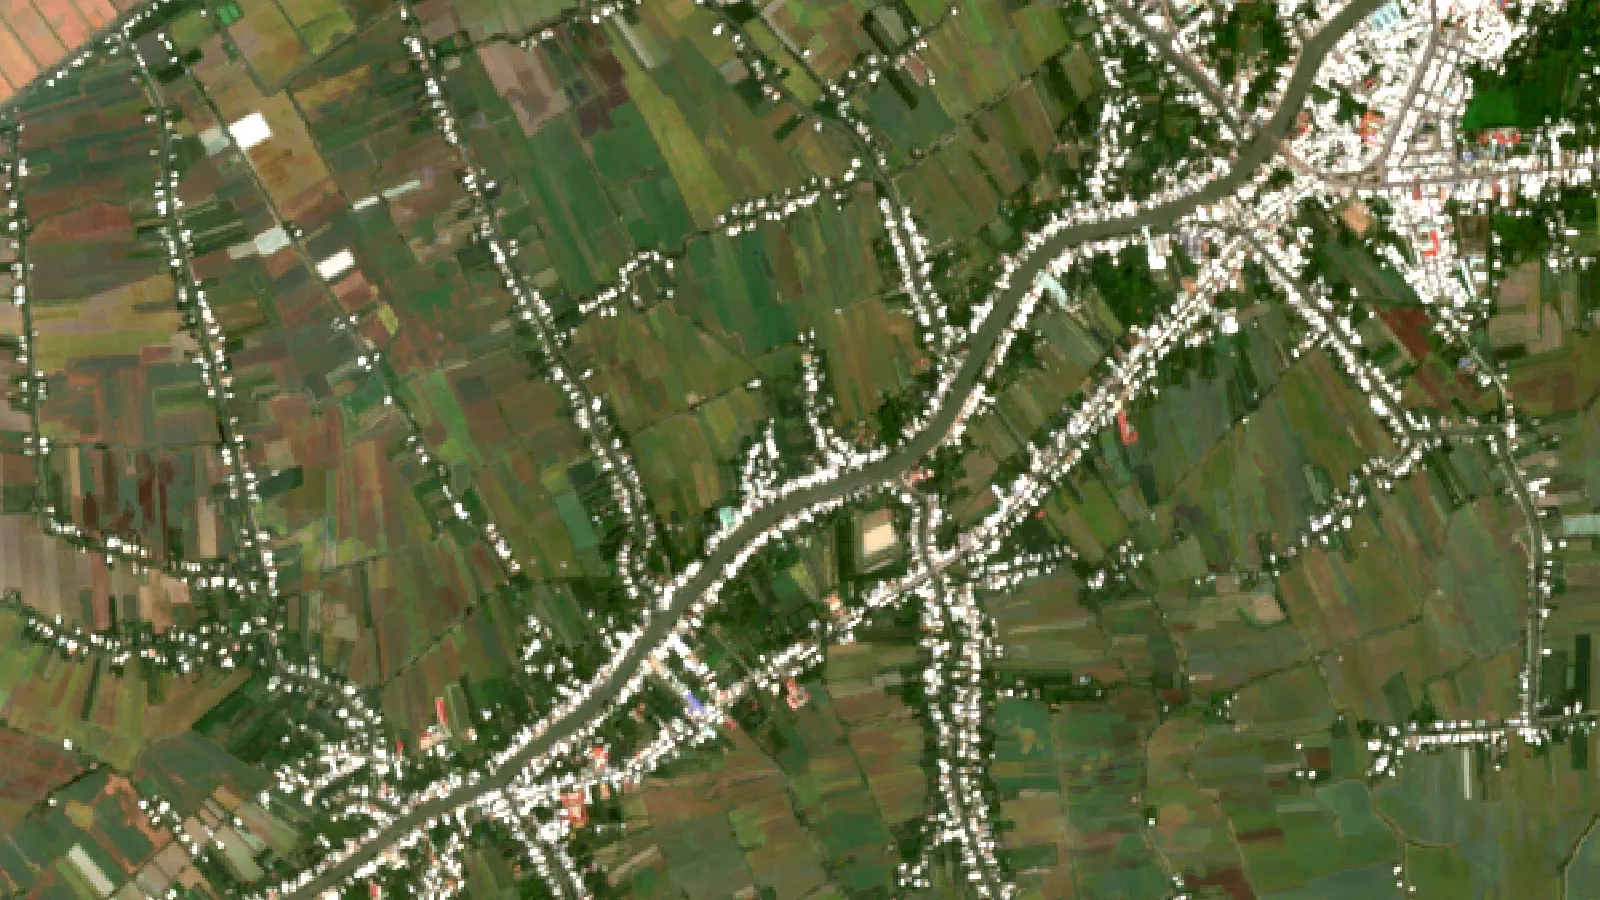
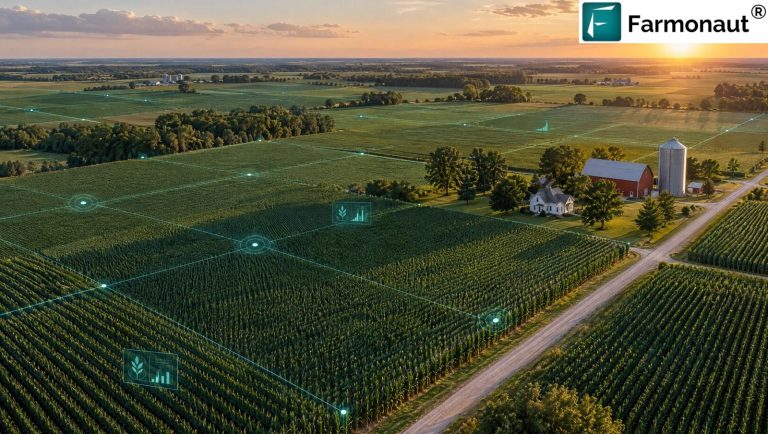
If you want to find intensive subsistence areas yourself, look for dense patterns of small, regular plots. Terraces appear as curved bands that follow the contours of a slope. Paddy deltas appear as a patchwork of small rectangles with canals between them, and the color of the patchwork changes through the year as fields are flooded, planted and harvested. A time series of images makes multiple cropping visible, because a plot that is green, bare and green again within one year was probably cropped twice.
Cloud cover is the usual problem in humid regions. In the wet season, optical images may be blocked for weeks, so the best views often come from the drier months, and radar satellites can fill gaps because they see through clouds.
Field boundaries drawn on a map also help with the calculator below: measure the plot, then enter the area in hectares. One hectare is about 2.47 acres.

▶ Why cloudy days blind camera satellites and how radar imagery fills the gap. · 2:37
Challenges for intensive systems
- Plot splitting. When land is divided between heirs, plots get smaller each generation.
- Soil and water strain. Continuous cropping without rest can wear down nutrients.
- Climate swings. Several crops a year depend on the timing of rain and water supply.
- Labor loss. If young people leave, fewer hands are left to farm the plot.
- Limited credit. Low cash income makes it harder to borrow or insure crops.
▶ Simple ways to protect soil and water, such as cover crops. · 4:34
Common mix-ups to avoid
Four mistakes appear often in homework answers and web summaries.
- Confusing intensive with industrial. In this topic, “intensive” describes how much labor goes into each hectare, not how many machines or chemicals are used.
- Calling all Asian farming subsistence farming. Large parts of Asian farming are commercial. FAO’s own examples of rice terraces and deltas describe systems where households grow food for themselves and sell some, so the line is blurred.
- Treating shifting cultivation as intensive. It is the opposite: short cropping and long fallow. FAO notes that where land pressure grows, fallows shorten, and the system moves toward more continuous cropping.
- Quoting one yield for all subsistence farms. Yields depend on crop, water, soil and season. The rice chart above shows national averages that mix many farm types, so do not read a country bar as a subsistence yield.
If you are writing for a class, a safe short definition is: small plots, high labor per hectare, little mechanization, several crops a year where the climate allows, and food grown mainly for the household. Add one sourced example, such as the Hani terraces, and one contrast, such as shifting cultivation.
What the numbers cannot tell you
Census counts by size are the best public clue, yet they have limits. A farm of 0.6 hectares can be a household that eats its crop, or it can be a vegetable grower selling every week to a city market. Eurostat’s economic-size bands give another clue, because a holding with under €2,000 of standard output a year is far more likely to farm mainly for itself. Even then, Eurostat only calls these farms the semi-subsistence end of the scale; it does not say how much of the crop each household eats.
That is why the best evidence is local: household surveys, field visits and, for mapping, repeated satellite images over several seasons.
Satellite monitoring for small plots
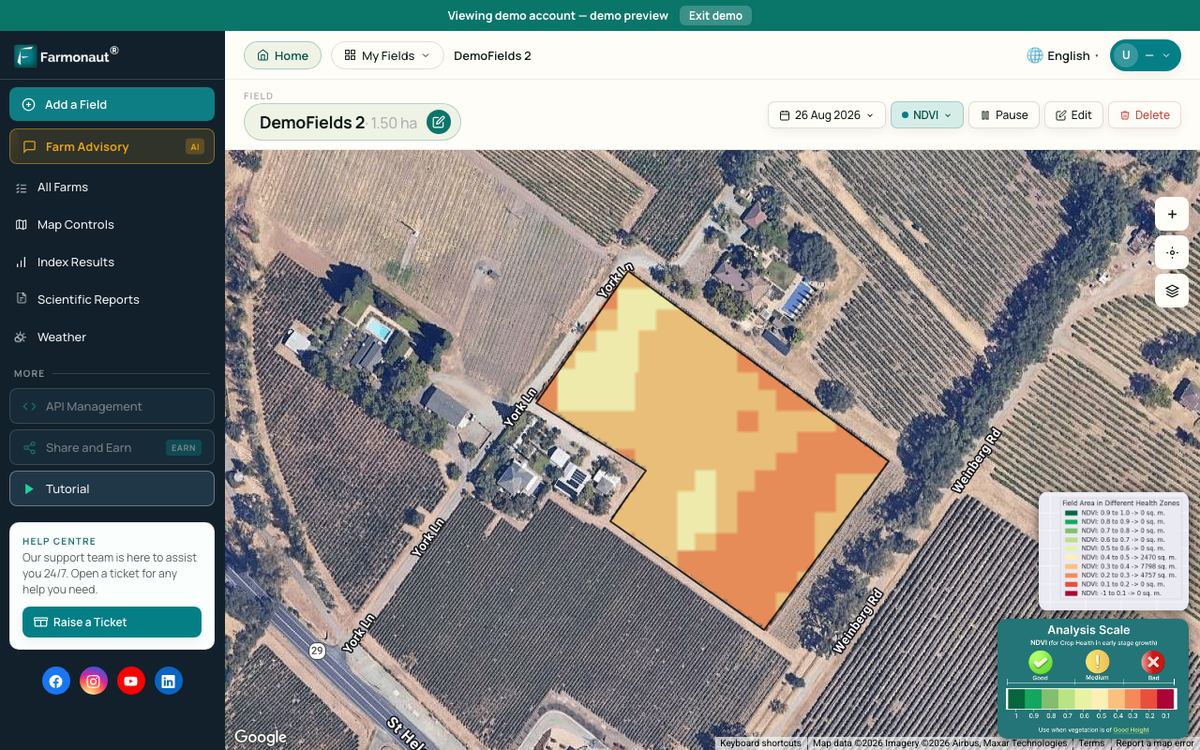
Satellite images are not only for large farms. Very narrow terraces may be too small to show clearly in medium-resolution satellite images, but larger paddies and garden plots can show a vegetation signal. With the Farmonaut Satellite + AI Farm Monitoring System, a user can draw a field boundary and see vegetation maps through the season on the web app or the mobile app. Satellites show changes in plant cover. They do not show the cause, so a visit to the field is still needed.
Related pages on our site: subsistence farming, multiple cropping, US farm map, crop loan and insurance page, traceability page, carbon footprinting page, fleet management page and the weather API docs.
A structural pattern, not a curiosity
Intensive and extensive subsistence farming are two answers to one question: how does a household balance land against labor? Intensive systems pay for scarce land with hours of work and repeated crops. Extensive systems pay for scarce labor with space. Eurostat’s data on the EU show a lopsided split: many small farms, little of the output.
For a reader used to US figures, the number to remember is the scale gap. An average US farm is about 187 hectares. The average farm in China was 0.6 hectares in the 2010 census, according to FAO.
FAQ
What is intensive subsistence farming?
It is small-plot farming where a household uses a lot of labor, often by hand, and several crops a year to feed itself. Some surplus may be sold locally.
What is the difference between intensive and extensive subsistence farming?
Intensive systems use heavy labor on small plots with little fallow. Extensive systems use large areas at low labor per hectare, with long fallow or moving herds.
Where is intensive subsistence farming practiced?
One textbook places it in densely populated, humid parts of Asia, with examples such as the Hani terraces in China and the rice deltas of Vietnam. It is not a category in US or EU farm statistics.
What are examples of intensive subsistence farming?
Wet-rice paddies with two or three crops a year, terraced hillside rice with fish and ducks, and intercropped garden plots.
What are examples of extensive subsistence farming?
Shifting cultivation with long fallows, slash-and-burn cropping, and pastoral nomadism.
How big are the plots?
Often under 2 hectares. FAO reports that farms under 2 hectares are more than 80% of farms worldwide. The average farm in China was 0.6 ha in the 2010 census.
Farmonaut crop monitoring
See your own fields from space
Draw your fields once and Farmonaut shows satellite vegetation maps for them through the season, on web, Android or iOS.



Keep reading
Sources
- FAO, The State of Food and Agriculture 2014: Innovation in family farming: fao.org
- FAO GIAHS, Hani Rice Terraces, China: fao.org
- Eurostat, Farms and farmland in the European Union – statistics (2023 data): ec.europa.eu
- USDA NASS, 2022 Census of Agriculture, Volume 1 Chapter 1 US: nass.usda.gov
- Our World in Data, How much of the world’s food do smallholder farmers produce?: ourworldindata.org
- Our World in Data, Rice yields (FAO data, 2023): ourworldindata.org
- FAO, Crop diversification in Viet Nam (Nguyen Van Luat): fao.org
- FAO Unasylva 150, Changes in shifting cultivation in Africa: fao.org
- Howard Community College, World Regional Geography, agriculture chapter: pressbooks.howardcc.edu
- FAO Unasylva 147, Defining and measuring shifting cultivation: fao.org
Discussion
Questions, corrections or field experience? Share them below. First-time comments are reviewed before they appear, and your email is never published.
No comments yet. Be the first to add a question or your experience.

 AgroRisk
 Oath Inc
 Reddane Farming
 Esri North East Africa
 Farmer Amigo
 Cresol
 Atur Kuliner
 MDCV UK
 Zerella Group
 Etech Consulting Madagascar
 Vestlandsforsking
 Agritein
 Delicio
 WB Dev
 Sama Premium
 Prochecker
 Tres Valles
 LACOS Geoinformation
 Magrifly
 LatConnect 60
 Blickwinkel
 Agricultural Credit Policy Council

 Exploration consultancy · South Africa · Gold
 Licence holder · Niger · Gold
 Licence holder · Nigeria · Gold + lithium










