

Reviewed August 2026 against USDA’s Economic Research Service and USDA NASS.
Try it: Enter your numbers above to see an estimated payback period. →
The fastest way to track new agricultural technologies isn’t a single newsletter or app—it’s a short list of sources that each update on a different clock: USDA’s Technology Use Survey for adoption rates, NASS Quick Stats for real-time crop data, extension services for what works in your county, and a handful of online courses for the mechanics behind the tools. Below is what each source actually publishes, how often, and how the numbers compare.
Start with the scale of adoption already underway. USDA’s Economic Research Service found that 68% of large crop farms were using precision agriculture technologies as of the 2023 Technology Use Survey, versus far lower shares on midsize and small operations—adoption tracks farm size closely, not just calendar year.
1. What the Adoption Data Actually Shows
Before chasing new agricultural technologies through blogs and events, it helps to know what’s already been measured. USDA’s 2023 Technology Use Survey, published by the Economic Research Service, is the most detailed federal dataset on which technologies US farms actually run, broken out by farm size:
- Guidance autosteering on tractors and harvesters: 70% of large-scale crop farms, 52% of midsize farms.
- Variable-rate technology (VRT) for seed, fertilizer, or chemical application: 45% of large-scale farms, 32% of midsize farms.
- Drone adoption among large-scale crop-producing farms: 12%.
- Robotic milking systems on large-scale dairy farms: 19%.
- Automated guidance systems cover more than 50% of acreage planted to corn, cotton, rice, sorghum, soybeans, and winter wheat nationally.
The pattern across every category is the same: large farms adopt first and adopt more, and the gap between large and midsize operations has been the central finding of the last two survey cycles, per Capital Press’s coverage of the USDA data.
The productivity payoff behind that adoption curve is documented separately. USDA’s Economic Research Service puts average US farm sector productivity growth at 1.46% per year from 1948 to 2021, compounding to roughly 3x total output growth over that period without a proportional rise in inputs—the long-run case for why new technology adoption keeps paying off even as any single tool’s novelty fades. A 2025 peer-reviewed meta-analysis in Frontiers in Plant Science narrows the modern-tech figure further: precision agriculture adoption is associated with a 20–30% yield improvement and a 40–60% reduction in input waste (fertilizer, water, chemical overuse) across the studies reviewed.
This survey runs on a slow clock. The 2023 cycle is USDA’s most recent full release; the next comprehensive Technology Use Survey dataset is expected in 2025 and will publish through USDA ERS’s Precision Agriculture in the Digital Era report. Between full cycles, USDA NASS Quick Stats updates crop-level and county-level data continuously, and is the fastest-moving free source available to check whether a number here has shifted.
2. Agricultural Extension Services
Extension services—delivered through land-grant universities and USDA’s National Institute of Food and Agriculture—remain the most locally relevant channel for new agricultural technologies, because a county extension agent can tell you whether a tool that works in one soil type or climate zone applies to yours. This is the layer that translates USDA-scale adoption statistics into a specific recommendation for a specific field.
Why Extension Still Matters
- Context-specific recommendations: local agents factor in regional soils, water rights, and pest pressure that a national dataset can’t.
- Field demonstrations: new equipment, seed varieties, and irrigation systems get shown on working land before a purchase decision.
- Continuous contact: regular engagement surfaces state cost-share programs and compliance deadlines as they’re announced, not months later.
Many university extension programs have added SMS alerts, video modules, and searchable archives so a producer doesn’t have to wait for the next in-person field day to get an answer.

3. Agricultural Fairs and Conferences
Farm and equipment shows remain the place to see new machinery, biotech traits, and irrigation systems running side by side, which is something no article or AI summary can substitute for. Most major US and European events now run hybrid formats, pairing an in-person floor with a livestreamed track.
What You Get from Attending
- Live demonstrations of precision farming equipment, autosteer systems, and variable-rate applicators in operation.
- Direct access to vendors and engineers who can answer questions a spec sheet doesn’t cover.
- Peer networking with other producers who’ve already run a pilot on the same equipment.
- Remote attendance options for the sessions and keynotes, for producers who can’t travel during planting or harvest windows.

4. Digital Platforms and Mobile Applications
Mobile platforms are the daily-use layer between the annual USDA survey and the weekly extension bulletin—weather, pest pressure, crop health imagery, and market data delivered to a phone in the field. This is also the layer where satellite monitoring platforms operate.
What Modern Agricultural Apps Do
- AI-based recommendations drawn from satellite imagery and field-level data, rather than generic regional averages.
- Peer forums where producers troubleshoot the same equipment or crop issue in real time.
- Push alerts for weather risk, pest outbreaks, or policy deadlines.
- Multilingual and multimedia formats, including video walkthroughs for producers who prefer not to read a manual.

Spotlight: Satellite-Based Monitoring and AI Advisory (Farmonaut)
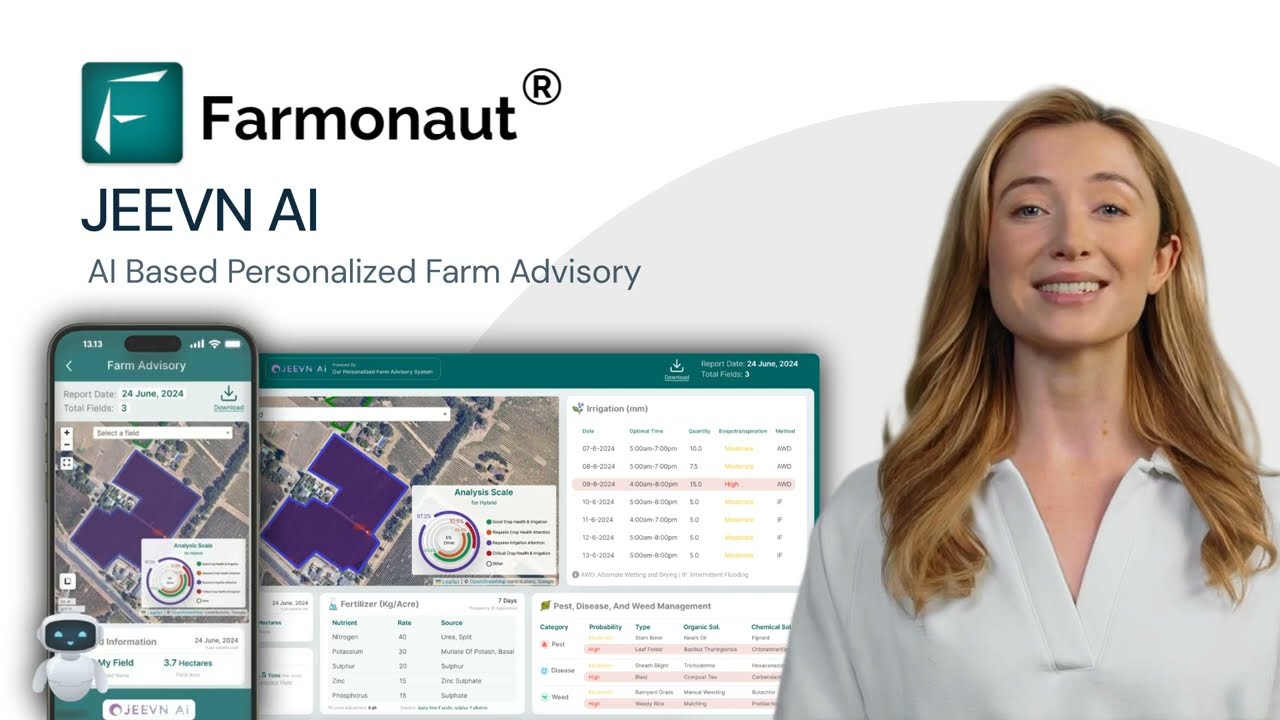
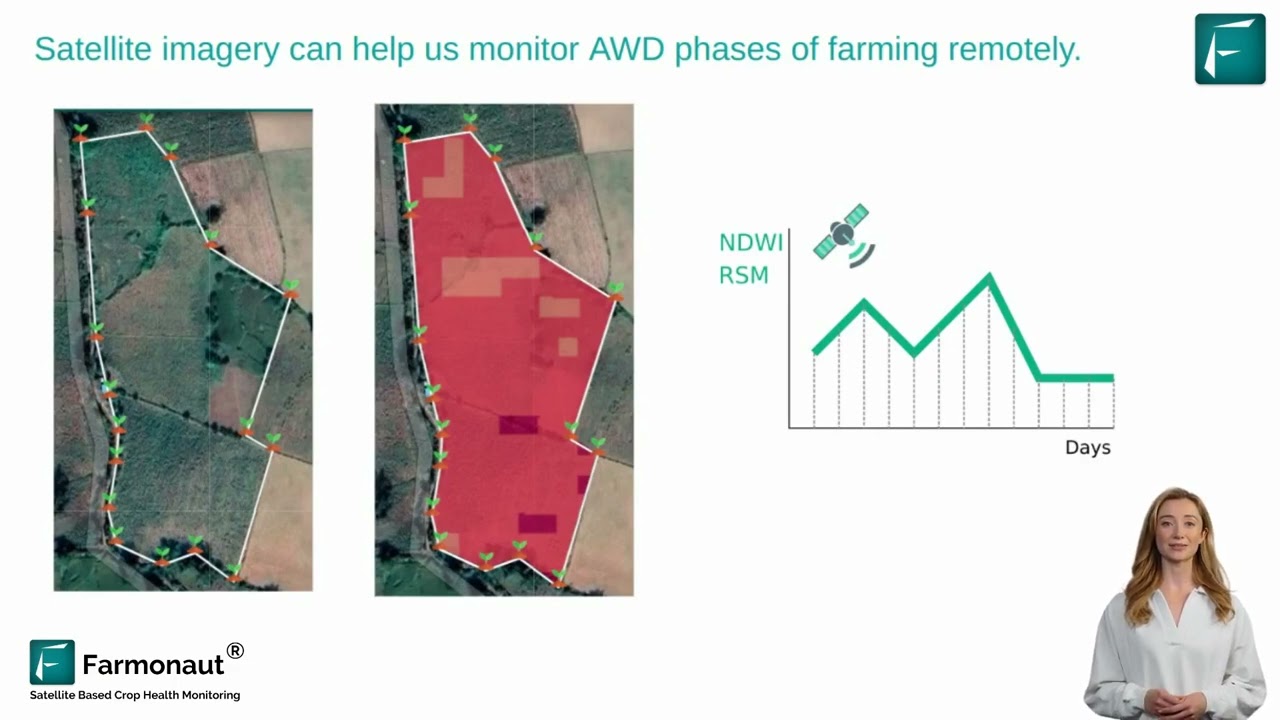
Farmonaut delivers real-time satellite crop monitoring paired with AI-driven recommendations, accessible on Android, iOS, and web. Using multispectral imagery, it tracks vegetation health (NDVI), soil conditions, and irrigation efficiency, while its Jeevn AI Advisory layer turns that imagery into a specific irrigation or input recommendation rather than a raw index value.



Try the platform for satellite-based crop monitoring and AI-driven agricultural insights.

Key Digital Tools by Function
- Crop and resource management—track growth, irrigation, pest pressure, and carbon footprint (see Carbon Footprinting).
- Weather and pest alert apps—real-time risk notifications.
- Market price platforms—commodity price tracking at the point of sale decision.
- Equipment monitoring apps—predictive maintenance scheduling (see Fleet Management).

5. Specialized Agricultural Publications
Peer-reviewed and trade publications remain the source for depth USDA summary statistics don’t provide—methodology, regional trial results, and long-form equipment reviews. The 2025 Frontiers in Plant Science meta-analysis cited above is a working example: it aggregates results across dozens of individual field studies to produce the 20–30% yield and 40–60% input-reduction ranges, a level of synthesis a single farm report can’t match.
Why These Are Worth Subscribing To
- Depth: full study methodology behind headline adoption or yield figures.
- Credibility: peer review filters out vendor-driven claims.
- Specificity: regional trial data (soil type, climate zone, crop) that a national average can’t give you.
Look for coverage of climate-smart agriculture practices alongside precision ag literature—the two increasingly overlap in the research being published.
6. Research Institutions and Agritech Startups
Land-grant universities and agritech startups run the field trials that eventually become the adoption statistics USDA reports years later. Direct engagement gets you a preview.
What Direct Collaboration Gets You
- Hands-on trial participation in new bio-fertilizers, drone-based crop monitoring (see the Farmonaut Web System Tutorial), or AI-based management systems (see Large-Scale Farm Management).
- Early visibility into compliance rules and sustainability certification requirements before they become mandatory.
- Direct contact with the researchers and engineers building the next generation of tools.
Genetically modified crop research is one area where the research-to-field pipeline has a clearly measured payoff: a meta-analysis covered in a peer-reviewed study on PMC found a 22% average yield increase from GM crop adoption globally, aggregated across the trials reviewed.
7. Government and Industry Policy Updates
USDA and state agriculture departments run programs that subsidize the equipment adoption tracked in the Technology Use Survey—cost-share for precision equipment, conservation compliance incentives, and crop insurance adjustments tied to technology use. Tracking policy separately from technology news matters because a subsidy program can make a tool financially viable years before it’s cheap enough to adopt without one.
How to Monitor Policy Changes
- USDA and state agency portals post program deadlines and eligibility rules directly.
- Industry association bulletins summarize regulatory changes in plain language.
- NASS Quick Stats and newsroom updates flag methodology or data-collection changes—for example, USDA NASS’s rollout of a 10-meter resolution Cropland Data Layer, announced through its newsroom.
Understanding available incentives changes the payback math on new equipment purchases (see Crop Loan and Insurance Satellite-Based Verification for how satellite data now factors into compliance verification).
8. Online Courses for Agriculture
Online courses and agricultural online courses are the fastest way to get past the vocabulary of a new technology—variable-rate application, NDVI, autosteer calibration—without waiting for a field day. University extension services and platforms built for professional continuing education carry the most consistently updated material.
What Makes These Worth the Time
- Self-paced structure that fits around planting and harvest, not an academic semester.
- Direct instructor access in live webinar formats, where you can ask a question specific to your operation.
- Certification in some programs, recognized by employers or used to meet continuing-education requirements for licensed applicators.
USDA NASS itself publishes the underlying Data and Statistics portal, including Quick Stats and the Cropland Data Layer, which several university courses use directly as teaching datasets—so the same source that verifies the figures in this article doubles as course material once you’re ready to work with the raw numbers yourself.

For continued coverage of climate-smart agriculture and resource management systems, explore satellite-based insights for cropland, plantation, and forest monitoring here.
Comparison Table of Information Sources for New Agricultural Technologies
| Source Type | Update Frequency | Cost | Best For | Example |
|---|---|---|---|---|
| USDA Technology Use Survey / NASS Quick Stats | Full survey ~every few years; Quick Stats continuous | Free | Verified national/state adoption rates | USDA ERS, quickstats.nass.usda.gov |
| Digital Platforms & Mobile Apps | Real-time / daily | Free–subscription | Field-level monitoring and alerts | Farmonaut, weather and market apps |
| Extension Services | Monthly or seasonal | Free (public funded) | Local, context-specific advice | Land-grant university extension |
| Agricultural Fairs & Conferences | Annual / semi-annual | Ticketed (often free livestream) | Hands-on equipment comparisons | World Agri-Tech Innovation Summit |
| Specialized Publications | Monthly / quarterly | Subscription (some open-access) | Peer-reviewed depth and methodology | Frontiers in Plant Science, PrecisionAg |
| Research Institutions & Startups | Project-based | Free (trial participants) | Early access to unreleased tools | Land-grant field trials, agritech pilots |
| Policy & Industry Updates | Weekly / monthly | Free | Subsidy and compliance deadlines | USDA and state agency portals |
| Online Courses & Webinars | On demand / weekly | Free–paid, some certified | Structured technical learning | University extension e-learning |
Precision Ag Technology Payback Calculator
Use the documented input-waste reduction and yield-improvement ranges above to estimate a rough payback window for a precision agriculture upgrade on your own acreage.
Enter your numbers above to see an estimated payback period.
Assumptions: input savings and yield gain defaults are set to the low end of the 40–60% input-reduction and 20–30% yield-improvement ranges reported in the 2025 Frontiers in Plant Science meta-analysis of precision agriculture studies. This calculator excludes financing costs, maintenance, training time, and year-to-year weather variation—treat the output as a starting estimate, not a guaranteed return.
Farmonaut: Satellite-Based Monitoring for New Agricultural Technology Adoption
Farmonaut’s platform sits inside the digital-tools category measured by USDA’s adoption survey, giving farms a lower-cost entry point into satellite-based monitoring than a full precision-equipment retrofit.
- Satellite crop and infrastructure monitoring: real-time NDVI-based monitoring of crop health and field conditions from any device.
- AI-driven advisory (Jeevn AI): tailored recommendations and weather forecasts built on machine learning.
- Blockchain traceability: product traceability tools for supply chain transparency.
- Fleet and resource management: fleet management tools to reduce machinery downtime and waste.
- Environmental compliance: real-time carbon footprint tracking.
- Open APIs: integrate satellite and weather data via the Farmonaut API or the API Developer Docs.
Modular plans scale from individual fields to enterprise-level monitoring.
Subscribe to Farmonaut’s satellite monitoring and AI solutions below:
Frequently Asked Questions
- What percentage of US farms use new agricultural technologies?
- Per USDA’s 2023 Technology Use Survey, 68% of large crop farms use precision agriculture technologies overall; 70% use guidance autosteering, 45% use variable-rate technology, and 12% use drones. Midsize farms trail on every category—52% autosteer, 32% VRT. Check USDA ERS’s full report for the current cycle.
- What is the best way to stay informed about new agricultural technologies?
- No single source covers it. Combine USDA/NASS data for verified adoption rates, extension services for local applicability, digital platforms for daily field alerts, and online courses for the technical mechanics—each updates on a different schedule, so relying on only one leaves gaps.
- Are there online courses for agriculture that cover new technology?
- Yes—university extension e-learning programs and continuing-education platforms cover precision ag topics, often using USDA’s own NASS Data and Statistics datasets as course material. Check your state’s land-grant university extension site for current course calendars.
- How can farmers access real-time crop monitoring and AI-based advisory?
- Satellite-driven platforms like Farmonaut provide real-time monitoring and AI-based recommendations via mobile and web.
- How do government policies affect access to new agricultural technologies?
- Cost-share programs, conservation compliance incentives, and crop insurance terms can make adopting a technology financially viable years before its unsubsidized cost would justify it. Monitor USDA and state agriculture department portals directly for current program deadlines.
- Can large-scale farms manage operations with digital solutions?
- Yes—tools like Farmonaut’s Large-Scale Farm Management streamline monitoring and compliance in one platform.
Conclusion
The technologies themselves aren’t the hard part to find—USDA has already measured which ones are catching on and by how much. The harder part is matching the right information source to the right question: USDA and NASS for verified national numbers, extension services for whether a tool suits your soil and climate, publications and research institutions for the methodology behind the headline figures, and online courses for the hands-on skills.
Recheck the adoption figures above periodically. USDA ERS updates its Technology Use Survey analysis every few years, while NASS Quick Stats refreshes continuously—so before making an equipment decision based on a number in this article, confirm it against the current release rather than assuming it’s held steady.
Start with the data, then layer in the local and technical sources that turn a national statistic into a decision for your own acreage.

 Godrej Agrovet
 Hayleys Agriculture
 Linx Agritech
 Adinet
 Save Your Soils
 GalaxEye Space
 Grandstream Algérie
 XOS Realty
 Geospatial Lab Africa
 Agro La Gándara
 HIPSAC
 ZOL Zimbabwe
 Juligerm
 AdBio
AdBio MISE Maroc
 NWNS
NWNS Red August Group
 Farm Inc
 WeMe Global
 Agrotoken
 Blue BearX
 Insignito
 DnCubed
 Indosistim Teknologi
 Liquify Digital
 CU Foods
 BeyondTech Global
 Rouge VC
 AgroRisk
 Oath Inc
 Esri North East Africa
 MDCV UK
 Etech Consulting Madagascar
 Vestlandsforsking
 WB Dev
 Sama Premium
 Tres Valles
 Blickwinkel
 Agricultural Credit Policy Council
 eKGIS
eKGIS Mostas Tech
 Andex
Andex Deluxe Conseil
 WICO
WICO Chimera Innovation
 SkyHarvest
 Teledarbas
 Exurbia Geospatial
 FieldZero
