

Agriculture · Poster ideas guide
Agriculture Poster Ideas: 7 Topics With Sourced Facts
Pick one topic, one picture and one dated fact. Seven poster ideas for students and teachers: soil, water, pollinators, organic farming, soil cover, food waste and community, each with slogans and a source you can print.
Key takeaways
- Farming took 72% of freshwater withdrawals in 2020, industry 16% and services 12% (FAO, 2025).
- 75% of food crop types depend to some extent on animal pollination (UN, citing IPBES), but pollinators affect about 35% of world crop production by volume (FAO).
- 98.9 million hectares were farmed organically at the end of 2023, 2.1% of the world’s agricultural land (FiBL and IFOAM, 2025).
- US cover crop area rose from 15.4 to 18.0 million acres between the 2017 and 2022 censuses (USDA).
- For body text use 24 to 36 point type, and the title at least 2 to 3 times that size (Purdue University).
In this article
- How we chose the facts
- Seven agriculture poster ideas at a glance
- 1. Healthy soil: the layer under the crop
- 2. Water: how farms use it
- 3. Pollinators and biodiversity
- 4. Organic farming around the world
- 5. Soil cover and less tillage
- 6. Food waste and food security
- 7. Community and learning
- Agriculture poster slogans you can use
- Poster ideas by age group and format
- Sustainable agriculture and development posters
- Picture checklist before you print
- Poster claims to avoid
The best agriculture poster ideas pair one clear picture with one checked fact. Good starting points are healthy soil, water use, pollinators, organic farming, soil cover, food waste and community learning. Farming takes about 72% of the world’s freshwater withdrawals (FAO, 2020 data), so even a simple water poster has a real number to print.
Below are seven poster topics for students, teachers and club leaders. Each one has a picture idea, slogans, a dated fact with its source, and a note on what the fact does not say. At the end you will find a text-size guide, a step-by-step poster plan, a rainwater calculator for a school roof and answers to common questions.
How we chose the facts
A poster fact should be true, recent and easy to read at a glance. We used only numbers from government agencies, United Nations bodies, a university extension service, university poster guides and a research institute for organic farming. Each number is shown with its year, because farm statistics change.
We also say what each number measures. A share of crop types is not a share of food. If your teacher asks where a number came from, copy the source line under it onto the back of your poster.
Seven agriculture poster ideas at a glance
| Poster idea | Fact you can print | Source and year | Slogan |
|---|---|---|---|
| 1. Healthy soil | Soil organic matter helps soil resist drought | FAO Soils Bulletin 80, 2005 | Feed the soil, feed the crop |
| 2. Water | 72% of freshwater withdrawals go to farming | FAO, 2020 data | Every drop grows food |
| 3. Pollinators | 75% of food crops depend to some extent on animal pollination | UN, citing IPBES, 2016 | No bees, no apples |
| 4. Organic farming | 98.9 million hectares organic in 2023 | FiBL and IFOAM, 2025 | Grow it clean |
| 5. Soil cover | US cover crop area up from 15.4 to 18.0 million acres | USDA Census, 2022 | Keep the soil covered |
| 6. Food waste | 1.05 billion tonnes of food wasted in 2022 | UNEP, 2024 | Waste less, grow more |
| 7. Community | Show the people who grow your food | Your own local survey | Farmers feed our town |
1. Healthy soil: the layer under the crop
Draw a cut-away of the ground. Show roots, a worm, a layer of dark topsoil and a layer of lighter subsoil. Label the dark layer “organic matter”. This is the easiest agriculture poster for younger students, because the drawing does most of the talking.
FAO calls soil organic matter the key to drought-resistant soil and steady food production in its Soils Bulletin 80. Organic matter comes from plant roots, crop residue, compost and manure. The bulletin lists cover crops, mulch and reduced or zero tillage among the ways to keep it in the soil, along with residue management, manure and compost.
Slogans: “Healthy soil, healthy future.” “Feed the soil, feed the crop.” “Life lives underground.”
What not to claim: do not print a percentage gain in fertility or yield unless you can point to a trial for your own region. Results depend on soil type, climate and how long the practice has run.
▶ Seven simple ways to protect soil and water, explained with an earthworm. · 4:34
2. Water: how farms use it
Show a river, a pipe and a field, with the pipe thicker where the water is bigger. A bar chart on the poster works well. Put the three sectors side by side and let the farm bar be the tall one.
Chart
Who takes the world’s freshwater
Share of global freshwater withdrawals by sector, 2020
The FAO report on land and water says agriculture made up 72% of freshwater withdrawals in 2020. Industry took 16% and services 12%. The chart below shows those three numbers. Withdrawal means water taken from rivers, lakes and aquifers, as defined on the FAO AQUASTAT water-use page.
The same report series also notes that the area equipped for irrigation reached 349 million hectares in 2020, up 20% from 2000, according to the FAO Statistical Yearbook 2022. Add a small map or an arrow if you want a second fact. FAO’s AQUASTAT water-use page explains that for Africa, Asia and Latin America the withdrawal data come from national ministries and agencies, while for Europe, North America and some other regions it also uses Eurostat and OECD.
Slogans: “Every drop grows food.” “Measure it, then save it.” “Rain today, crops tomorrow.”
A rain barrel makes a good picture. The University of Nebraska Extension gives the rule used in the calculator further down: multiply roof area by rainfall in inches by 0.623 to get gallons.
3. Pollinators and biodiversity
Draw a flower strip along the edge of a field with a bee, a butterfly and a hoverfly. Add a field of wheat on the other side. This shows both sides of the story: some crops need insects, others do not.
The United Nations, citing the IPBES pollinator assessment, says 75 per cent of food crops depend to some extent on animal pollination, and that crops which depend on pollinators are worth about $577 billion a year. The same page says there are more than 20,000 bee species and that most pollinator species are wild.
Be careful with the wording. The 75% counts crop types, not the share of the food we eat by weight. FAO adds that pollinators affect about 35 percent of the world’s crop production by volume. A line such as “75% of food crop types benefit from pollinators” is accurate and safe.
Slogans: “No bees, no apples.” “Diversity builds resilience.” “Plant a flower strip.”
▶ Benefits of mixing crops and animals on one farm. · 2:55
4. Organic farming around the world
Use a globe or a world map with four coloured patches. Add a green leaf badge and the words “certified organic”. If your class sells produce, add a real certification logo only if you hold it.
Chart
Organic farmland by region
Million hectares managed organically, end of 2023, four regions shown (Asia and North America omitted)
The Research Institute of Organic Agriculture (FiBL) and IFOAM report that 98.9 million hectares were farmed organically at the end of 2023, up 2.6% on 2022, run by 4.3 million producers. That is 2.1% of the world’s agricultural land. Retail sales of organic food passed 136 billion euros.
The chart shows four of the regions in that report. Asia and North America are in the full report and are left off the chart, so it shows part of the world, not all of it.
Slogans: “Grow it clean.” “Soil first.” “Know your soil, grow your future.”
If your poster mentions pesticides or fertilizer, add the line “follow the product label and local rules”. Organic standards differ by country, so check the rules where you live before you use the word “organic” on anything you sell.
5. Soil cover and less tillage
Show two fields side by side. One has bare brown soil after harvest. The other has a green cover crop growing between the rows or after the main crop. Label them “bare” and “covered”. A rain cloud over both makes the point about erosion without a single number.
Chart
US cropland by soil practice
Million acres of cropland in each practice, 2017 and 2022 US Censuses of Agriculture
The US Department of Agriculture counted cropland planted to a cover crop in its 2022 Census of Agriculture. It was 17.99 million acres, up from 15.39 million acres in 2017. The number of farms using cover crops barely moved, at about 153,000 in both years, so the average area per farm went up. No-till cropland was 105.2 million acres in 2022 against 104.5 million in 2017. Cropland under other reduced tillage fell slightly, from 97.8 to 97.1 million acres.
The dumbbell chart shows all three. It is a US picture only and says nothing about why farmers changed. Say “US” on your poster if you use it.
Slogans: “Keep the soil covered.” “Green in winter, rich in spring.” “Roots hold the ground.”
▶ Seven green farming technologies that save water, fuel and fertilizer. · 2:24
6. Food waste and food security
Draw a plate or a shopping bag with a slice cut out, or a row of 5 apples with one crossed out. The idea is simple: the food is grown, then lost on the way to the table.
The United Nations Environment Programme found that 1.05 billion tonnes of food were wasted in 2022. That is 19% of the food available to consumers, lost at retail, food service and household level. On top of that, FAO estimates around 13% of food is lost in the supply chain between harvest and the shop. The same UN News article puts the number of hungry people at 783 million. These two percentages use different bases, so print them as two facts, not one total.
For a local number, the US Environmental Protection Agency says 66.2 million tons of wasted food were generated by US retail, food service and homes in 2019, and only 5% of it was composted. A school compost bin is a good next step.
Slogans: “Waste less, grow more.” “From farm to fork, not to the bin.” “Compost it.”
7. Community and learning
Draw a school group visiting a farm, a farmers’ market stall, a seed swap or a field day. Add a QR code that links to a school page with sources. This poster needs no global statistic. Your own survey does the job. Ask 20 classmates where their lunch was grown, then show the answers as a simple bar chart or a row of icons.
Local facts make a stronger poster than global ones. Call your county extension office, a farm bureau or a local grower and ask for one number, such as the main crop in your area or the harvest month. Write the name and date next to it.
Slogans: “Farmers feed our town.” “Know your grower.” “Learn it, grow it, share it.”
Agriculture poster slogans you can use
A short slogan works best, eight words or fewer and in the active voice, with one clear action. Here are slogans grouped by topic. Change a word or two so the poster is yours.
- Farmers: “Thank a farmer today.” “Behind every meal, a farmer.” “Roots in the land, hands in the soil.”
- Sustainable agriculture: “Farm for tomorrow.” “Take care of the land that feeds us.” “Grow more with less waste.”
- Organic farming: “Go organic, grow the future.” “Clean food, clean fields.”
- Importance of agriculture: “No farms, no food.” “Plant, grow, harvest.” “From seed to supper.”
- Water and soil: “Save water, save crops.” “Soil is life.”
Poster ideas by age group and format
The same seven topics work for different ages. What changes is how much text you add and how you build the poster.
- Ages 6 to 9: One big drawing, a four-word slogan and no numbers. A seed growing into a plant, with the sun, rain and soil labelled, is enough.
- Ages 10 to 13: A drawing plus one fact and its source. A “from seed to supper” strip with five panels (seed, soil, water, harvest, plate) shows how farming links to what the child eats.
- Ages 14 to 18: A chart you built yourself, two facts with sources and a short call to action. A before-and-after comparison, such as bare soil against cover crops, suits this level.
- Adult or club display: A timeline, a map or a table with sources in small type, plus a QR code that opens a page with the full references.
For a poster-making contest, read the rules first. Many contests give a theme, a size, a set of materials and a ban on logos. Stay inside those limits. A simple poster that follows the theme often scores higher than a complex one that does not.
Sustainable agriculture and development posters
Two search topics come up often: “sustainable agriculture” and “agricultural development”. Both are broad, so narrow them to one picture.
For sustainable agriculture, a circle diagram works well: soil feeds the crop, the crop feeds people and animals, and manure and compost return to the soil. Label each arrow with a plain verb. The circle fits ideas 1, 4 and 5 above.
For agricultural development, show a timeline of one real tool or practice, such as irrigation. The FAO yearbook figure of 349 million hectares equipped for irrigation in 2020, more than twice the 1960s level, gives a clear before-and-after. Use a small farm sketch at each end of the arrow and write the years under it.
A cultivation system poster shows the steps for one crop. Pick a crop grown near you, list the steps (prepare the soil, plant, water, protect, harvest, store) and add one local date, such as the usual planting month. Ask a local grower or the extension office to check your dates.
Picture checklist before you print
- Does the poster make one point?
- Is every number dated, with a source line?
- Do the words “most”, “only” or “always” appear? Remove them unless the source says so.
- Are the units clear (hectares, acres, tonnes, gallons)?
- Does the poster show a real farm, or a made-up scene? Say which.
- Is the title readable from across the room?
- Did a friend, a teacher or a farmer look it over?
If you draw pesticide, fertilizer or machinery, show safe use: gloves, labels and closed containers. Say “follow the product label and local rules” if you mention any chemical.
Poster claims to avoid
Poster pages often repeat round numbers that have no source. These three are invented examples: “organic farming raises soil life by 30%”, “drip saves 5,000 litres per farm” or “biodiversity cuts pest damage by 40%”. Results like these depend on the crop, the soil, the climate and the length of a trial. A number without a study behind it can make a poster look careless.
Use this short test. Can you name who published the number, the year and what it measures? If not, replace it with a fact from the sections above, or write a plain statement such as “Cover crops protect bare soil”. A true sentence without a number is better than a number you cannot defend.
Also watch out for words that make claims bigger than the source. “All”, “every”, “most” and “only” need a source on that very sentence. “Up to” a number is a maximum, not what a farm will see.
Use your own data on the poster
A poster with data from your own school or farm stands out from a poster of copied facts. Here are five simple projects, each with one chart you can draw by hand.
- Food miles: list ten foods in the school kitchen and where each one was grown. Draw a bar chart of the distances.
- Compost weight: weigh the lunch scraps in the bin for one week. Draw a line chart by day.
- Rain log: put a rain gauge in the school yard and record rain for a month. Compare it with the roof calculator below.
- Plant growth: grow beans in two cups, one with compost in the soil and one without. Measure height every three days. Say clearly that it is a small classroom test, not proof for a farm.
- Pollinator count: sit by a flower patch for ten minutes and tally the bees, flies and butterflies you see. Repeat on three days.
Write the date, the place and the method under each chart. This is what a scientist would do, and it makes your poster credible.
Printing, materials and display
For a hand-made poster, thick card or poster board holds paint and glue without curling. Pencil the layout first, then add marker or paint. Cut pictures from old seed catalogues and magazines only if the contest allows collage.
For a printed poster, set the file at the size of your print order before you add text. Purdue’s agronomy printing guide calls 48 by 36 inches the most commonly used poster size and says the display boards at most poster sessions are that size. Check the board you will use. Ask your print shop for the paper size, leave an edge margin and check spelling twice.
Place the poster at eye level where people wait or walk slowly: a school hallway, a library, a cafeteria line, a farmers’ market stall or a community board. Add a date so the poster does not stay up after the facts are old.
Finally, give credit. Write “Poster by” with your name and class, and list the sources in one line at the bottom. A short list such as “FAO 2025, USDA 2022, FiBL 2025” tells readers where to check.
Layout, colours and text size
Pick one topic per poster. A single message beats five small ones. Use a big picture in the middle, a short title at the top and three or four short lines of text.
Use earth tones for soil, green for plants and blue for water. Keep strong contrast between text and background: dark text on a light patch, or white text on a deep green block.
Text size matters most if people will read your poster from a few feet away. Purdue University’s agronomy department recommends 24 to 36 point type for body text. It calls 24 point an absolute minimum, and says titles are usually at least two or three times the body size. The Knight Alzheimer Disease Research Center at Washington University suggests titles of 150 point or more and headings of at least 32 point when people can come close. These guides are for science posters, but the same type sizes help a classroom poster.
| Poster part | Suggested size | Source |
|---|---|---|
| Title | 150 pt or more | Washington University |
| Heading | 32 pt or more | Washington University |
| Body text | 24 to 36 pt | Purdue University |
| Source line | Can be smaller than body text | Purdue University |
How to make an agriculture poster in six steps
- Pick one topic from the seven above.
- Choose one fact and write its source and year on a scrap of paper.
- Sketch the picture in pencil. Leave a clear space for the title.
- Write the slogan. Check that it has eight words or fewer.
- Paint or print the colours, then add the fact in large type.
- Put the source line in small type at the bottom. Ask a classmate to read the poster from three steps back.
For a digital poster, use a design tool your school already has, export a PDF and share the link by QR code. Matte paper reads better under classroom lights. For an outdoor display, laminate the poster.
Rain barrel calculator for a school roof
Try the numbers for your school roof below. Enter the roof size and your local rainfall to get gallons for your poster. It uses the roof rule from the University of Nebraska Extension.
Try the numbers for your own farm below.
Calculator
How much rain could my roof collect?
Enter your own roof footprint and local rainfall.
- Litres per year: 84,890 L
- Gallons from one 1-inch storm: 748 gal
- Barrels filled by one 1-inch storm: 15.0
Example values only, not a forecast. The constant 0.623 gallons per square foot per inch of rain comes from University of Nebraska Extension (NebGuide G2220). Use the roof footprint, not the sloped surface. Collection efficiency covers losses to splash, gutters and first-flush; it is your input, and 3.785 litres per US gallon is a fixed conversion. Rainfall is an example, use your local figure.
Using satellite images on an agriculture poster
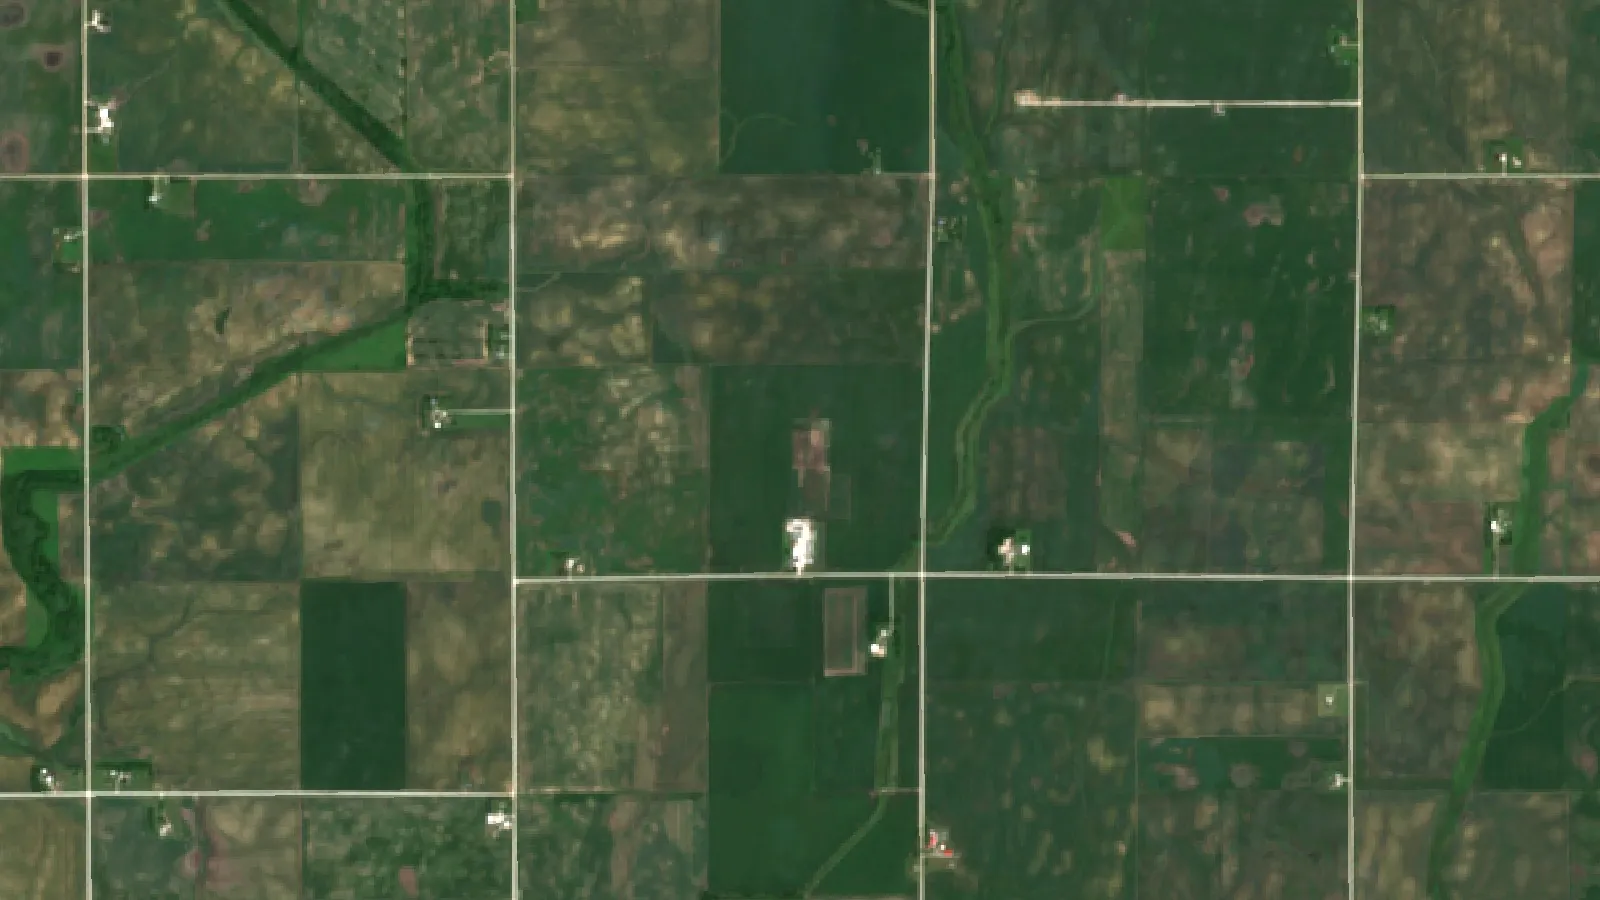
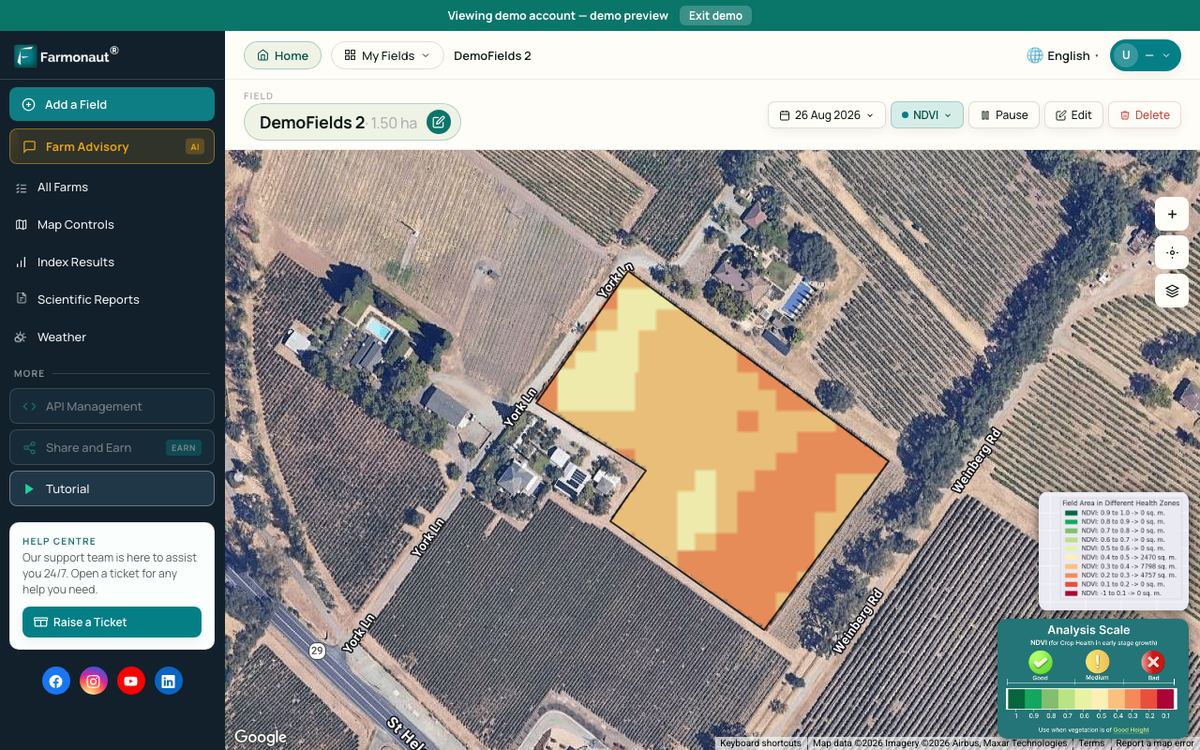
A satellite picture of a farm makes a striking centre image. Public images from the Copernicus Sentinel-2 satellite are openly available through the Copernicus programme, and they show green fields in bright colours. Farmonaut Satellite + AI Farm Monitoring System also shows vegetation maps of fields through the season. A satellite shows how green the plants are, not what is causing a change, so label the picture “vegetation map” and not “crop disease”.
Related pages on our site: carbon footprint tracking, crop loans and insurance, weather data for developers, farm vehicle fleet management, product traceability, farm admin app, satellite data API and mobile apps.
FAQ
What is a good idea for an agriculture poster?
Pick one topic, such as soil, water, pollinators, organic farming or food waste. Draw one clear picture, add a short slogan and one fact with its source and year.
What is a good slogan for an agriculture poster?
Short slogans with one action work best. Examples are “Feed the soil, feed the crop”, “No bees, no apples” and “Thank a farmer today”.
How do I make an agriculture poster for students?
Follow the six steps above. Sketch the picture, write the slogan, add the fact in large type and put the source at the bottom. Check the poster from three steps back.
What facts can I put on a poster about farming?
Use dated numbers from official sources: 72% of freshwater withdrawals go to farming (FAO, 2020 data), 75% of food crop types depend to some extent on animal pollination (UN, citing IPBES), and 98.9 million hectares were organic in 2023 (FiBL and IFOAM).
What colours should an agriculture poster use?
Use brown for soil, green for plants and blue for water. Keep strong contrast between text and background so people can read it from a distance.
Farmonaut crop monitoring
See a real field from space
Draw a field once and Farmonaut shows satellite vegetation maps for it through the season, on web, Android or iOS.



Keep reading

Sources
- FAO, State of the World’s Land and Water Resources for Food and Agriculture 2025: fao.org
- FAO, Statistical Yearbook World Food and Agriculture 2022: openknowledge.fao.org
- FAO, AQUASTAT water use methodology: fao.org
- FAO, The importance of soil organic matter, Soils Bulletin 80 (2005): fao.org
- United Nations, Pollinators vital to our food supply (2016): un.org
- FiBL and IFOAM, The World of Organic Agriculture media release (2025): fibl.org
- USDA NASS, 2022 Census of Agriculture, Volume 1 Chapter 1: nass.usda.gov
- UN News, a fifth of all food goes to waste (27 March 2024): news.un.org
- US EPA, Composting: epa.gov
- University of Nebraska Extension, NebGuide G2220 rainwater harvesting (2014): extensionpubs.unl.edu
- Purdue University Agronomy, Poster guidelines: ag.purdue.edu
- Washington University Knight ADRC, Fonts and posters: knightadrc.wustl.edu
- FAO, Pollination (FAO pollination portal): fao.org
Discussion
Questions, corrections or field experience? Share them below. First-time comments are reviewed before they appear, and your email is never published.
No comments yet. Be the first to add a question or your experience.

 XOS Realty
 Geospatial Lab Africa
 KhetiBuddy
 Agro La Gándara
 Global Agrifood
 HIPSAC
 ZOL Zimbabwe
 Juligerm
 AdBio
 MISE Maroc
 NWNS
 Red August Group
 Farm Inc
 WeMe Global
 Agrotoken
 Blue BearX
 Insignito
 Croptimum
 DnCubed
 Field Capacity
 Indosistim Teknologi

 Licence holder · Niger · Gold
 Licence holder · Nigeria · Gold + lithium










