

Reviewed August 2026 against USDA ERS, UNL and Iastate.
Internet of Things Examples in Smart Agriculture: 12 Products, What They Cost, What They Return
The most widely deployed internet-of-things devices on American farms are GPS guidance receivers, soil moisture probes, yield monitors, section-control valves, livestock activity collars and robotic milkers — and unlike consumer IoT, each one has a published, auditable payback. USDA’s Economic Research Service puts automated guidance on well over 50% of US acreage planted to corn, cotton, rice, sorghum, soybeans and winter wheat, while yield maps, soil maps and variable-rate technology sit at only 5–25% of planted acres for winter wheat, cotton, sorghum and rice (USDA ERS, EIB-248, February 2023). That gap between the sensor that steers the tractor and the sensor that changes the fertiliser rate is where nearly all of the remaining money sits. Connected devices are only part of the picture, and a guide to the smart farming technologies farmers use explains where each one earns its place.
On this page
- 12 internet of things examples on a working farm
- How many US farms actually run this kit
- Smart farming examples, system by system
- Does it pay? The money per 1,000 acres
- Payback calculator: which device first?
- The climate-smart layer
- The smart agriculture and farming market
- What still goes wrong
- Farmonaut’s farmer tech offering
- FAQ



12 Internet of Things Examples on a Working Farm
Every row below is a device or service you can buy in the United States today. The evidence column names the study or dataset the figure comes from — where no public US figure exists, the row says so rather than guessing.
| IoT device / product | What it senses or actuates | Reported value | Cost basis | Evidence |
|---|---|---|---|---|
| RTK auto-steer receiver | Sub-inch machine position | ~$1/acre in tillage from cutting 7% overlap | Capital + RTK signal subscription | Iowa State ICM, Feb 2012 |
| Section (swath) control valves | Shuts planter rows off in overlap | $7.91/acre in Iowa corn | Retrofit kit per implement | Iowa State ICM, Feb 2012 |
| Capacitance soil moisture probe | Water content by depth, hourly | 2 inches/acre less pumping | $175 with cost-share to $1,500/yr subscription | Nebraska Extension, Jun 2017 |
| Yield monitor + GNSS | Mass flow, moisture, position | Feeds the map every VRT prescription needs | Factory-fit on most late-model combines | USDA ERS EIB-248, 2023 |
| Variable-rate controller | Changes seed/fertiliser rate by zone | Part of the 8% fertiliser cut already banked | Controller + agronomy service | AEM / Kearney, 2025 |
| Part 137 spray drone | Targeted aerial application | 9,584 acres/operator average, 2025 | Airframe + FAA Part 137 certification | American Spray Drone Coalition, 2025 |
| Satellite NDVI / NDWI subscription | Multispectral crop vigour, no hardware | Whole-farm scouting without a flight | Per-acre or per-field subscription | Farmonaut platform |
| On-farm weather station | Rain, wind, ET, leaf wetness | Sets legal spray windows and ET-based irrigation | One-off unit + telemetry plan | No single US benchmark published |
| Pivot telemetry / remote start | Pivot position, pressure, run state | Cuts drive-out trips; no public US figure | Per-pivot annual plan | Ask dealer for their trial data |
| Cow activity / rumination collar | Motion, rumination, heat detection | Counted in the 13% net-return lift | Per-cow collar + base station | USDA ERS ERR-356, Jan 2026 |
| Robotic milking box | Teat location, yield, conductivity per quarter | 6% of US milk in 2021; +13% net returns | Per-box capital, sized to ~60 cows | USDA ERS ERR-356, Jan 2026 |
| Greenhouse climate controller | Light, temperature, humidity, CO₂ | Year-round production under glass | Controller + actuator retrofit | See CEA section below |
The Best Agriculture Technology, Ranked by Evidence
There is no single best agriculture technology. The better question is which smart agriculture products have independent, published results on working farms. Ranked by the strength of that evidence, the examples in this article fall into three groups.
Strong public evidence. GPS guidance and auto-steer (USDA survey data on more than half of major-crop acres), section control (Iowa State field measurements), soil moisture sensors (Nebraska Extension trials) and robotic milking (USDA ERS net-return study). Buy these on the numbers.
Good evidence, fast-changing. Spray drones. The American Spray Drone Coalition 2025 survey counted 1,710 approved Part 137 drone operators and more than 16.4 million treated acres. Costs and rules are still moving, so get local quotes.
Early or vendor-led. Field robots, nanosensors and most AI claims. Figures usually come from the maker, not a trial.
For remote farming technology, the lowest-hardware option is a satellite subscription, which covers every field without a device on it. Pair it with one owned device that has a proven payback on your farm type, such as a soil moisture probe on irrigated ground or section control on the planter.
How Many US Farms Actually Run This Kit
USDA NASS surveys technology use every two years through its Agricultural Land Values and Technology Use Survey, with a sample of roughly 28,000 operations. The August 2025 Technology Use release found 55% of US farms on a broadband connection and 74% reaching the internet through a cellular data plan. Nebraska, one of the most instrumented states in the country, reported 41% of farms using precision agriculture practices in 2025, down from 55% in 2023, with internet access at 87%, broadband at 54%, satellite at 28% and smartphones at 85% (University of Nebraska–Lincoln CropWatch, 11 August 2025).
Adoption is not evenly spread. USDA’s Agricultural Resource Management Survey shows guidance systems on 73% of the largest corn farms (2016) but 10% of the smallest, and 82% versus 7% in winter wheat (2017). Cotton is the outlier — even the smallest cotton farms hit 50%.

Smart Farming Examples, System by System
1. Guidance and precision farming
Auto-steer is the cheapest entry point because the payback is mechanical, not agronomic: fewer passes, less overlap, less fuel. Iowa State measured average planting overlap at 3.3% and spring tillage overlap at 7% across more than 2,500 monitored acres, and valued swath control in corn at $7.91 per acre against seed at $113.80/acre and a 12% yield penalty in double-planted strips (Iowa State University Extension Integrated Crop Management, 24 February 2012). Those overlap percentages have not changed with geometry, but check current seed and fuel prices against the 2012 basis before you use the dollar figure.
Farmonaut delivers the same layer without hardware: satellite NDVI, soil moisture and crop-stress maps in a browser or phone.

2. Smart irrigation and soil moisture sensing
Irrigation is where the biggest US water numbers live. USDA ERS reports 54.9 million irrigated acres in 2022, under 17% of harvested cropland but more than half the total value of US crop sales, and irrigation accounted for 47% of the nation’s freshwater withdrawals between 2010 and 2020. Across the 17 Western states, pressurized systems reached 29 million acres — 74% of irrigated cropland in 2023, up from 37% in 1984 (USDA ERS, Irrigation & Water Use, updated 27 January 2026).
Sensor economics are documented. Nebraska Extension reports sensor users saving 2 inches per acre, with pumping costs of $10–$30 per acre for those 2 inches, giving $1,899.30 in annual savings on a 130-acre field and net savings of $400–$1,700 a year after sensor costs of $175 to $1,500. Over-irrigation on Hastings silt loam cut yields by 8–15 bushels/acre (Nebraska Extension CropWatch, 8 June 2017). Autonomous units extend this: the OSCAR electric irrigation robot can water about 40 hectares a week and is reported to use about 20% less water than reel-gun systems (Future Farming, April 2026). More on scheduling in our guide to sustainable crop irrigation.

3. Data analytics and AI
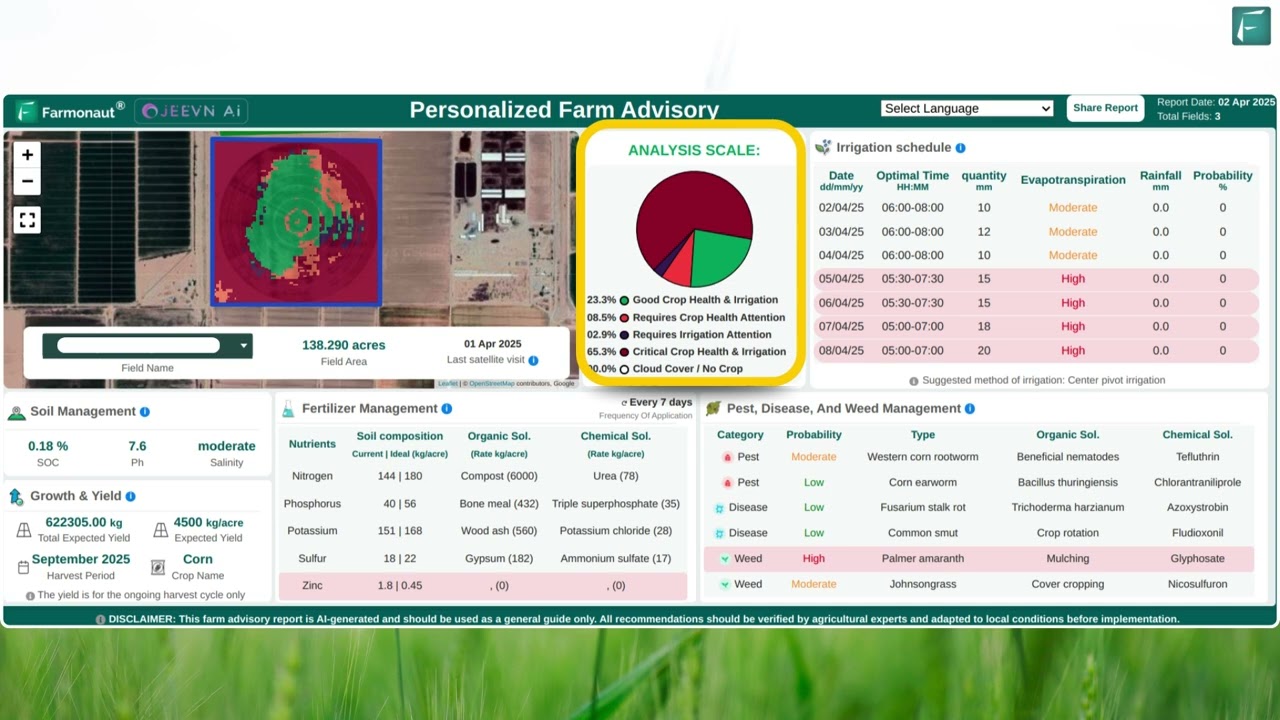
The sensors are the cheap part; the prescription is the product. AEM and Kearney found that precision technologies already deliver an estimated 5% crop productivity gain and that current adoption has avoided cultivating about 11.4 million acres (AEM). Our Jeevn AI advisory turns satellite time series into dated field actions rather than raw indices. That prescription is one step in a longer decision cycle, and our explainer on what precision agriculture means shows how each stage fits together.
4. Drones and remote sensing
Spray drones are the fastest-growing smart agriculture product class in the United States. Drones treated more than 16.4 million US acres in 2025, a 58.7% year-on-year increase, driven by a 58.3% rise in approved FAA Part 137 UAS operators to 1,710. Average acres treated per operator stayed statistically flat at 9,584 — growth came from more operators, not bigger machines. In North Dakota alone, certified owner-operators rose from 21 to 33 and treated acres jumped 169% to 185,633 (Agweek, 29 June 2026, citing the American Spray Drone Coalition 2025 Impact Survey).

Drone imagery is best paired with satellite coverage so you fly only where the map already flagged stress — that is exactly what Farmonaut’s field monitoring is designed to do.
5. Controlled-environment agriculture
CEA — greenhouses and vertical farms — trades weather risk for an electricity bill, and the electricity is the whole economic argument. Published benchmarking puts vertical-farm lettuce at about 10–18 kWh of electricity per kilogram, with lighting the largest load (Benchmarking energy efficiency in vertical farming, ScienceDirect). Before committing capital, price your own kWh against your state’s industrial tariff rather than a national average; the same building is profitable in one state and not in another. Our review of greenhouse innovations covers the control side, and peer-reviewed work on climate-smart water technologies covers the water side. Growers use our carbon footprinting tools to attach an emissions figure to that load.

6. Nanosensors
The earliest-stage item on this list. Nanotechnology in agriculture covers nanoscale pathogen detection and controlled-release nutrient carriers. There is no USDA adoption statistic for nanosensors on US farms, because commercial deployment is not yet at survey scale — treat any vendor percentage as a claim, not a benchmark, and ask which land-grant trial produced it.
7. Precision livestock farming
This is the best-evidenced category in the whole list. USDA ERS report ERR-356, published 22 January 2026 by Jonathan McFadden and Zach Raff, found that robotic milking, or use of two or more precision dairy technologies, increases US dairy net returns by 13% on average (USDA ERS, ERR-356). Robotic milking produced 6% of US milk in 2021, up from 4% in 2016, with adoption highest on midsized herds — 13% of dairy farms running 150–499 head. See also our field notes on precision cattle farming and the background on precision livestock farming. Buyers increasingly want the animal history too, which is what blockchain traceability records.

Does It Pay? The Money Per 1,000 Acres
AEM and Kearney put a dollar figure on each component of the current 5% productivity gain, sized to a 1,000-acre row-crop operation. It totals about $118,000 a year — and revenue, not input savings, is more than half of it.
For context on the input side: anhydrous ammonia peaked above $1,600 per ton and urea above $1,000 per ton in 2022, and while prices came down through 2024 they remained above pre-2021 levels going into the 2025 planting season (USDA ERS Chart of Note, 27 March 2025). A percentage cut in fertiliser is worth more now than it was five years ago.
Payback Calculator: Which Device First?
Pick the technology, enter your acres and your quoted prices — the per-acre values are the published study figures above, not our estimates.
Run your own numbers
Assumes the published per-acre benefit transfers to your fields and holds every year, with no discounting, no salvage value, no repairs, no training time and no yield change beyond what each study already measured. The Iowa State figures rest on 2012 seed and fuel prices; re-price them before relying on the result. It is a screening tool, not a capital budget.
The Climate-Smart Layer
Agrivoltaics is the clearest example of smart technology in agriculture that pays twice. The USDA Northeast Climate Hub documents a 10-acre, 4.2-megawatt project on a blueberry farm in Rockport, Maine, the first of its kind in that state, and notes NREL's InSPIRE programme ran 22 research sites across the country; DOE's Solar Futures Study projects ground-mounted solar needing about 0.5% of contiguous US land by 2050 (USDA Climate Hubs). Background on agrivoltaics and on the wider climate-smart market fills in the rest. Alongside it sit biochar, cover cropping and no-till — see our list of climate-smart practices. Farmonaut supports this with carbon footprinting and a large-scale farm management platform.

The Smart Agriculture and Farming Market
Market sizing here comes from commercial research houses, not government statistics, and the estimates diverge widely — so treat the direction as reliable and the level as a range. Precedence Research values the global smart agriculture market at $26.27 billion in 2025 and $29.48 billion in 2026, forecasting $81.49 billion by 2035 at 11.99% CAGR, with North America holding 43% share in 2025 (Precedence Research, updated 24 July 2026). Other research houses publish different figures for the same year. If you need a defensible number for a business plan, buy one report and cite it by name rather than averaging headlines.
What Still Goes Wrong
- Connectivity, not capex, is the binding constraint. With 55% of US farms on broadband, a meaningful minority cannot stream telemetry from the far quarter. Check cellular coverage at the field boundary, not the farmhouse, before buying anything that needs a live link — see our notes on high-technology farming.
- Adoption can go backwards. Nebraska's precision-ag share fell from 55% in 2023 to 41% in 2025. Kit gets bought, then abandoned when the data never turns into a decision.
- Scale bias is real. A 73%-versus-10% split between largest and smallest corn farms is not a technology gap, it is an amortisation gap. Subscription analytics change that arithmetic; owned hardware does not.
- Vendor figures are not evidence. If a per-acre claim is not traceable to a named trial, treat it as marketing.
Farmonaut's Farmer Tech Offering
Our smart agriculture products are deliberately hardware-free — satellite instead of sensors, so cost scales with acres rather than devices:
- Satellite crop health monitoring: multispectral vegetation and soil-moisture indices by field, on web, mobile or API.
- Jeevn AI advisory: dated, field-specific actions from satellite and weather time series.
- Blockchain traceability: immutable farm-to-fork records — product traceability.
- Fleet and resource management: our fleet management toolkit.
- Carbon footprinting: emissions tracking for CEA and field operations.
- Crop loan and insurance verification: satellite-based loan and claims validation.
- Large-scale farm management: the admin platform for multi-site operations.
API access: Explore the API | Developer docs
Frequently Asked Questions
What is the most common internet of things example in US agriculture?
GPS guidance and auto-steer. USDA ERS puts automated guidance on well over 50% of acreage planted to corn, cotton, rice, sorghum, soybeans and winter wheat — far ahead of yield mapping, soil mapping or variable-rate technology, which sit at 5–25% of planted acres for several of those crops.
Which smart farming technology pays back fastest?
On row crops, section control has the highest published per-acre value in the studies cited here at $7.91/acre in Iowa corn, against a modest retrofit cost. On irrigated ground, soil moisture sensors returned $400–$1,700 net per year on a 130-acre Nebraska field. On dairies, robotic milking and paired precision technologies raised net returns 13% on average per USDA ERS ERR-356 (January 2026). Use the calculator above with your own quotes.
Are smart agriculture products worth it on a small farm?
Owned hardware usually is not — that is why guidance adoption on the smallest corn farms was 10% versus 73% on the largest. Subscription satellite analytics remove the capital step, which is the reason the price of the data, not the price of the sensor, decides it.
How big is the smart agriculture market?
Precedence Research puts it at $26.27 billion globally in 2025, with North America at about 43% share; other research houses publish different figures. There is no official government estimate, so cite one named report rather than a blended figure.
Do I need a licence to run a spray drone in the US?
Yes — agricultural application by drone requires an FAA Part 137 Agricultural Aircraft Operator Certificate. There were 1,710 approved Part 137 UAS operators in 2025. Scouting-only flights fall under different rules.
Where does AI fit into all this?
AI converts sensor streams into prescriptions — rates, dates and thresholds. See our guide on integrating AI into farm management, and on the resource side, sustainable resource use.
The Bottom Line
Smart farming in the United States is no longer speculative: guidance is on more than half of major-crop acreage, drones treated 16.4 million acres in 2025, robotic milking made 6% of the milk supply, and precision technology is already worth roughly $118,000 a year on a 1,000-acre operation. The unclaimed value sits in the layers most farms skipped — variable-rate application, soil moisture scheduling and the analytics that turn a yield map into next season's prescription. Price those against your own acres, your own fertiliser bill and your own quotes before you buy anything.

 Hydenmet
 Dirks Bros Farms
 Red August Group
 Farm Inc
 WeMe Global
 Agrotoken
 Blue BearX
 Insignito
 Croptimum
 DnCubed
 Field Capacity
 Indosistim Teknologi
 Liquify Digital
 CU Foods
 BeyondTech Global
 Rouge VC
 AgroGreen Dynamics
