

Gold mining · Case studies
Gold Mine Case Studies: 5 Real Projects Compared
Detour Lake, Goose, Fekola, Mount Milligan and Pueblo Viejo side by side: 2025 output, grade, recovery, cost per ounce and reserves, all from the owners’ own reports.
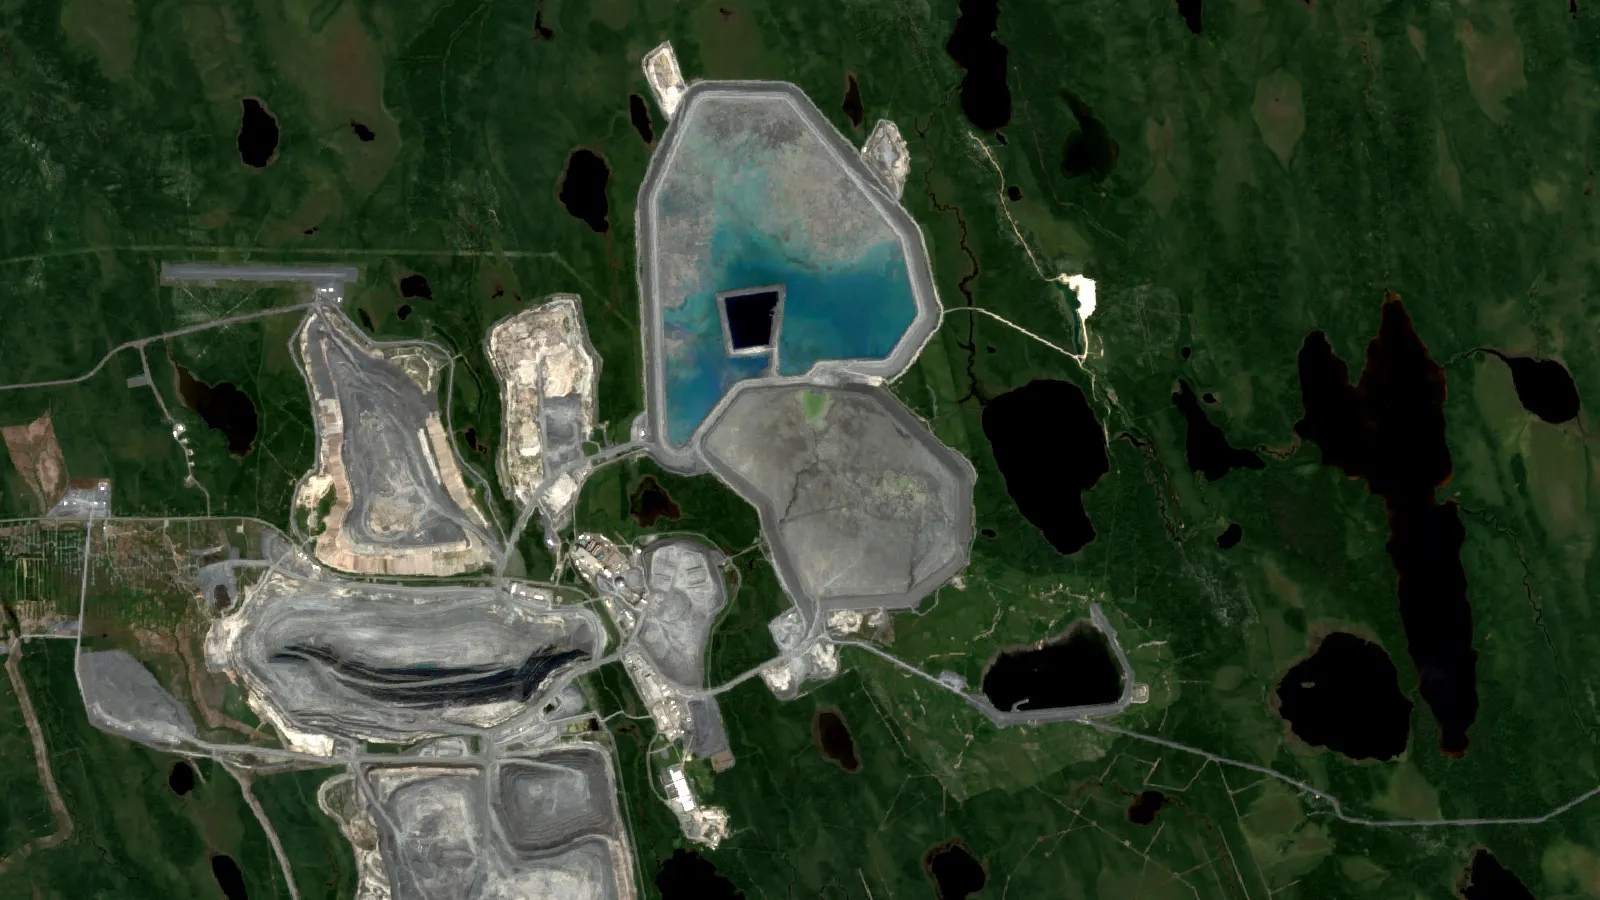
Key takeaways
- Detour Lake produced 692,675 oz in 2025 from reserves grading 0.72 g/t; scale, not grade, carries it (Agnico Eagle, 2026).
- Goose, a new mine, made 53,170 oz (14,554 oz pre-commercial) at 5.16 g/t mill feed in 2025, at the low end of guidance (B2Gold, 2026).
- Fekola’s AISC was US$1,804 per oz sold in 2025, and extra royalties from a higher gold price added US$169 per oz at B2Gold group level (B2Gold, 2026).
- Mount Milligan’s by-product AISC was US$1,194 per oz because copper revenue is credited to gold (Centerra, 2026).
- Pueblo Viejo holds about 20 Moz of reserves at 2.06 g/t, and its model runs to 2049 (Barrick technical report, 2026).
In this article
- How these five projects were chosen
- Gold mine case studies compared at a glance
- Detour Lake, Ontario: scale beats grade
- Goose, Back River district: a high-grade mine in its first year
- Fekola, Mali: a mid-grade pit with a state partner
- Mount Milligan, British Columbia: gold with a copper credit
- Pueblo Viejo, Dominican Republic: refractory ore and a long mine life
- What the five projects have in common
- Gold mine margin calculator
- How to read a mine report like these
- Where satellite data fits before a mine exists
- Frequently asked questions
Five operating gold mines show five different ways to make money from rock: a huge low-grade open pit (Detour Lake, Canada), a small high-grade underground ramp-up (Goose, Canada), a mid-grade open pit with a state partner (Fekola, Mali), a gold-copper mine where copper pays part of the bill (Mount Milligan, Canada) and a refractory-ore operation that needs autoclaves (Pueblo Viejo, Dominican Republic). Each one below is built from the owner’s own 2025 reports, published between February and March 2026, so the numbers can be checked line by line.
This page is written for consultants, licence holders and investors who want to see what a producing project looks like in numbers: tonnes, grade, recovery, cost per ounce and reserves. It is not a ranking of the best mines. It is a set of examples that show how grade, scale and cost trade off against each other.
How these five projects were chosen
Every project had to meet four tests. It produced gold through 2025, its owner published a full-year report or technical report with production and grade, it sits in a different geology or cost setting from the others, and the owner is a listed company that files its numbers in public. Pueblo Viejo is the one exception on output: its technical report gives reserves and history but no 2025 ounces, so the table leaves that cell blank.
Three terms appear throughout. Grade is the amount of gold in a tonne of rock, in grams per tonne (g/t). Recovery is the share of that gold the plant actually captures. All-in sustaining cost (AISC) is the World Gold Council’s measure of what it costs to produce and sell an ounce, including mine operating costs, sustaining capital, royalties and corporate costs, but not income tax or growth projects (World Gold Council guidance note). Each company applies the rules a little differently, so compare AISC figures as rough guides, not as exact rankings.
A fourth pair of terms matters for the reserve numbers. A mineral resource is rock that may be mined one day. A reserve, in the JORC Code’s wording, is the economically mineable part of a measured or indicated resource, after allowing for dilution and losses (JORC Code, 2012 edition). Reserves move with the gold price and the cost assumptions behind them.
Gold mine case studies compared at a glance
| Project | Where | Owner | 2025 gold output | Grade shown | Cost or reserve figure |
|---|---|---|---|---|---|
| Detour Lake | Ontario, Canada | Agnico Eagle | 692,675 oz | 0.72 g/t reserve grade | 18.6 Moz reserves (open pit) |
| Goose | Back River district, Canada | B2Gold (100%) | 53,170 oz (includes 14,554 oz pre-commercial) | 5.16 g/t mill feed | Commercial production from 2 October 2025 |
| Fekola | Mali | B2Gold 80%, State of Mali 20% | 530,769 oz | 1.84 g/t mill feed | AISC US$1,804 per oz sold |
| Mount Milligan | British Columbia, Canada | Centerra Gold | 147,581 oz plus copper | 0.38 g/t head grade | AISC US$1,194 per oz (by-product basis) |
| Pueblo Viejo | Dominican Republic | Barrick 60%, Newmont 40% | 632,000 oz (100% basis; Barrick share 379,000 oz) | 2.06 g/t reserve grade | About 20 Moz reserves (100% basis) |
Chart
2025 gold output by mine
Thousand ounces, 100% of each mine (Pueblo Viejo: Barrick owns 60%, Fekola: B2Gold 80%); Goose includes 14.6 koz pre-commercial
The grade column mixes reserve grade and mill feed grade because that is what each owner reports. Reserve grade describes the whole orebody that is planned to be mined. Mill feed grade is what actually went into the plant in 2025. Read the two as different measures.
Detour Lake, Ontario: scale beats grade
Detour Lake is Canada’s largest gold mine. In 2025 it produced 692,675 ounces while processing 76,353 tonnes per day, and at the end of 2025 its open-pit reserves stood at 18.6 million ounces in 798 million tonnes grading 0.72 g/t (Agnico Eagle fourth-quarter 2025 release). That grade is under one gram in a tonne of rock. The mine works because it moves enormous tonnage through one plant, so each tonne only has to carry a small cost.
Chart
Detour Lake production guidance
Thousand ounces of payable gold; 2025 is the actual result
The company’s own guidance shows that output does not rise in a straight line. It expects 700,000 to 730,000 ounces in 2026, then 610,000 to 640,000 in 2027 and 590,000 to 620,000 in 2028, because the mine plan passes through a lower-grade sequence. It then expects a production step-up in 2030 and about one million ounces a year in 2031, after a mill ramp-up to 79,450 tonnes per day. Underground development began in 2025 to reach higher-grade zones at depth (Agnico Eagle 2025 annual report).
What a reader can take from this: a low-grade bulk mine is sensitive to the stripping ratio (waste moved per tonne of ore) and to the mill rate. A single quarter’s grade tells less than the multi-year plan. For how large trucks and automation fit into pits like this, see our post on autonomous vehicles in mining.
Goose, Back River district: a high-grade mine in its first year
Goose is the opposite case. B2Gold owns 100% of it and it sits in the Back River Gold District, a belt of eleven claim blocks over 80 km. The mine reached commercial production on 2 October 2025 and produced 53,170 ounces in 2025, of which 14,554 ounces were pre-commercial production before 2 October, at the low end of the 50,000 to 80,000 ounce guidance range. Mill feed averaged 5.16 g/t, throughput was 0.36 million tonnes and recovery averaged 90.1%. In the fourth quarter alone it produced 38,616 ounces at 6.22 g/t, mostly from the Umwelt deposit (B2Gold full-year 2025 results).
The company also states why the year fell short of the top of the range: crushing plant capacity shortfalls in the third quarter and a temporary delay in reaching higher-grade ore from the Umwelt underground. A new mine rarely hits its design rate in the first months. When you read a ramp-up case, compare the first-year ounces with the guidance range the owner gave, and note the reasons the owner lists.
Goose is one of several Canadian projects that show where the country’s gold comes from. Canada’s mines produced 200 tonnes in 2024, a 5% rise on the year before, with gold mined in 10 provinces and territories and Ontario and Quebec together providing most of it (Natural Resources Canada, gold facts). For the geology behind the biggest camp, see our guide to the Abitibi greenstone belt.
Fekola, Mali: a mid-grade pit with a state partner
Fekola, in Mali, is owned 80% by B2Gold and 20% by the State of Mali. In 2025 the mine produced 530,769 ounces from 9.76 million tonnes of mill feed at 1.84 g/t, with recovery averaging 91.8%. Cash operating costs were US$772 per ounce produced, and AISC was US$1,804 per ounce sold, above the complex’s guidance range of US$1,670 to US$1,730 (B2Gold full-year 2025 results). The Fekola Complex passed four million ounces of gold produced since the mine began, a milestone B2Gold marked in the third quarter of 2025.
The same report gives a useful lesson on cost. B2Gold’s group AISC for 2025 was US$1,584 per ounce sold, and the company notes that a realized gold price above its budget added US$169 per ounce in royalties. Royalties and government shares rise with the price, so a higher gold price does not fall to the bottom line one for one. In its February 2026 guidance, B2Gold expected the Fekola Complex to produce 410,000 to 460,000 ounces (the company narrowed its group range to 820,000 to 920,000 ounces on 6 August 2026) at AISC of US$2,670 to US$2,820 per ounce sold, a plan built on an assumed gold price of US$5,000 per ounce, which puts royalties and production taxes at about US$910 per ounce sold.
Mount Milligan, British Columbia: gold with a copper credit
Mount Milligan is a gold-copper mine, so its gold cost looks very different from a pure gold mine. In 2025 Centerra’s mine produced 147,581 ounces of gold and 50.5 million pounds of copper from 20.7 million tonnes processed. Head grade averaged 0.38 g/t gold and 0.16% copper, and gold recovery was 60.3%. The reported gold production cost was US$1,388 per ounce, and AISC on a by-product basis was US$1,194 per ounce (Centerra Gold 2025 MD&A).
Chart
Cost and price per ounce, 2025
US$ per ounce; B2Gold group AISC and the group average realized price, Fekola mine AISC against the same group price, Mount Milligan own AISC (by-product) and price (after streaming)
By-product basis means the copper revenue is credited against the cost of the gold. That makes the gold AISC lower than it would be if all costs were charged to gold alone. The report also gives a realized gold price of US$2,608 per ounce for 2025 after the effect of the Mount Milligan streaming arrangement, a contract that sells a share of the mine’s gold at a fixed price. When you compare two mines, check whether each AISC is by-product or co-product, and whether the realized price includes a stream.
The low recovery rate (60.3% against about 90% at Goose and Fekola) shows why a single grade figure misleads. What matters is grade multiplied by recovery, along with the cost of getting the ore to the plant.
Pueblo Viejo, Dominican Republic: refractory ore and a long mine life
Pueblo Viejo is operated by Barrick, which owns 60% of the joint venture company, with Newmont holding the other 40%. Its ore is refractory, meaning the gold is locked in sulphide minerals and a plain cyanide leach would recover little. The plant treats about 14 million tonnes a year, using pressure oxidation in four autoclaves operating in parallel, followed by cyanidation. A flotation circuit added in 2023 upgrades lower-grade ore before it goes to the autoclaves (Barrick NI 43-101 technical report on Pueblo Viejo, effective 31 December 2025).
The same report shows the record so far. From 2010 to 2025, 108 million tonnes of ore at 3.7 g/t were processed at an average recovery of 87%, giving 11.5 million ounces of gold recovered. Pueblo Viejo produced 632,000 ounces in 2025 on a 100% basis, of which Barrick’s 60% share was 379,000 ounces (Barrick Q4 2025 mine statistics). Year-end 2025 reserves (100% basis, open pits and stockpiles) are 310 million tonnes at 2.06 g/t, containing about 20 million ounces of gold. The grade of the remaining ore is lower than the ore processed to date, which is common as a mine matures. The model runs through 2049 and depends on a new tailings facility, the Naranjo TSF, planned to support the extension.
Two lessons stand out. Processing route drives cost as much as grade does: autoclaves are a heavier, costlier route than a heap leach, which suits cheaper, lower-grade oxide ore (see our beginner guide to heap leaching). And storing tailings is part of the schedule, not an afterthought.

▶ How gold is mined and refined, from drilling and crushing to leaching and the final bar. · 5:27
What the five projects have in common
- Plans are tied to a multi-year mine sequence. Detour Lake publishes lower output for 2027 and 2028 and explains the grade sequence behind it.
- The first year of a new mine is a ramp-up. Goose finished its first year at the low end of guidance and named the causes.
- Costs follow the gold price through royalties. B2Gold put a number on it: US$169 per ounce.
- Grade alone does not decide the economics. The highest grade (Goose, 5.16 g/t) and the lowest (Mount Milligan, 0.38 g/t) sit in the same table, and the two mines differ in size, by-products, recovery and cost basis.
- Tailings and water are planned early. Pueblo Viejo’s mine life depends on tailings storage capacity.
Environmental and social performance is part of the case, too, but a mine’s claims on those points should be read from its own sustainability reports and permits. Our overview of ESG factors in mining covers what such reports usually contain.
Gold mine margin calculator
The calculator below turns the pattern in these reports into a simple test: ounces sold, a gold price and an AISC give a rough margin before income tax and growth spending. The cost and price fields start with round example values, not any mine’s figures.
Calculator
What margin does an ounce of gold leave?
Enter ounces sold, a price and an AISC from a company report.
- Margin per ounce (US$): $2,000
- Margin as share of price: 50.0%
- Revenue (US$ million): 400.0
Example values only, not any mine’s figures or a forecast. Price is an input: example, use today’s price (US$ per ounce). AISC follows the World Gold Council definition and is read from the company’s report. The margin excludes income tax, growth capital and any hedging or streaming.
How to read a mine report like these
- Find the production table first. Look for ounces produced and ounces sold, and check whether they are on a 100% basis or the owner’s share.
- Check the grade type. Reserve grade, resource grade, head grade and mill feed grade are different numbers.
- Check recovery. A plant that recovers 60% needs far more ore than one that recovers 90% for the same ounces.
- Read the AISC footnote. It will say whether copper or silver credits are subtracted, and whether the basis is per ounce produced or per ounce sold.
- Compare year one with guidance. The owner’s explanation of a miss is often more useful than the number.
- Check the reserve date and price assumption. Reserves are an estimate under a stated price and cost set. The Canadian-listed owners here report under NI 43-101 (CIM definitions), which are close to the JORC wording used above.
The scale of the industry puts these mines in context. World mine production of gold was estimated at about 3,300 tonnes in 2025, with China (380 tonnes), Australia (280 tonnes) and Russia (310 tonnes) among the leading producers, and the United States at 160 tonnes (USGS Mineral Commodity Summaries 2026). Industry costs have climbed too: the World Gold Council reported a global AISC of US$1,456 per ounce in the third quarter of 2024 (the latest quarter in the cited report), the highest in its series back to 2010 (World Gold Council, production costs, Q3 2024).
Where satellite data fits before a mine exists
Every project above began as an exploration target. Satellite imagery cannot see gold itself, but it maps surface clues such as iron staining, clay minerals and structures that help a team decide where to sample first. Farmonaut offers satellite-based screening of a licence area as an early exploration step; its results are targets, not a resource estimate or reserve.

▶ How satellites help find gold: they map the rock and structures around a deposit, not the metal itself. · 4:25
Frequently asked questions
What is a gold mine case study?
It is a worked example of one mine or project that sets out the ore, the method, the output and the cost, so another team can compare its own project against it. Good ones use the owner’s filed reports rather than press summaries.
Which gold mine is the largest in Canada?
Detour Lake in Ontario, which Agnico Eagle describes as Canada’s largest gold mine, produced 692,675 ounces in 2025.
What is a good gold grade for an open-pit mine?
There is no single number. Detour Lake’s reserves average 0.72 g/t and the mine runs at large scale, while underground mines such as Goose process ore above 5 g/t. Grade has to be read with recovery, mining method and cost.
What does AISC mean in gold mining?
All-in sustaining cost is the World Gold Council’s non-GAAP measure of the cost to produce and sell an ounce, including sustaining capital, royalties and corporate costs, and excluding income tax and growth projects.
Why is Mount Milligan’s AISC lower than its production cost?
Centerra reports AISC on a by-product basis, so copper revenue is credited against gold costs. Its 2025 gold production cost was US$1,388 per ounce and AISC was US$1,194.
What is refractory gold ore?
It is ore where the gold is locked inside sulphide minerals, so it needs pre-treatment such as pressure oxidation before cyanide can dissolve it. Pueblo Viejo uses four autoclaves for this step.
Why did Goose produce less than its top guidance?
B2Gold cites crushing plant capacity shortfalls in the third quarter and a temporary delay in reaching higher-grade ore at the Umwelt underground.
How long will Pueblo Viejo keep operating?
The technical report models mine life through 2049, and it ties the extension to a new tailings facility.
Can a small licence holder learn from these mines?
Yes, on method: check grade type, recovery, cost basis and reserve date in any report you read. The scale and capital are different, so use these mines to learn what to measure, not what to expect.
Where do the figures on this page come from?
Each figure comes from the owner’s own 2025 filing named beside it, plus the USGS, Natural Resources Canada and World Gold Council for context. Check the original report before you rely on a number.
This page is for information only. It is not investment advice.
Farmonaut mining
Map your mining site from space
Send a licence boundary and get satellite-based exploration targets, as targets ahead of any resource estimate.

Mining Pro sample view, synthetic data
Keep reading
Sources
- Agnico Eagle, fourth-quarter and full-year 2025 results release (2026): s205.q4cdn.com
- Agnico Eagle, 2025 annual report: s205.q4cdn.com
- B2Gold, Q4 and full-year 2025 results and 2026 guidance (2026): finanznachrichten.de
- Centerra Gold, MD&A for the year ended 31 December 2025 (2026): s205.q4cdn.com
- Barrick, NI 43-101 technical report on the Pueblo Viejo mine (27 February 2026): s25.q4cdn.com
- World Gold Council, guidance note on non-GAAP metrics: AISC and AIC: gold.org
- World Gold Council, production costs Q3 2024: gold.org
- JORC Code, 2012 edition: jorc.org
- Natural Resources Canada, gold facts: natural-resources.canada.ca
- USGS, Mineral Commodity Summaries 2026: gold: pubs.usgs.gov
- Barrick, Q4 2025 mine statistics (2026): s25.q4cdn.com
Discussion
Questions, corrections or field experience? Share them below. First-time comments are reviewed before they appear, and your email is never published.
No comments yet. Be the first to add a question or your experience.

 Almosi SARL
 SRK Consulting
 Berks Gold Limited
 Mwerezi Minerals Company Limited
 Mining SARL
 SenGold Invest SAS
 Sean Mining Limited
 NTS Group (Pty) Ltd
 Mine4Africa
 Lithspo Minerals Limited
 Tintina Mining Group
 Dalgety Minerals Pty Ltd
 Vortex Minerals Pty Ltd
 Faith At Work (Pty) Ltd
 Geotech Mining Solutions plc

 Licence holder · Nigeria · Gold + lithium










