

Reviewed September 2026 against USDA’s Economic Research Service, USDA Agricultural Research Service, and the Association of Equipment Manufacturers (AEM).
Try it: Run your own numbers →
27% of all US farms had adopted at least one precision agriculture tool as of the USDA’s 2023 Technology Use Report. That number jumps sharply with farm size: 70% of large-scale crop farms run guidance autosteering, and 68% use yield monitors or soil maps. Precision agriculture technologies aren’t a future promise — they’re already the operating standard on the majority of large US row-crop acreage, and the gap between large and small operations is the real story this article answers.
- Introduction: What Counts as Precision Farming
- Who Is Using Precision Agriculture Technologies
- Comparative Table: Innovative Agricultural Technologies
- The Economics: What Precision Ag Actually Saves
- 1. Precision Agriculture
- 2. Controlled Environment Agriculture (CEA) & Vertical Farming Solutions
- 3. Agrivoltaics
- 4. Aeroponics
- 5. Cellular Agriculture
- 6. AI in Agriculture & Machine Learning
- 7. Robotics in Modern Farming
- 8. Blockchain in Agriculture
- 9. Nanotechnology in Agriculture
- 10. CRISPR Gene Editing
- Smart Irrigation Systems
- Bee Vectoring Technologies (BVT)
- Calculator: Estimate Your Precision Ag Payback
- Building a Precision-Ag-Ready Agriculture Business
- Farmonaut: Accelerating Precision Farming
- Farmonaut Subscription Plans
- FAQ
- Conclusion
Introduction: What Counts as Precision Farming Technologies
“Precision farming technologies” refers to a specific, defined toolkit: GPS-guided autosteering, yield monitors and yield maps, variable-rate input applicators, soil sampling grids, and — increasingly — satellite and drone-based crop monitoring layered with AI advisory. It is not a marketing umbrella for “anything digital in agriculture.” That distinction matters because it’s the difference between a technology that has a measurable adoption rate you can check against USDA data, and a buzzword that doesn’t.
The World Ag Expo held annually in California’s Central Valley is where a large share of this equipment gets its first commercial showing to US growers each cycle — autosteer retrofits, variable-rate controllers, and satellite-linked farm management platforms like Farmonaut all show up on that floor. This guide covers the ten technology categories reshaping farming, forestry, and crop production, with adoption figures, cost data, and a durable framework for checking whether a given tool is worth adopting on your own acreage — this year, and in whichever year you’re reading it.
Who Is Using Precision Agriculture Technologies
The honest answer, per USDA’s Economic Research Service 2023 data, is: mostly large operations, and unevenly across tool types. Adoption is not a single number — it splits by farm size and by which piece of the toolkit you mean:
- Large-scale crop farms: 70% use guidance autosteering systems; 68% use yield monitors, yield maps, or soil maps; 45% use variable-rate technology; only 12% use drones for agriculture.
- Midsize farms: 52% use guidance autosteering systems — well behind large operations but still a majority.
- All US farms combined: 27% report using at least one precision agriculture tool, a figure pulled down by the large number of small farms that haven’t adopted any of these tools yet.
That drone figure is worth pausing on: at just 12% adoption among large farms, aerial imagery is the least-adopted precision tool USDA tracks, trailing guidance systems and yield mapping by a wide margin. If you’ve seen drones framed as the face of precision agriculture, the USDA numbers say otherwise — autosteer and yield mapping are the tools that actually reached majority adoption first, and satellite-based monitoring (rather than owned drone hardware) is increasingly filling the imagery gap for operations that skipped drones. Source and full breakdown: USDA ERS Charts of Note, Technology Use Report.
How to get a fresher number than this one: USDA ERS Charts of Note refreshes quarterly. Check ers.usda.gov/data-products/charts-of-note for the current release, or query USDA NASS QuickStats directly and search “precision” to filter adoption data by state and technology type.
Comparative Table: Innovative Agricultural Technologies
| Technology Name | Primary Function/Benefit | US Adoption Data Point | Environmental Impact |
|---|---|---|---|
| Precision Agriculture (GPS, VRT, yield mapping) | Data-driven input decisions | 27% of all US farms; 70% of large farms (autosteer) | 8% less fertilizer, 9% less herbicide (AEM, 2024) |
| Controlled Environment Agriculture (CEA) | Stable, year-round crop production | Not separately tracked by USDA; check NASS QuickStats | Reduces water use, limits pesticides |
| Agrivoltaics | Combines solar energy and farming | Emerging; no USDA national adoption series yet | Renewable energy plus reduced evaporation |
| Aeroponics | Soilless, high-density plant growth | Not separately tracked by USDA | Minimal water use, less land required |
| Cellular Agriculture | Lab-grown food products, animal alternatives | Pre-commercial scale in the US | Lowers emissions, reduces land use |
| AI & ML in Agriculture | Predictive analytics, yield forecasting | Embedded within the 27% precision-ag figure above | Optimizes resource use, reduces waste |
| Robotics | Automates planting, harvesting, weeding | Not separately tracked by USDA | Reduces labor, limits input overuse |
| Blockchain Technology | Traceability and transparency | Not separately tracked by USDA | Reduces fraud, ensures food safety |
| Nanotechnology | Nutrient delivery, early disease detection | Not separately tracked by USDA | Reduces chemical usage |
| CRISPR Gene Editing | Enhances crop traits, resilience | Not separately tracked by USDA | Climate and pest resistance by design |
Where USDA doesn’t publish a national adoption series for a category — CEA, agrivoltaics, robotics, blockchain, nanotech, and CRISPR — say so plainly rather than guessing: check USDA NASS QuickStats first, since it’s updated quarterly and occasionally adds new technology categories.

The Economics: What Precision Ag Actually Saves
USDA’s Agricultural Research Service puts a dollar figure on this rather than leaving it as a vague efficiency claim: precision agriculture generates roughly $118,000 in annual economic value per 1,000 acres of row crops, drawn from combined input savings and yield capture. That’s not marketing math — it’s ARS’s own accounting of overlap reduction, input targeting, and GPS-guided pass efficiency. Full methodology: USDA ARS, Benefits and Evolution of Precision Agriculture.
The input-reduction side, independently measured by the Association of Equipment Manufacturers in 2024: an 8% reduction in fertilizer use and a 9% reduction in herbicide use attributable directly to precision agriculture technologies. Water is the third lever — a 5% reduction in water use translates to roughly $16,000 in annual savings per 1,000 acres, per USDA ARS. Source: AEM, Study Quantifies the Benefits of Precision Agriculture.
GPS guidance itself is the mechanical foundation underneath all three savings categories: modern RTK-corrected GPS holds accuracy within 1 centimeter for planting, spraying, and fertilizer application passes, per USDA ARS. On small farms specifically, tractor guidance systems alone improve field-operation efficiency by 20% — a number worth citing precisely because it isolates guidance from the rest of the precision stack, showing the payback doesn’t require the full sensor suite to start.
Market size backs up that this is a growing, not saturating, category: the US precision agriculture market was valued at $7.5 billion in 2024, projected to reach $13.5 billion by 2032 — a compound annual growth rate of 7.8% for 2025–2032. Source: MarketsandMarkets, US Precision Farming Market. For a current figure, market research firms including MarketsandMarkets, IMARC, and Grand View Research republish US precision agriculture forecasts annually — check their latest report before quoting the 2024 baseline as current.
1. Precision Agriculture: Data-Driven Decisions Transforming Yields
Precision agriculture is the toolkit at the center of every figure above: GPS, IoT sensors, remote sensing, and actionable data analytics combined to monitor and manage field variability in real time.
How does it work? By integrating sensor data on soil moisture, nutrient levels, crop health, and weather with geospatial mapping, farmers can:
- Deliver targeted irrigation and fertilization, cutting fertilizer use by 8% and herbicide use by 9% (AEM, 2024)
- Capture roughly $118,000 in annual economic value per 1,000 acres of row crops (USDA ARS, 2024)
- Hold GPS-guided passes to within 1 centimeter of accuracy for planting, spraying, and fertilizer application
- Reduce water use by 5%, worth about $16,000 annually per 1,000 acres
Platforms like Farmonaut extend this toolkit to farms below the “large-scale” threshold where USDA’s adoption numbers concentrate, making the same data layer accessible without owned sensor hardware:
- Farmonaut’s Crop Health Monitoring—Monitor crop health using multispectral satellite images (NDVI) for nutrient and moisture optimization, weed and pest detection, and yield projection.
- Farmonaut API—Integrate satellite and weather data into custom tools for seamless, automated farm management.
- API Developer Docs—For agritech and research teams building next-gen solutions.
By optimizing inputs and labor, precision agriculture delivers sustainable productivity gains without requiring a farm to buy every sensor category at once.
2. Controlled Environment Agriculture (CEA) & Vertical Farming Solutions
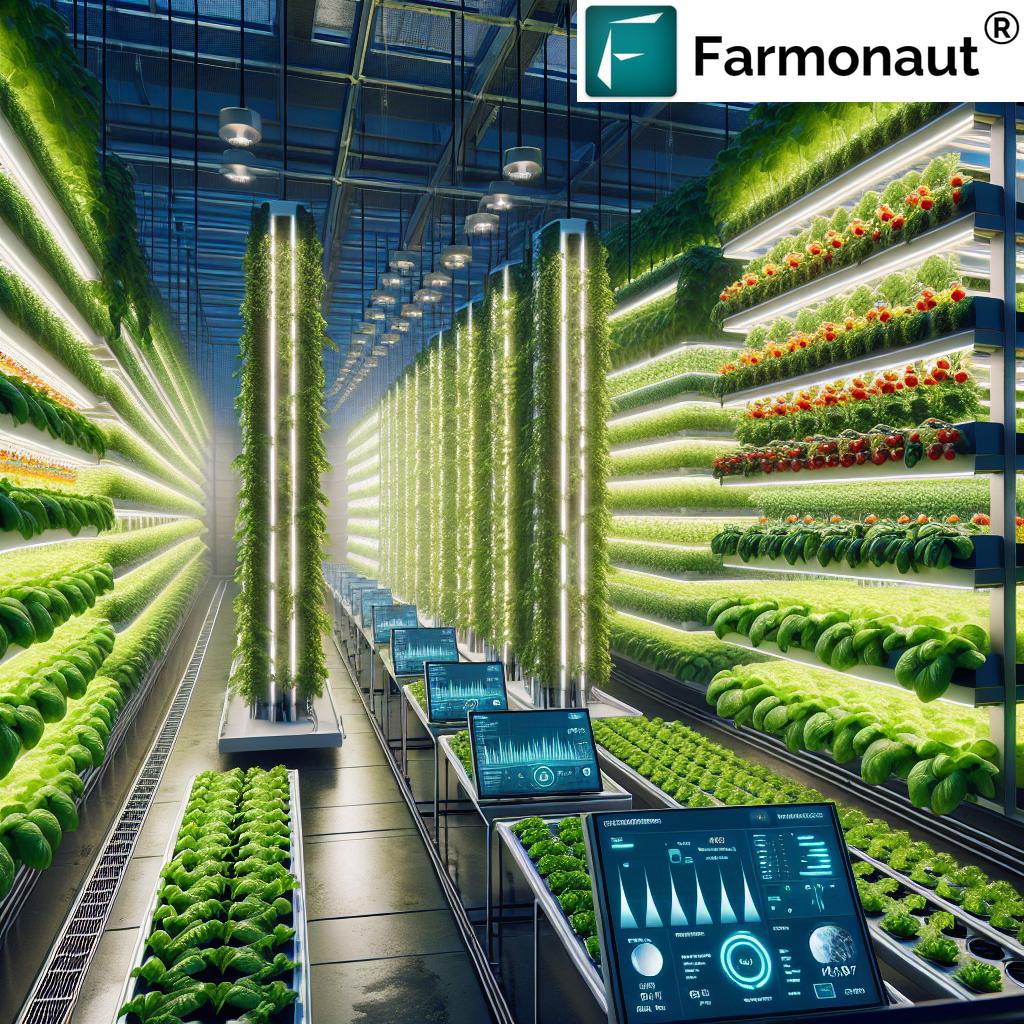
Controlled Environment Agriculture (CEA) cultivates crops in regulated environments—from greenhouses to climate-controlled vertical farming towers. By managing light, humidity, temperature, and CO2 levels, growers create stable conditions and year-round harvests independent of outdoor weather.
Vertical farming solutions stack layers of crops in compact indoor facilities, maximizing output in urban areas where land is limited. USDA does not publish a national CEA adoption rate the way it tracks autosteer or yield mapping, so treat any specific water-reduction or yield percentage for CEA as facility-specific rather than a US-wide average — get that number directly from the greenhouse or vertical farm operator you’re evaluating.
With advancements in hydroponics and aeroponics, urban agriculture can operate in areas facing water stress and soil depletion. If you manage large-scale farming across distributed sites, Farmonaut’s Large-Scale Farm Management Platform streamlines monitoring and efficiencies across landholdings, whether they’re CEA facilities or open-field acreage.
3. Agrivoltaics: Harnessing Solar Power & Growing Crops Together
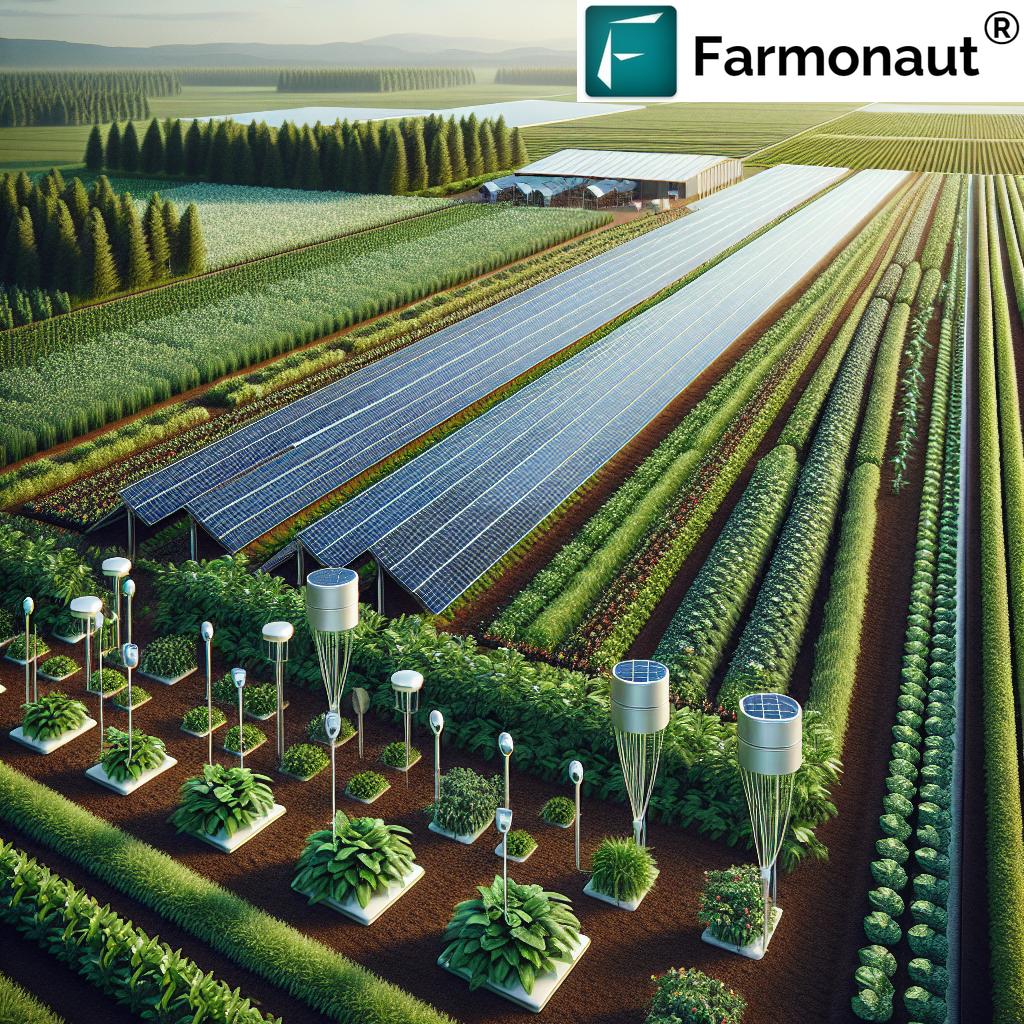
Agrivoltaics—co-locating solar panels with agriculture—lets a single parcel of land generate renewable energy and crop yield simultaneously. This is one of the newest categories in the comparative table above, and it’s also the one with the thinnest national data trail: no USDA-published adoption rate exists yet for agrivoltaics specifically, unlike the guidance-autosteer and yield-mapping figures cited earlier.
The mechanism, independent of adoption-rate data, is well documented at the field trial level:
- Reduced soil moisture evaporation—shaded crops lose less water, requiring less irrigation.
- Shielding plants from extreme temperatures, improving resilience.
- Generation of clean energy for farm operations or grid sale, creating a new revenue line.
Crops such as lettuce, tomatoes, and strawberries have shown tolerance for partial shade from elevated panel arrays in field trials. If you’re evaluating an agrivoltaics installation, ask the developer for site-specific yield and shading data rather than a national average — none exists yet.
4. Aeroponics: Next-Level Soilless Cultivation
Aeroponics anchors plants in support structures while roots hang exposed to air, misted on a cycle with precision nutrient solutions.
Key characteristics for urban farming and high-density production:
- Substantially lower water usage than soil-based farming, since misting cycles target only the root zone.
- Faster growth cycles for leafy greens, herbs, and specialty crops in controlled trials.
- Deployable in urban centers, basements, or areas with depleted or contaminated soils.
- Supports vertical stacking, increasing yield per square meter of floor space.
As with CEA broadly, USDA does not publish a national aeroponics adoption percentage — treat operator-specific water-savings claims as facility data, and verify them against the grower’s own metering before using them in a business case.
5. Cellular Agriculture: Cultured Foods & a Sustainable Future
Cellular agriculture uses biotechnology to grow lab-grown food products from animal and plant cell cultures—cultivated meat, milk, and eggs. It remains pre-commercial at national scale in the US, with production still concentrated in pilot facilities rather than broad retail distribution. The stated goals are to:
- Reduce greenhouse gas emissions, water, and land usage versus conventional livestock
- Address animal welfare considerations
- Deliver customizable protein products
Because this category has no USDA adoption-rate series comparable to the autosteer or yield-mapping figures cited above, treat any specific emissions or land-use percentage you see quoted elsewhere as a single-study estimate, not a national baseline — check the study’s own methodology before citing it.
6. AI in Agriculture & Machine Learning Revolution
AI and machine learning sit inside the precision-agriculture adoption figures already cited — USDA doesn’t track “AI adoption” as a separate line item, but the yield forecasting, disease detection, and variable-rate recommendation engines behind the 27%/70%/45% figures above are increasingly AI-driven rather than rule-based.
Smart platforms analyze satellite imagery, field sensors, and historical records to enable:
- Automated yield forecasting and risk management
- Early pest, disease, and nutrient deficiency detection via image analysis
- Precise recommendations for irrigation, fertilization, and harvesting timing
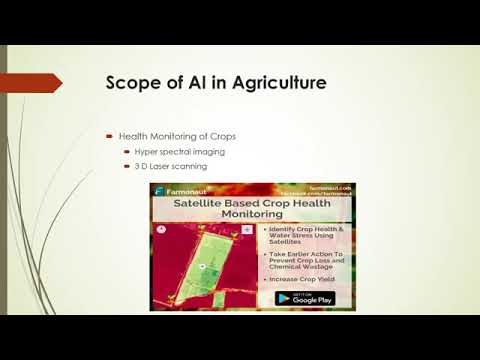
Farmonaut runs this through its Jeevn AI Advisory System—delivering real-time, localized advice for input and resource decisions.
Access AI-driven insights directly on mobile and web platforms:
7. Robotics in Modern Farming: Automation for Greater Efficiency
Robotics and autonomous systems are reshaping agriculture, forestry, and food production. With computer vision and guidance, robots handle:
- Planting seeds with precise spacing
- Weeding and targeted pest control, reducing chemical volume applied
- Fruit & vegetable harvesting with reduced crop damage
- Sorting and packaging for faster market delivery
USDA’s Technology Use Report tracks autosteer, yield mapping, variable-rate tech, and drones specifically — it does not report a separate national adoption rate for harvesting or weeding robots, so treat vendor-supplied ROI claims for robotic equipment as case-specific until a comparable USDA series exists.
For large-scale operations, dedicated Fleet Management Tools help agribusinesses track equipment usage, reduce fuel waste, and monitor field operations.
8. Blockchain in Agriculture: Transparency & Traceability in Food Chains
Blockchain technology in agriculture records food authenticity, safety, and transparency across supply chains, logging every stage—planting, harvesting, processing, transport, retail—in an immutable ledger:
- Full product origin and journey transparency
- Protection against food fraud and tampering
- Stronger consumer trust in food safety and quality
For corporate supply chain managers, Farmonaut’s Blockchain-Based Traceability Solution offers implementation, real-time tracking, and secure data integration.
9. Nanotechnology in Agriculture: Enhanced Crop Protection
Nanoparticles and nanosensors extend crop management and plant protection:
- Controlled-release fertilizers and pesticides, reducing chemical runoff
- Early plant disease detection via nanoscale sensors, enabling timely intervention
- Enhanced nutrient absorption and efficacy
This category remains largely in research and early-commercial stages in US row-crop agriculture; there is no USDA adoption-rate series for it yet, comparable to the autosteer or VRT figures cited earlier.
10. CRISPR Gene Editing: Customizing Crops for Resilience
CRISPR gene editing accelerates crop trait development:
- Enhanced drought tolerance and pest resistance
- Increased nutritional value (vitamins, amino acids)
- Faster breeding of varieties matched to regional growing conditions
By editing DNA at targeted sites, CRISPR enables trait changes that traditional breeding would take far longer to achieve. As with several categories above, no USDA national adoption figure exists for CRISPR-edited crop acreage specifically — the published data concentrates on autosteer, yield mapping, VRT, and drones.
Smart Irrigation Systems: Precision Water Use for Sustainable Farming
Smart irrigation systems use in-field sensors and weather data to deliver water precisely when and where it’s needed.
The measured advantages:
- Soil sensors monitor moisture levels in real time for data-driven scheduling.
- Irrigation adapts automatically to rainfall, evaporation rate, and crop growth stage.
- Precision agriculture broadly reduces water use by 5%, saving roughly $16,000 per 1,000 acres annually (USDA ARS, 2024).
- Deficit irrigation — deliberately under-watering at specific growth stages — can cut water use by up to 40% without a significant yield loss, per USDA ARS field research.
Farmonaut’s Carbon Footprinting Solution helps agribusinesses monitor water use and emissions against sustainability targets and compliance reporting requirements.
Bee Vectoring Technologies (BVT): Nature-Based Crop Protection Agents
Bee Vectoring Technologies (BVT) use the natural foraging behavior of bees to deliver biological crop protection agents directly to flowers, precisely where needed.
This method supports both environmental and productive outcomes:
- Reduces chemical pesticide usage, cutting residues and runoff affecting pollinators
- Improves pollination consistency and crop yield stability
- Enables targeted application without broadcast spraying
BVT is deployed commercially across parts of Canada and the US, offering an alternative delivery mechanism to foliar spraying for growers seeking reduced chemical inputs.
Calculator: Estimate Your Precision Ag Payback
Use the figures cited above — USDA ARS’s $118,000 per 1,000 acres and AEM’s 8%/9% input reductions — to estimate what precision agriculture adoption could be worth on your own acreage.
Run your own numbers
Assumptions: the $118,000/1,000-acre figure and 5% water-use reduction are USDA ARS's own national averages for row crops (2024), not a guarantee for any specific farm; the 8–9% input reduction range is AEM's 2024 measured average across fertilizer and herbicide. This calculator excludes financing costs, equipment depreciation, and labor retraining time — build those into your own budget separately.
Building a Precision-Ag-Ready Agriculture Business
For anyone evaluating what "best agriculture business" practice looks like today, the USDA data above gives a concrete checklist rather than a vague aspiration. A durable framework you can re-run every year, regardless of which numbers have changed by the time you read this:
- Check your farm-size bracket against USDA's adoption curve. If you're near or above the "large farm" threshold USDA uses in its Technology Use Report, autosteer and yield mapping are now majority practice among your peers — lagging adoption is a competitive gap, not just a missed convenience.
- Start with guidance, not the full stack. The 20% efficiency gain from tractor guidance on small farms is isolated from variable-rate and yield-mapping costs — it's the cheapest entry point with a documented return.
- Price input reduction, not just yield gain. AEM's 8% fertilizer and 9% herbicide reduction figures apply before any yield benefit is counted — run those against your own input invoices using the calculator above.
- Re-check USDA NASS QuickStats and ERS Charts of Note before budgeting. Both refresh on a predictable cycle — QuickStats quarterly, Charts of Note quarterly — so a number more than a year old should be re-pulled before it drives a capital decision.
- Treat categories without a USDA adoption series (agrivoltaics, CRISPR, robotics, blockchain, nanotech) as vendor-verified, not nationally benchmarked until a comparable federal data series exists.
Farmonaut: Accelerating Precision Farming for Every Farm Size
Given that USDA's own data shows adoption concentrated at the large-farm end — 70% autosteer adoption among large farms versus 27% across all US farms — the gap that matters most is closing that access curve for midsize and smaller operations. Farmonaut works toward that with accessible, data-driven solutions for farmers, agribusinesses, governments, and corporate supply chains:
Key Farmonaut Technology Solutions:
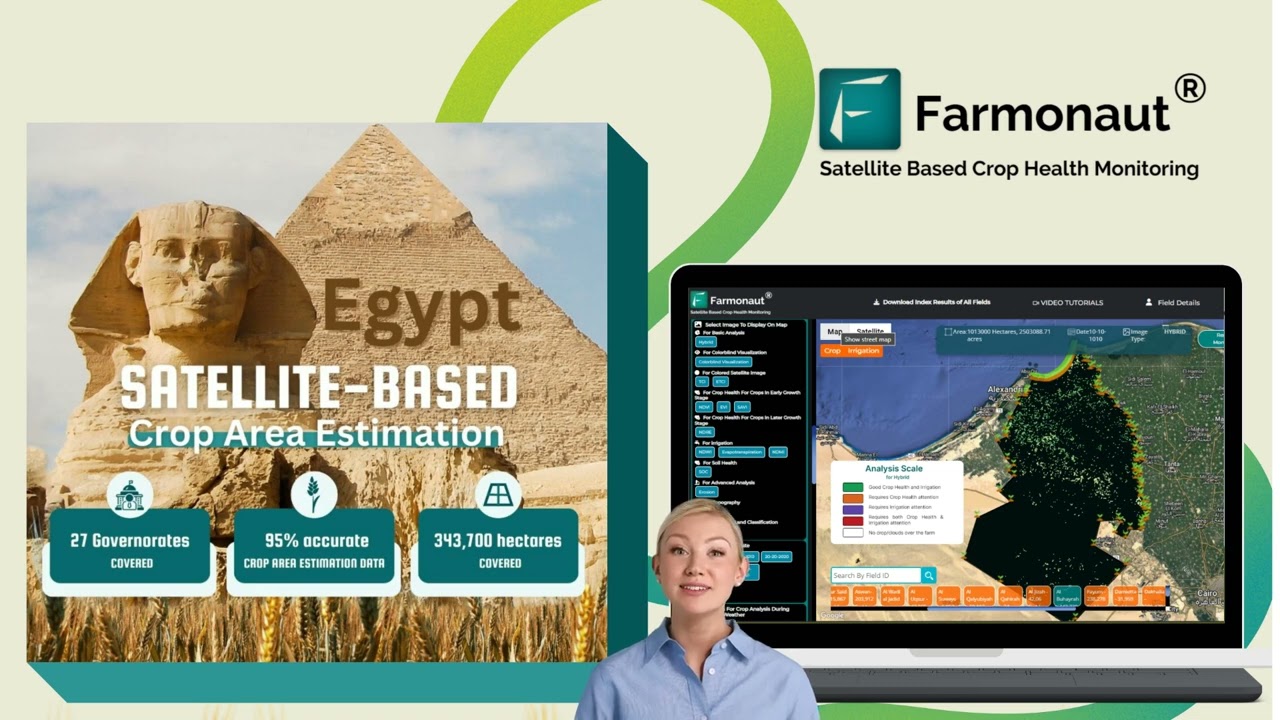
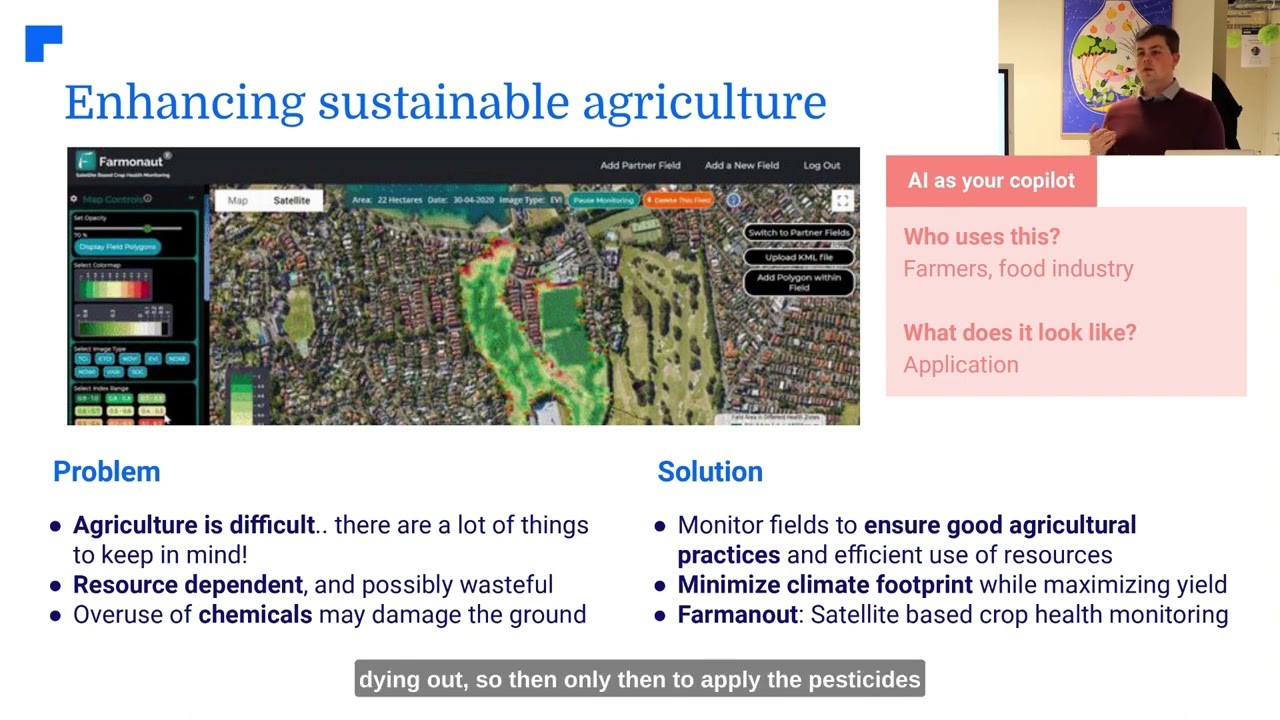
- Satellite-Based Crop Health Monitoring: Multi-spectral imagery for real-time crop growth, health, and soil moisture analysis—enabling targeted irrigation, fertilization, and pest management without owned drone hardware.
- Jeevn AI Advisory System: Personalized, AI-driven recommendations on crop health, weather forecasting, and farm management.
- Blockchain-Based Traceability: Transparent, secure tracking of agricultural products from field to consumer.
- Resource & Fleet Management: Tools for plantation management, logistics optimization, and asset tracking. Explore fleet capabilities here.
- Carbon Footprinting: Insights into emissions and resource consumption to support sustainability reporting.
With an Android app, iOS app, and web platform, Farmonaut delivers precision agriculture and field analytics without requiring the equipment capital that concentrates USDA's adoption figures at the large-farm end.
Explore advisory, research, supply-chain transparency—or accelerated loan and insurance verification for financiers—on our Farmonaut crop, plantation, and forest advisory platform.
Farmonaut Subscription Plans
Our flexible subscription model makes precision agriculture affordable and accessible—scalable for small farmers, cooperatives, agribusinesses, and institutions. Monitor your fields via the web, API integration, or mobile apps.
FAQ: Precision Farming Technologies
Who is using precision farming technologies?
Per USDA's 2023 Technology Use Report, 27% of all US farms use at least one precision agriculture tool. Adoption is far higher among large-scale crop farms: 70% use guidance autosteering, 68% use yield monitors or soil maps, and 45% use variable-rate technology. Midsize farms report 52% autosteer adoption. Drones remain the least-adopted tool at just 12% among large farms.
What are precision farming technologies?
The defined toolkit includes GPS-guided autosteering, yield monitors and yield maps, variable-rate input applicators, soil sampling systems, and satellite or drone-based crop monitoring — the specific categories USDA's Economic Research Service tracks in its Technology Use Report.
What is the economic value of precision agriculture?
USDA's Agricultural Research Service estimates roughly $118,000 in annual economic value per 1,000 acres of row crops from precision agriculture. Separately, AEM's 2024 study measured an 8% reduction in fertilizer use and a 9% reduction in herbicide use directly attributable to these tools.
How much water does precision agriculture save?
USDA ARS reports a 5% reduction in water use from precision agriculture broadly, worth about $16,000 annually per 1,000 acres. Deficit irrigation — a targeted technique within smart irrigation — can cut water use by up to 40% without significant yield loss.
How big is the US precision agriculture market?
The US precision agriculture market was valued at $7.5 billion in 2024, projected to reach $13.5 billion by 2032 at a 7.8% compound annual growth rate for 2025–2032, per MarketsandMarkets. Check their current-year report for an updated figure.
How does Farmonaut support precision agriculture adoption?
Farmonaut provides satellite-based crop health monitoring, an AI advisory system, blockchain traceability, fleet management, and carbon footprinting — accessible via web, API, and mobile apps without requiring owned sensor or drone hardware.



Conclusion: Where Precision Farming Technologies Stand Today
The data settles a question that vague "future of farming" framing usually dodges: precision agriculture technologies are already majority practice on large US farms — 70% autosteer, 68% yield mapping — and a clear minority practice everywhere else, at 27% across all US farms combined. That gap, not some frontier still to come, is the actual state of adoption. It's also the durable way to read any future update to these figures: check whether the all-farm number is closing on the large-farm number, or whether the split is widening.
For the categories still short a national USDA data series — agrivoltaics, CRISPR, robotics, blockchain, nanotechnology, cellular agriculture — the honest position isn't to invent an adoption percentage. It's to watch USDA NASS QuickStats and ERS Charts of Note for when (or if) those categories get their own tracked line item, and to treat vendor claims as case studies until they do.
Tools like Farmonaut extend the same satellite-data and AI-advisory layer that underpins the large-farm adoption figures to operations below that threshold — bringing precision, real-time data, and transparency to fields regardless of where they sit on USDA's size bracket.

 Farmitopia
 TVS Electronics
 BW Pipelines
 WICO
WICO Gen Chayat
 Chimera Innovation
 SkyHarvest
 Polaris Digitech
 Teledarbas
 Wild Oak Farm
 SFX
SFX BACF Africa
 Doodlakine
 Exurbia Geospatial
 FieldZero
 Indico Company
