

IoT Based Smart Agriculture Monitoring System Guide
Reviewed August 2026 against USDA Economic Research Service and Market.us IoT market research.
Try it: Run your own numbers →
A smart agriculture monitoring system is a network of field sensors, wireless connectivity, and cloud analytics that reports soil, weather, and crop conditions in real time so growers can act before a problem costs yield. In the United States, 52% of midsize crop farms and 70% of large-scale crop farms already run guidance autosteering — a core building block of these systems — according to the USDA Economic Research Service’s 2023 review of precision agriculture adoption. This guide covers what an iot based agriculture monitoring system actually contains, what it costs, what it saves, and how to size one for your own acreage.
Table of Contents
- What Is a Smart Agriculture Monitoring System?
- US Adoption Data: Who Is Actually Using This
- Key Components of an IoT Based Agriculture Monitoring System
- How IoT Based Smart Agriculture Monitoring Systems Work
- Costs, Savings, and ROI: The Numbers That Matter
- Irrigation Savings Calculator
- Managed IoT Agriculture Services vs. DIY Sensor Networks
- Feature-Impact Comparison Table
- Applications: Farm Monitoring in Practice
- Farmonaut: Satellite-Based Agriculture Monitoring
- Challenges in Implementing IoT Agriculture Sensors
- Future Trends for Smart Agriculture Monitoring
- Frequently Asked Questions
- Conclusion
- Try it: Run your own numbers

What Is a Smart Agriculture Monitoring System?
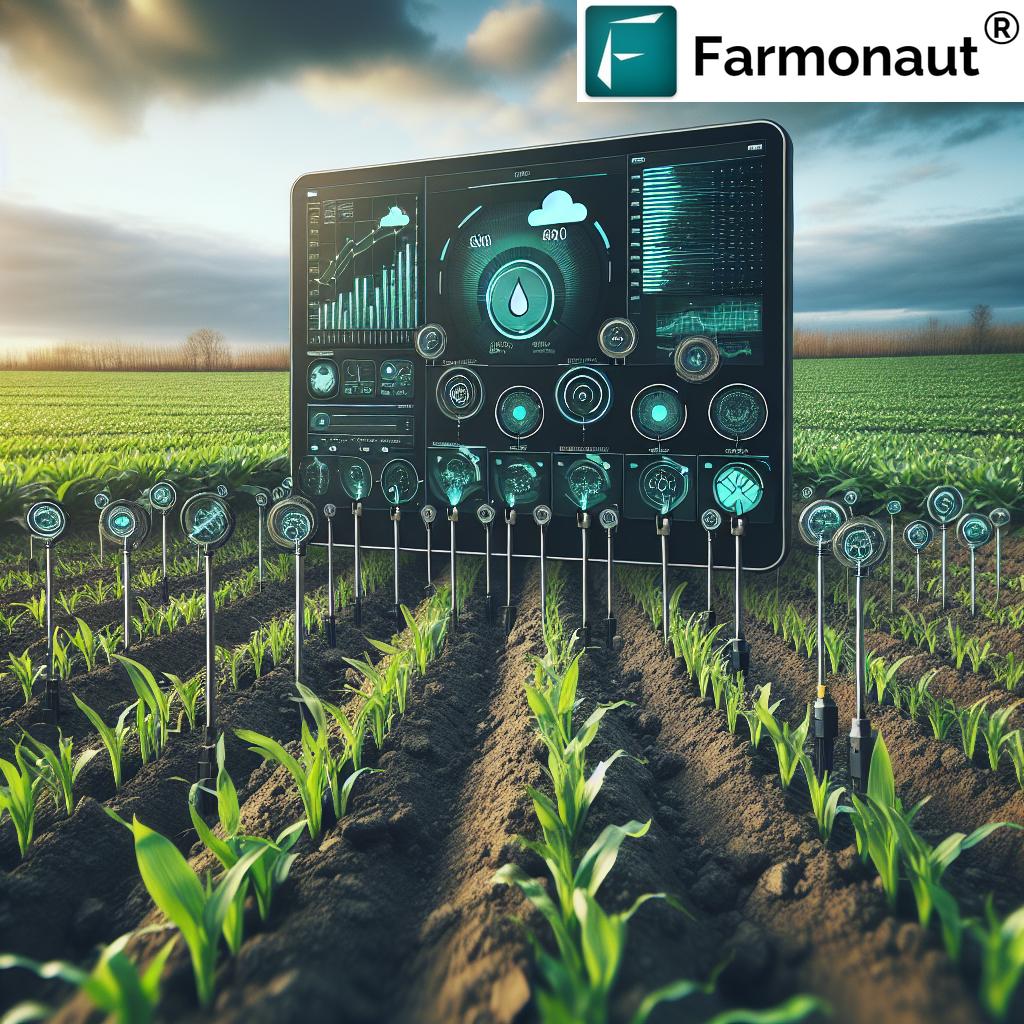
An iot based smart agriculture monitoring system combines three layers: sensing (soil, weather, crop-health hardware or satellite imagery), transmission (LoRaWAN, NB-IoT, 4G/5G, or satellite uplink), and analytics (cloud dashboards that turn raw readings into irrigation, fertilization, and pest-control decisions). The category also covers agriculture monitoring systems that skip ground hardware entirely and rely on satellite and weather-model data instead — a distinction that matters once you compare costs below.
The market for this technology is sizeable and growing quickly. The US IoT precision agriculture market was valued at $2.36 billion as of the most recent Market.us report, with a projected compound annual growth rate of 17.8% through 2029 — see Market.us’s IoT in Precision Agriculture Market report for the full breakdown. That growth is not evenly distributed: it concentrates on farms large enough to amortize sensor and connectivity costs across many acres, which is why adoption data by farm size (next section) matters more than aggregate market figures.



US Adoption Data: Who Is Actually Using This
Adoption of precision agriculture technology in the US correlates directly with farm size, per the USDA Economic Research Service’s 2023 publication on precision agriculture (USDA ERS, Precision Agriculture in the United States). Guidance autosteering — GPS-guided equipment that is often the first IoT-adjacent system a farm installs — is used on 52% of midsize crop farms and 70% of large-scale crop farms. Separately, 68% of large US farms report using yield monitors, yield maps, or soil maps to guide input decisions.
That gap between midsize and large-farm adoption is the single most useful fact for benchmarking your own operation: if you farm at large-farm scale and have not adopted guidance autosteering or yield mapping, you are behind roughly seven in ten of your scale peers. If you farm at midsize scale, you are roughly at the midpoint of your peer group either way. The USDA updates these figures through its Agricultural Resource Management Survey (ARMS), with the full Census of Agriculture refreshed every five years and select metrics updated annually — check ers.usda.gov directly under the Agricultural Census and ARMS survey section for the current numbers.
Federal support for this adoption curve is also documented. The USDA’s eConnectivity initiative directs roughly $2.0 billion per year toward rural broadband investment that underpins smart-farming connectivity, and the Environmental Quality Incentives Program (EQIP) covers up to 75% of costs for qualifying precision agriculture technology as of the USDA ERS 2023 review. Both figures come from the same USDA ERS source cited above; check the current EQIP program page on ers.usda.gov for the sign-up window and cost-share percentage in effect when you apply, since program terms are set annually.
Key Components of an IoT Based Agriculture Monitoring System
The backbone of every iot based agriculture monitoring system consists of a well-orchestrated set of sensors, devices, connectivity solutions, and cloud-based analytics. Here are the critical elements that enable growers to monitor, assess, and optimize farming practices for higher yields and lower input costs.
-
Sensors and Connectivity:
- Soil Moisture Sensors: These IoT-enabled devices continuously monitor soil hydration at multiple depths, enabling irrigation scheduling that responds to actual root-zone conditions rather than a fixed calendar.
- Weather Sensors: On-farm weather stations record temperature, humidity, rainfall, and wind, feeding climate-adaptation decisions for planting, harvesting, and spray timing.
- Soil Nutrient Sensors: These evaluate nitrogen, phosphorus, and potassium levels so fertilizer goes only where it is needed.
Readings transmit over wireless networks (WiFi, LoRaWAN, NB-IoT, 4G/5G) to centralized platforms for real-time analysis.
(source) -
Data Analytics and Cloud Integration:
- Sensor data is processed via cloud platforms using AI/ML-based analytics to produce predictive insights, trend analysis, and dashboards such as Farmonaut’s Jeevn AI advisory.
- Growers use these insights to schedule irrigation, fertilizer, and pest-control interventions before stress shows up visually in the crop.
(source)
-
Automated Systems:
- Smart Irrigation: Automated systems adjust water delivery based on soil moisture readings, cutting waste versus fixed-schedule irrigation.
- Climate Control in Greenhouses: IoT systems automatically adjust temperature, humidity, and light for optimal growing conditions.
- Automated Farm Equipment: Drones, autonomous planters, and harvesters are monitored and managed remotely, raising labor efficiency and placement accuracy.
(source)
(source)

How IoT Based Smart Agriculture Monitoring Systems Work
An iot based smart agriculture monitoring system operates as an integrated cycle of sensing, connectivity, analytics, and action:
- Deployment of Sensors: Install moisture, temperature, climate, and nutrient sensors across the farm, or provision satellite coverage where ground hardware isn’t cost-effective.
- Data Transmission: Sensor data transmits wirelessly to cloud servers using LoRaWAN, NB-IoT, or cellular protocols. Reliable transmission in remote rural areas is the most common point of failure — verify signal coverage before buying hardware, not after.
- Cloud-Based Data Analytics: Collected farm data is processed, analyzed, and visualized via machine learning models. Platforms like Farmonaut provide dashboards for same-day decisions.
- Automated or Advised Actions: Based on insights, the system may trigger automated irrigation, send threshold alerts, or advise on planting windows and fertilizer timing.
- Continuous Optimization: Each season’s data refines the next season’s thresholds, so the system’s recommendations improve as more field history accumulates.
Costs, Savings, and ROI: The Numbers That Matter
This is the section most articles on this topic skip, and it is the one that actually decides whether an agriculture monitoring system is worth installing. Start with the USDA ERS’s 2016 analysis of precision agriculture on US corn farms, which measured actual per-acre cost savings by technology: yield mapping saved $25 per acre, GPS soil mapping saved $13 per acre, and auto-guidance systems saved $15 per acre (USDA ERS, Cost Savings from Precision Agriculture Technologies on U.S. Corn Farms). Those figures are specific to corn and to the 2016 analysis period — the USDA has not republished an updated per-technology breakdown since, so treat them as a documented floor rather than a current guarantee, and re-check the same USDA ERS Amber Waves page for any newer revision before budgeting.
On the spending side, farm management software in the US runs $1 to $60 per acre depending on feature depth, per Market.us’s 2026 farm management software statistics report (Market.us, Farm Management Software Statistics). Drone-as-a-service crop monitoring, an alternative to fixed ground sensors, costs $5 to $40 per acre depending on flight frequency and analysis depth. The same Market.us survey found that growers expect a minimum 3:1 return on investment before adopting precision agriculture technology — meaning a system needs to return at least three dollars of value for every dollar spent to clear the industry’s own adoption bar.
If satellite imagery is the route you are weighing, remote crop monitoring options compares imagery sources, indices and costs.
Automated irrigation systems carry a longer payback horizon: 2 to 5 years, according to WiseConn’s 2026 cost analysis (WiseConn, Cost of Automated Irrigation System). That range depends heavily on your water cost per acre-foot and your current irrigation efficiency — a farm on expensive pumped groundwater in an arid region pays back faster than one on cheap gravity-fed surface water. On performance, a 2024–2025 field trial published in Scientific Reports measured a 47% reduction in water use from IoT-based smart irrigation systems (Scientific Reports, PMC12820134) — this is a specific trial result, not a nationwide average, and the study notes results vary by climate zone and crop, so use it as a benchmark to test against your own field data rather than a number to promise your operation will hit.
On adoption rates broken down by specific crop type — corn versus soybean versus wheat versus specialty crops — the published USDA and Market.us sources available for this article report only aggregate or farm-size adoption figures, not per-crop breakdowns. If you need a crop-specific number, the USDA’s Agricultural Resource Management Survey (ARMS) publishes commodity-level detail in its full data tables; query the relevant commodity survey year directly at ers.usda.gov. Similarly, field-verified ROI outcomes broken down by farm size or region were not found in the sources reviewed for this piece — the 3:1 figure above is an adoption threshold expectation, not a measured outcome — so if you want a verified ROI for your own operation, track your actual input spend against yield for one full season before and after adoption rather than relying on an industry-wide average.
Irrigation Savings Calculator
Use the calculator below to estimate potential water and cost savings from smart irrigation on your own acreage, based on the 47% water-use reduction figure from the Scientific Reports field trial cited above.
Run your own numbers
Assumptions: the default 47% reduction figure comes from a single 2024–2025 IoT smart-irrigation field trial (Scientific Reports, cited above) and will not match every climate zone or soil type — adjust it to your own field data once you have a season of measurements. This tool excludes equipment and installation costs, payback period, and any yield-side effects; it estimates water and water-cost savings only.
Managed IoT Agriculture Services vs. DIY Sensor Networks
“Managed iot agriculture services” and “iot agriculture managed services” both describe the same choice: pay a vendor to install, calibrate, and maintain your sensor network and connectivity, versus buying hardware and running it yourself. The decision usually comes down to farm size and in-house technical staff. Farms large enough to justify a full LoRaWAN gateway and dozens of soil probes often have the scale to absorb a managed-service contract; smaller and midsize operations more often find that satellite-based monitoring — which needs no field hardware at all — clears the 3:1 ROI bar faster because there is no sensor fleet to install, calibrate, or repair after a hailstorm.
Farmonaut’s approach sits in that second category: satellite imagery and AI analytics replace ground sensors entirely, which is why the platform can offer large-scale farm management without the installation cost typically associated with “iot agriculture sensors” deployments. Weigh that trade-off against the USDA’s EQIP cost-share (up to 75% for qualifying hardware, per the ERS source above) before assuming ground sensors are automatically the more expensive path — the cost-share can close much of the gap for farms that qualify.
Feature-Impact Comparison Table: IoT Sensors & Systems in Agriculture
The table below maps common IoT devices and systems to the parameters they monitor and their documented cost or savings range from the sources cited in this article.
| IoT Device/System | Monitored Parameter | Documented Cost or Savings | Source |
|---|---|---|---|
| Yield Monitor / Yield Mapping | Yield, soil variability | $25/acre savings (US corn) | USDA ERS, 2016 |
| GPS Soil Mapping | Soil composition | $13/acre savings (US corn) | USDA ERS, 2016 |
| Auto-Guidance / Autosteering | Equipment path, field coverage | $15/acre savings (US corn); 52-70% adoption by farm size | USDA ERS, 2016 & 2023 |
| Smart Irrigation System | Soil moisture, weather data | 47% water-use reduction (field trial) | Scientific Reports, 2024-2025 |
| Farm Management Software | Aggregated farm data, planning | $1-60/acre (pricing range) | Market.us, 2026 |
| Drone-as-a-Service Monitoring | Crop canopy, NDVI | $5-40/acre (pricing range) | Agrinofy, 2026 |
| Satellite-Based Monitoring (no ground hardware) | NDVI, soil moisture proxy, weather | No field sensor install cost | Platform-dependent (e.g., Farmonaut) |
Every figure in this table traces to a named source above — none of it is an estimate invented for this table. Where a cell says “documented,” it means the number appears in the cited publication for the stated crop, region, and period; apply it to your own operation as a benchmark, not a guarantee.
Applications: Farm Monitoring in Practice
A. Crop Management with Precision Farming Technologies
-
Smart Soil Monitoring and Data-Driven Irrigation: Continuous soil moisture monitoring and nutrient tracking supports precise water and fertilizer delivery, lowering input cost while protecting yield.
Read more here - Precision Planting & Crop Health Assessment: Monitoring plant health through NDVI or multispectral data lets growers spot problems early and target interventions instead of treating a whole field uniformly.
- Pest and Disease Monitoring: IoT devices and satellite-derived stress indices can flag early crop stress, enabling targeted rather than blanket pesticide application.
B. Livestock Monitoring & Health Management
-
Wearable IoT sensors for cattle track body temperature, heart rate, activity, and location, supporting earlier disease detection and better breeding decisions.
More details here
C. Climate Monitoring for Farms
- Weather stations and satellite data let growers adapt planting and harvest timing to drought, excess rainfall, or temperature extremes as conditions develop through the season.
D. Supply Chain Optimization and Transparency
-
IoT sensors attached to harvest, storage, and transport units monitor temperature and humidity and send alerts on deviation, reducing post-harvest losses and supporting traceability claims.
Learn more
Farmonaut: Satellite-Based Agriculture Monitoring
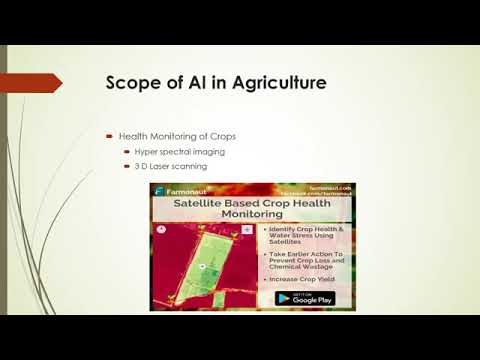
Farmonaut delivers agriculture monitoring without requiring a field sensor network, using multispectral satellite imagery, AI-driven advisory, and blockchain-based supply chain traceability instead.
-
Satellite-Based Crop Health Monitoring:
Multispectral satellite imagery tracks NDVI (vegetation health) and soil moisture proxies, flagging early signs of stress, pest pressure, or disease. -
Jeevn AI Advisory System:
This AI tool merges farm data analytics and weather forecasts to deliver management recommendations and alerts. -
Blockchain-Based Product Traceability:
The product traceability system tracks farm-to-market movement for regulatory compliance and buyer trust. -
Fleet and Resource Management:
Satellite-based logistics and fleet monitoring reduce machinery operating costs. -
Carbon Footprinting Tools:
The carbon footprinting solution helps operations monitor and reduce emissions. -
Web, Android, iOS Apps & API Integration:
Integrate the satellite data API or use the API developer docs to build custom agri-applications. -
Crop Loan and Insurance Verification:
Insurers and lenders can verify crop health and area for faster, fraud-resistant loan and insurance decisions. -
Large-Scale & Plantation Farm Management:
The large-scale farm management platform helps enterprises monitor thousands of acres and coordinate field operations.
Farmonaut Subscriptions: Precision Farming at Every Scale
Choose a subscription plan matched to your acreage, data-update frequency, and management needs, from web or mobile.
Challenges in Implementing IoT Agriculture Sensors
The path to a fully integrated iot based agriculture monitoring system has real obstacles worth planning around before purchase:
-
Initial Cost & Investment:
Sensor, network, and cloud-platform costs can be significant for small to midsize farms — recall the $1-60/acre software range and $5-40/acre drone-service range cited above. Satellite-based platforms like Farmonaut remove most of the hardware cost from that equation.
More information -
Connectivity & Infrastructure:
Reliable connectivity is often the binding constraint in remote areas, which is a direct reason the USDA committed roughly $2.0 billion per year to rural broadband under its eConnectivity initiative (cited above). -
System Complexity & Training:
Deployment requires training staff to install, calibrate, and interpret sensor dashboards correctly — a cost that rarely shows up in vendor pricing sheets. -
Data Privacy & Security:
Cloud-based analytics and connected devices require encryption and access controls to protect farm operating data.
Dive deeper
A durable way to evaluate any vendor pitch against these challenges: ask for the per-acre cost, the connectivity method and its rural coverage track record, the training time required, and a written data-handling policy — four questions that stay relevant regardless of which sensor generation is on the market when you ask them.
Future Trends for Smart Agriculture Monitoring Systems
The technology in agricultural IoT continues to evolve. These are the structural shifts to track, independent of any single product cycle:
-
Deeper Integration with AI & Machine Learning:
Combining sensor data with AI/ML models is pushing predictive analytics further into crop forecasting and early disease detection.
Sources & details -
Advancements in Sensor Technology:
Sensors continue to become more affordable and capable of measuring a wider array of parameters, including micronutrients. -
5G & Low-Latency Networks:
Expanding 5G coverage supports more connected devices per field and faster analytics turnaround for drone and robotic deployments. -
Blockchain for Agri-Supply Chain Transparency:
Immutable records continue to build buyer and regulator trust in origin and quality claims.
More on blockchain in agri -
API-Driven Interoperability:
Integration of IoT analytics with farm management software and weather data is deepening. Use the Farmonaut API or the developer docs for technical integration details.
The way to stay current on this section without rereading a new article every year: watch the USDA ERS precision agriculture page for the next ARMS data refresh, and cross-reference two or three market research firms (Market.us, Technavio, ResearchAndMarkets) each Q1-Q2 when they update market-size estimates, since no single firm’s number should be taken as consensus on its own.
Frequently Asked Questions (FAQ)
What is an IoT based agriculture monitoring system?
It is a network of connected sensors, or satellite imagery in hardware-free versions, that collects soil, weather, crop, and livestock data in real time and analyzes it in the cloud. Growers use the output to optimize irrigation, fertilization, pest control, and resource allocation.
What does an iot based smart agriculture monitoring system cost in the US?
Farm management software runs $1 to $60 per acre and drone-as-a-service monitoring runs $5 to $40 per acre, per Market.us’s 2026 statistics. Ground sensor networks add hardware and installation cost on top, though USDA’s EQIP program covers up to 75% of qualifying precision agriculture technology costs. Satellite-based platforms avoid field hardware costs entirely.
How much can smart irrigation actually save?
A 2024-2025 field trial published in Scientific Reports measured a 47% reduction in water use from IoT smart irrigation systems. Automated irrigation systems typically pay back in 2 to 5 years per WiseConn’s 2026 cost analysis, depending on your water cost and existing irrigation efficiency — use the calculator above with your own numbers to estimate your case.
Are managed IoT agriculture services worth it versus DIY?
It depends on scale and in-house technical capacity. Larger operations with existing IT staff often manage sensor networks in-house; smaller and midsize farms more often find managed services, or hardware-free satellite monitoring, clears the 3:1 ROI threshold faster once installation and maintenance labor are counted.
Which Farmonaut solution fits my farm?
Smallholders track crop health and weather via Farmonaut apps; plantations use large-scale farm management; agribusinesses use traceability and carbon footprint tracking.
Where can I get updated adoption and market figures after reading this?
USDA’s ERS publishes precision agriculture adoption data through its Agricultural Resource Management Survey, refreshed on a five-year census cycle with annual updates on select metrics, at ers.usda.gov. For market-size figures, compare the latest releases from Market.us, Technavio, and ResearchAndMarkets, which each update in Q1-Q2.
Further reading:
Conclusion
The core facts in this article — 52% and 70% adoption of guidance autosteering by farm size, $25/$13/$15-per-acre savings on corn from yield mapping, soil mapping, and auto-guidance, a 47% water-use reduction in a recent smart-irrigation trial, and a $2.36 billion US market growing at 17.8% annually — all trace to USDA ERS or peer-reviewed and market-research sources cited above, not estimates. Use the adoption gap between your farm size and its peer group, and the calculator above, as your own starting benchmark rather than a generic industry claim.
An iot based smart agriculture monitoring system, whether built from ground sensors or satellite imagery, earns its cost when the savings it documents for your specific acreage, water cost, and crop clear the 3:1 return threshold growers report expecting. Check the USDA ERS and Market.us sources linked throughout this piece directly for the numbers current when you read this, since adoption rates and market sizing are both republished on a regular schedule.
Discussion
Questions, corrections or field experience? Share them below. First-time comments are reviewed before they appear, and your email is never published.
No comments yet. Be the first to add a question or your experience.

 Suminter India Organics
 Crossprod
 Patrick America
 Liquify Digital
 CU Foods
 BeyondTech Global
 Rouge VC
 AgroGreen Dynamics
 AgroRisk
 Oath Inc
 Reddane Farming
 Esri North East Africa
 Cresol
 MDCV UK
 Zerella Group
 Etech Consulting Madagascar
 Vestlandsforsking
 Delicio
 WB Dev
 Sama Premium
 Exploration consultancy · South Africa · Gold
 Licence holder · Niger · Gold










