

Remote Agriculture Monitoring Solutions: Costs, Range, Data
Reviewed August 2026 against USDA’s Economic Research Service, USDA NASS Census of Agriculture data, and peer-reviewed Sensors journal research.
Try it: Run your own numbers →
Remote agriculture monitoring solutions link wireless field sensors — soil moisture probes, weather stations, canopy sensors, and livestock tags — to a gateway and a phone or web dashboard, so a grower can check field and herd conditions without walking every acre. Adoption is real but uneven: guidance and autosteer systems were used on 70% of large-scale U.S. crop farms and 52% of midsize crop farms, while yield monitors, yield maps, and soil maps reached 68% of large-scale farms but only 5%–25% of winter wheat, cotton, sorghum, and rice acreage nationally, per the USDA Economic Research Service’s analysis of Agricultural Resource Management Survey data, published February 22, 2023. This guide works through what a wireless crop monitoring solutions build actually costs, how far its signal reaches once foliage is in the way, and how much water and pumping time published field trials show it saving — then hands you a calculator to run your own field’s numbers.
Jump to: Sensor Count and Water-Savings Calculator



Table of Contents
- How Widely Are Wireless Agriculture Monitoring Solutions Actually Used?
- Wireless Crop Monitoring Solutions: Choosing the Radio Layer
- Soil Moisture Sensing and Water Savings
- Planning Coverage for Wireless Agriculture Monitoring Systems
- Applications: Crops, Livestock, Nurseries, and Whole-Farm Monitoring
- Sensor Count and Water-Savings Calculator
- Best Practices and Common Mistakes
- Where Farmonaut Fits
- Frequently Asked Questions
- Conclusion

How Widely Are Wireless Agriculture Monitoring Solutions Actually Used?
Before comparing hardware, it helps to know how far U.S. row-crop agriculture has actually gotten with any agriculture monitoring solutions, wireless or otherwise. The USDA Economic Research Service’s February 22, 2023 report found automated guidance/autosteer on tractors and harvesters used by 52% of midsize crop farms and 70% of large-scale crop farms, up from single-digit adoption in the early 2000s. Yield monitors, yield maps, and soil maps — the data layer most wireless monitoring platforms build on — were used on 68% of large-scale crop farms, according to the agency’s farm-size adoption chart, last updated December 10, 2024. On winter wheat, cotton, sorghum, and rice, the same report put combined yield-map, soil-map, and variable-rate-technology adoption at only 5%–25% of acreage — a wide gap between the row crops precision agriculture was built around and everything else grown in the country.
The gap is exactly why “remote agriculture monitoring solutions” and “farm monitoring solutions” get searched at volumes their current rankings do not reflect: growers outside corn and soybean country are still shopping for a system, not comparing brands. The 2022 Census of Agriculture, released February 13, 2024, added precision agriculture and on-farm internet access as census topics for the first time, per the USDA NASS release announcing the data. That means a county-level, all-crop adoption breakdown now exists where it did not before. To pull a number newer than the ones below, query USDA NASS’s Quick Stats database or revisit the two ERS pages cited here — both update on the agency’s normal survey cycle instead of staying fixed at these figures.
| Technology | Midsize crop farms | Large-scale crop farms | Source & vintage |
|---|---|---|---|
| Automated guidance / autosteer | 52% | 70% | USDA ERS, Feb. 22, 2023 |
| Yield monitors + yield maps + soil maps | Not broken out separately | 68% | USDA ERS, Dec. 10, 2024 update |
| Yield maps / soil maps / VRT on wheat, cotton, sorghum, rice | 5%–25% of acreage (all farm sizes combined) | USDA ERS, Feb. 22, 2023 | |
Wireless Crop Monitoring Solutions: Choosing the Radio Layer
Every wireless crop monitoring solutions build makes the same decision first: which radio standard moves a reading from a sensor in the ground to a dashboard on a phone. Farmonaut’s multispectral and wireless agriculture sensors page covers Farmonaut’s own hardware; the table below lays out the industry-wide radio classes behind most wireless agriculture monitoring systems, regardless of vendor.
| Technology | Documented range | Power profile | Where it fits |
|---|---|---|---|
| LoRaWAN | Up to 5 km line-of-sight in urban settings, 15 km or more in rural line-of-sight | End nodes rated for up to 10 years on one battery | Row-crop fields and pasture where one gateway must reach sensors across hundreds of acres |
| NB-IoT / LTE-M (cellular LPWAN) | Rides existing carrier towers; coverage is set by your carrier’s map, not a fixed spec | Built for multi-year battery life on a standard cell radio | Fields already inside cellular coverage where you do not want to run your own gateway |
| Bluetooth Low Energy / mesh | Tens of meters node-to-node; a field-wide network relays hop-to-hop through repeaters | Months to two years per coin-cell, depending on report interval | Livestock ear tags, greenhouse benches, nursery rows with sensors close together |
| Wi-Fi | Under 100 meters outdoors from a router, less through walls; highest bandwidth of the four | Hours to a few days on battery — plan on mains or solar power | Barns, packhouses, and sites with existing electricity and a router |
Row range for LoRaWAN and its battery figure come from Semtech’s LoRa and LoRaWAN technical note (AN1200.86, March 2024). The other three rows describe standard, carrier- or chipset-defined behavior rather than a single benchmark figure — confirm the exact number on the datasheet of the specific radio module or carrier plan you are quoting.
Hardware cost differences are just as wide as radio-range differences. A peer-reviewed IoT capacitive soil-moisture sensor built for a 2025 field trial cost about $62 in parts, against $800–$1,500 for the commercial-grade capacitance probes it was benchmarked against, per the study published in Sensors on March 4, 2025. The DIY unit is not a drop-in replacement for a ruggedized commercial probe — the trial ran on drip-irrigated lettuce in a research field for one season, not several years of unattended row-crop use — but it shows how much of a commercial sensor’s price covers durability and support rather than the underlying capacitance-sensing electronics.
Soil Moisture Sensing and Water Savings
The number growers actually want from wireless crop monitoring systems is a water and pumping-time figure, not a radio spec sheet. In the same 2025 trial, drip-irrigated lettuce scheduled from real-time IoT soil-moisture readings used 28.8% less water and ran pumps for 16.2% fewer hours than a plot scheduled from weather-based evapotranspiration estimates, while crop water productivity rose from 10.5 kg of marketable yield per cubic meter of water to 16 kg/m³ — a 52.5% gain — per the Sensors study. Those figures come from one field trial on one crop under drip irrigation in Puglia, Italy; a center-pivot corn field or a flood-irrigated rice paddy will not reproduce them exactly, but they are the most specific, citable evidence available for what soil-moisture-triggered scheduling changes relative to a calendar- or weather-only schedule.
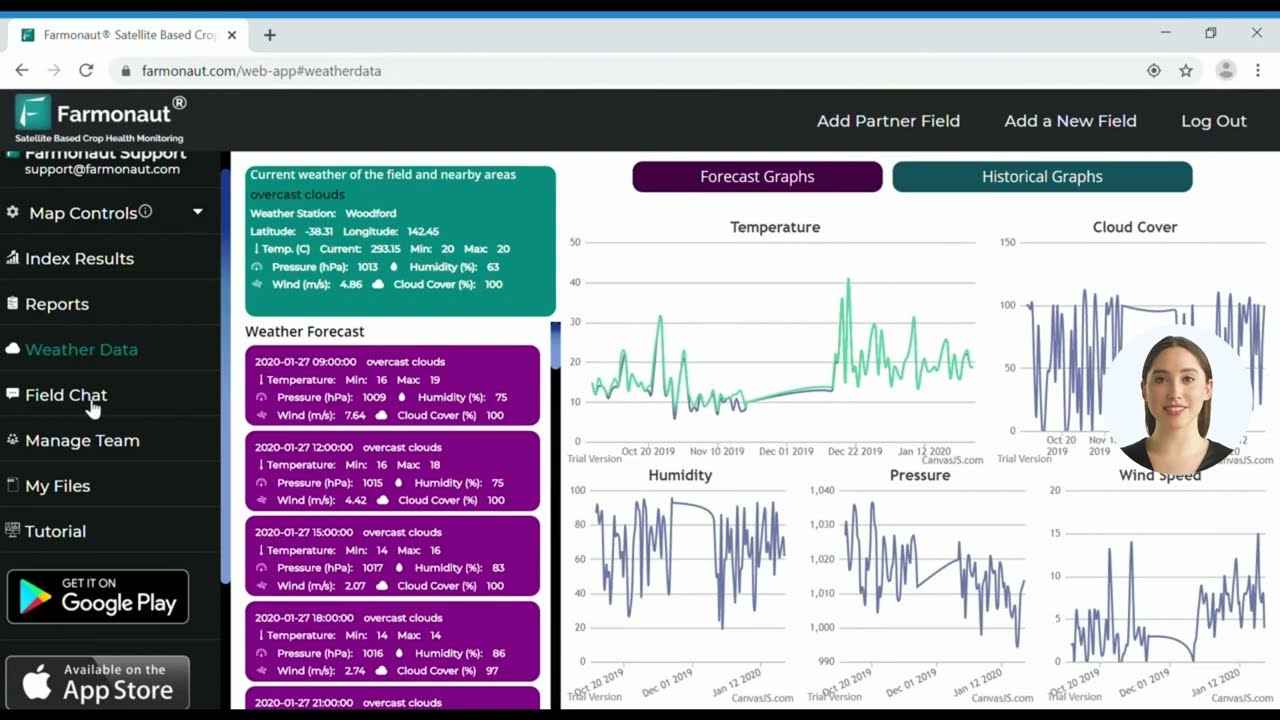
Wireless plant monitoring solutions built around soil moisture, canopy temperature, and NDVI-style optical proxies work on the same mechanism for early stress detection: because the sensor reports continuously instead of waiting for a scheduled scouting pass, an irrigation or pest problem shows up in the data before it shows up as visible leaf damage. That gap in timing — not the sensor “growing more crop” — is what sits behind most yield-boost claims tied to wireless sensing.


Planning Coverage for Wireless Agriculture Monitoring Systems
Manufacturer range specs assume line-of-sight. A 2021 wireless-sensor-network study run across a citrus grove measured how much a live canopy cuts that range, mounting nodes at several heights and modeling signal strength against distance; near-ground receiver placement, with the emitter mounted between 0.5 and 1 meter above the ground, outperformed higher mounting at every distance tested, and foliage density between rows caused the largest signal fluctuations in the dataset, per the study published in Sensors on October 30, 2021. Their published regression model for a 1-meter emitter height — signal strength (dBm) equals −7.69 times the natural log of distance in meters, minus 44.194 — implies the drop shown below as distance from the gateway increases.
The practical takeaway holds regardless of which radio you buy: a spec sheet’s kilometer figure is a ceiling, not a guarantee, once a field is planted. Before committing to a full network, run a short site test:
- Buy 2–3 sensors and one gateway before ordering enough hardware for the whole farm.
- Mount the gateway antenna between 0.5 and 1 meter off the ground, matching the height the citrus-grove study found best, and log signal strength there against a higher mounting point.
- Walk-test at the distances you actually need — field edge, field center, and your farthest planned sensor — during peak canopy, not on bare soil before planting.
- Record received signal strength at each point so you have a baseline to compare against if coverage drops later in the season.
That four-step test stays useful regardless of whether your eventual pick runs on LoRaWAN, NB-IoT, Bluetooth mesh, or Wi-Fi — it is a deployment method, not a number that expires when a vendor updates its spec sheet.
Applications: Crops, Livestock, Nurseries, and Whole-Farm Monitoring
Row Crops and Orchards
Soil-moisture and canopy sensors on LoRaWAN or NB-IoT cover the acreage described in the adoption data above: irrigation timing, early stress flags, and — layered with satellite passes — a field-wide health map instead of point readings from a handful of probes.
Livestock and Pasture
Wireless livestock monitoring solutions put the same radio classes onto ear tags and collars instead of soil probes: Bluetooth mesh or LoRaWAN reports location, activity, and body temperature so a rancher can flag a sick or missing animal without riding the full pasture. Automated gate and fence controls tied to the same network extend rotational grazing plans without adding labor hours.
Nurseries, Greenhouses, and Forestry
For propagation benches and nursery rows, wireless plant monitoring solutions built on Bluetooth or Wi-Fi outperform long-range radios because distances are measured in meters, not fields, and mains power is usually already run to the structure. In forestry and land bordering mining operations, the same soil and moisture sensors that trigger irrigation elsewhere are read instead for slope stability and drainage, supporting compliance and reclamation monitoring.
Whole-Farm Infrastructure
Farm monitoring solutions extend past the crop canopy into pumps, valves, and storage: automated pumps start and stop on sensor input instead of a fixed clock, and a cloud platform aggregating every reading turns scattered sensor data into one maintenance and irrigation schedule.

| Sensor type | Main function | Common wireless link | What the published evidence shows |
|---|---|---|---|
| Soil moisture | Root-zone water content for irrigation timing | LoRaWAN, NB-IoT, Bluetooth | 28.8% less water, 16.2% fewer pumping hours vs. weather-based scheduling (Sensors, Mar. 2025, single lettuce trial) |
| Weather / microclimate | Temperature, humidity, rainfall, evapotranspiration | LoRaWAN, cellular | No independent published field figure found for this article — ask the vendor for site-trial data before buying |
| Canopy / crop health (optical) | Early stress and disease flags | LoRaWAN, Bluetooth, satellite complement | Timing advantage over manual scouting is documented qualitatively; ask the vendor for a quantified detection-lag figure |
| Livestock / pasture tracking | Location, body temperature, trough use | Bluetooth mesh, LoRaWAN/NB-IoT, cellular ear tags | Battery life and range are tag-model-specific — request the datasheet for the exact tag under consideration |
Sensor Count and Water-Savings Calculator
Enter your own field size, expected sensor coverage radius, and pumping schedule to size a network and estimate seasonal savings from the 16.2% pumping-hour reduction reported in the Sensors field trial cited above.
Run your own numbers
Assumes uniform circular coverage per node with no overlap, and applies the 16.2% pumping-hour reduction measured in the cited Sensors trial (soil-moisture-triggered drip scheduling vs. weather-based scheduling). It excludes hardware, installation, and data-plan costs, and it does not adjust for your specific soil type or crop. Use it to size a pilot, not a final purchase order.
Best Practices and Common Mistakes
- Pilot before you scale. The signal-attenuation study above shows canopy alone can cut a rated range well below its line-of-sight spec — confirm coverage on your own field before ordering a full network.
- Match the radio to the distance, not the marketing. LoRaWAN’s multi-kilometer, multi-year-battery profile is wasted on a nursery bench 20 meters from its gateway; Bluetooth mesh is wasted trying to cross a quarter-section.
- Automate power, not just data. Solar or energy-harvesting nodes remove the most common field failure mode — a dead battery nobody notices until the dashboard goes quiet.
- Standardize on open data formats so sensor feeds integrate with other farm software, weather feeds, and traceability records such as Farmonaut’s blockchain traceability.
- Re-test coverage each season, not just at installation — canopy density and foliage change as the crop grows, and the citrus-grove study found that variable caused the largest signal swings it measured.
Where Farmonaut Fits
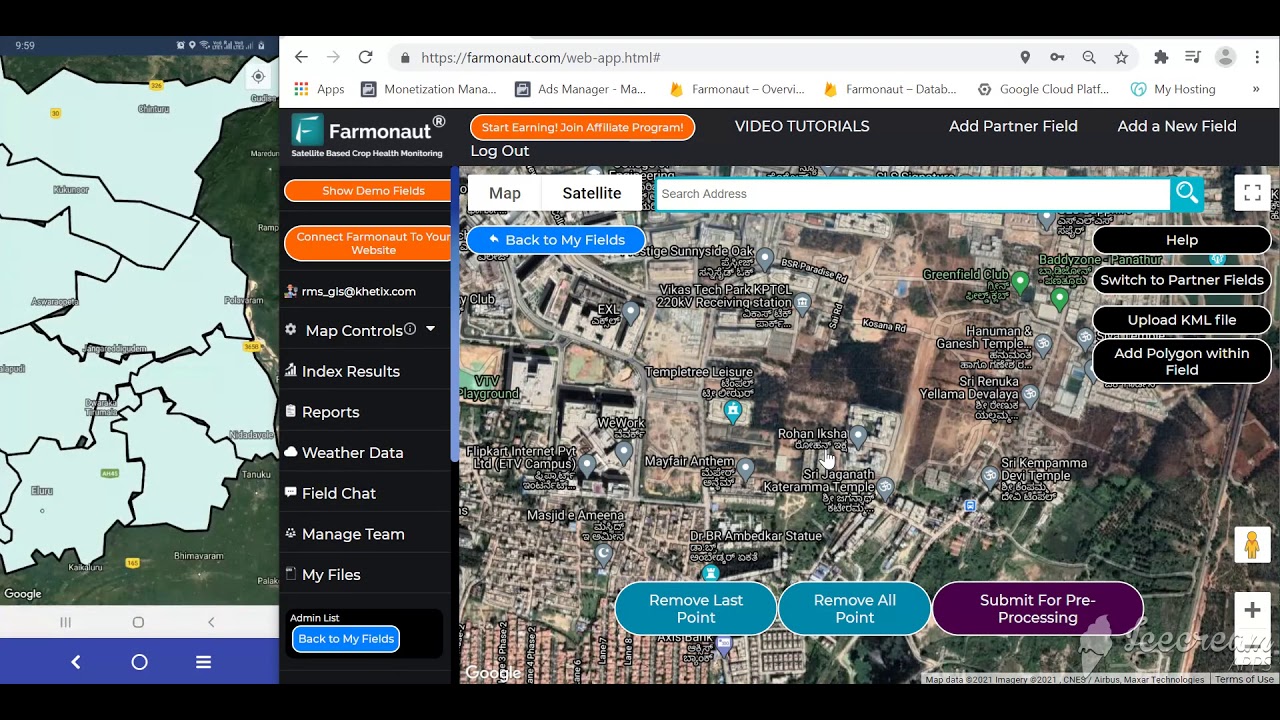
Farmonaut pairs satellite imagery with the wireless field layer covered above so growers who cannot yet afford a dense in-field sensor network still get field-level monitoring:
- Satellite-based crop and soil monitoring that complements ground sensors where a full wireless network is not yet in place.
- AI-driven advisory (Jeevn AI) for irrigation, fertilizer timing, and disease-risk alerts.
- Blockchain product traceability linking farm data to buyers and processors.
- Fleet management for vehicles and equipment logistics.
- Carbon footprinting for sustainability reporting.
- APIs for developers building on top of the same data: API access and developer documentation.
- Financing support through remote verification via crop loan and insurance tools.
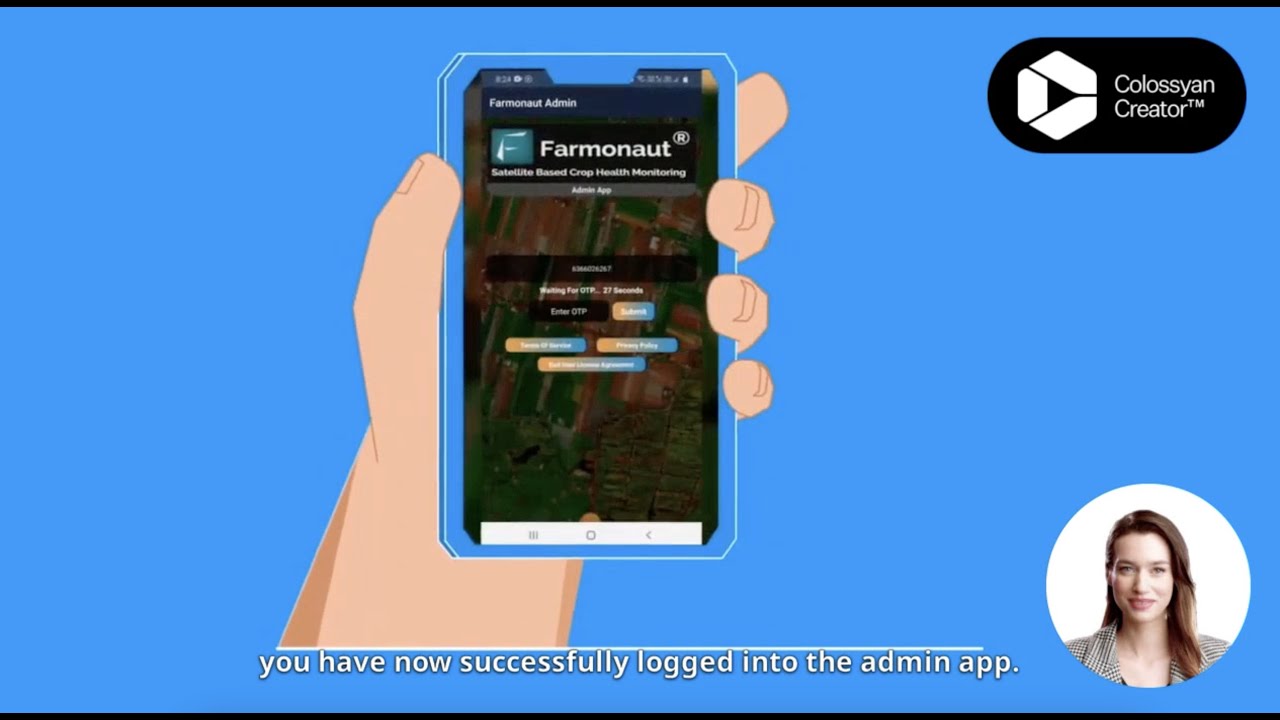
- Multi-field oversight through the admin dashboard for large-scale farm and plantation management.
- Try it: Run your own numbers

Frequently Asked Questions
What counts as a “remote agriculture monitoring solution” versus a wireless one?
Remote monitoring covers anything that reports field or herd data without an on-site visit, including satellite passes that update every few days. Wireless monitoring is the subset built on ground sensors — soil, weather, canopy, or livestock tags — reporting continuously over a radio link such as LoRaWAN, NB-IoT, Bluetooth, or Wi-Fi. Most working systems combine both.
How much water can wireless soil-moisture monitoring actually save?
The one published, citable figure available for this article is 28.8% less water and 16.2% fewer pumping hours, measured against weather-based scheduling in a peer-reviewed 2025 drip-irrigation trial on lettuce. Your own savings will differ by soil type, crop, and irrigation method — the calculator above lets you apply the pumping-hour figure to your own schedule.
What is the real range of a wireless field sensor once crops are planted?
Manufacturer specs (LoRaWAN’s 15 km-plus rural line-of-sight, for example) assume a clear line of sight. A 2021 peer-reviewed study in a citrus grove found canopy density caused the largest signal-strength swings it measured, and that near-ground antenna placement (0.5–1 meter) outperformed higher mounting at every tested distance — run the four-step walk-test in the deployment section before buying for full coverage.
Do wireless livestock monitoring solutions use the same hardware as crop sensors?
The same radio standards, different form factor. Ear tags and collars typically run on Bluetooth mesh or LoRaWAN rather than Wi-Fi, trading bandwidth for battery life and range across open pasture.
Are wireless monitoring systems affordable for a small operation, or only large farms?
USDA’s own adoption data shows the gap runs the other way from what many assume: guidance and yield-monitoring technology adoption is concentrated on large-scale farms, and combined adoption on wheat, cotton, sorghum, and rice acreage sits at just 5%–25%. Low-cost, DIY-adjacent sensor hardware (like the $62 prototype cited above) narrows that cost gap, though it trades away the durability testing and support that comes with a $800–$1,500 commercial unit.
How does Farmonaut fit if I do not have wireless field sensors yet?
Farmonaut’s satellite layer, AI advisory, and traceability tools work without ground sensors installed, so a farm can start with remote satellite monitoring and add wireless soil, weather, or livestock sensors as budget allows, using the API to bring both data sources into one dashboard.
Conclusion
The evidence above points to a specific, non-obvious takeaway: the biggest gains from wireless agriculture monitoring solutions come less from any single sensor and more from closing the timing gap between a problem starting and a person noticing it — 16.2% fewer pumping hours in the cited trial is a scheduling improvement, not a hardware miracle. Guidance and yield-mapping technology sit on most large-scale U.S. crop farms already; the room to grow is in the crops and farm types the ERS data shows still under 25% adoption, and in matching radio choice and antenna placement to what a canopy actually allows rather than what a spec sheet promises.
Run the calculator above with your own acreage and pumping schedule, walk-test coverage before buying a full network, and revisit the USDA sources cited here on their normal update cycle to keep these figures current for your operation.
Product Traceability
Crop Loans & Insurance
Fleet Management
Large Scale Farm Management
Discussion
Questions, corrections or field experience? Share them below. First-time comments are reviewed before they appear, and your email is never published.
No comments yet. Be the first to add a question or your experience.

 Click2Cloud
 TVS Electronics
 BW Pipelines
 WICO
 Gen Chayat
 Chimera Innovation
 SkyHarvest
 Polaris Digitech
 Teledarbas
 Wild Oak Farm
 SFX
 BACF Africa
 Doodlakine
 Exurbia Geospatial
 FieldZero
 Indico Company

 Licence holder · Niger · Gold










