

Crop monitoring · Drone buyer guide
Drone Agriculture Monitoring: Costs, Rules, Alternatives
Drones map crop health, water stress and stand gaps at centimetre detail. Aerial imagery was used on 2.8% to 9.8% of US row-crop acres in USDA surveys, so check rules, costs and satellite alternatives before you buy.
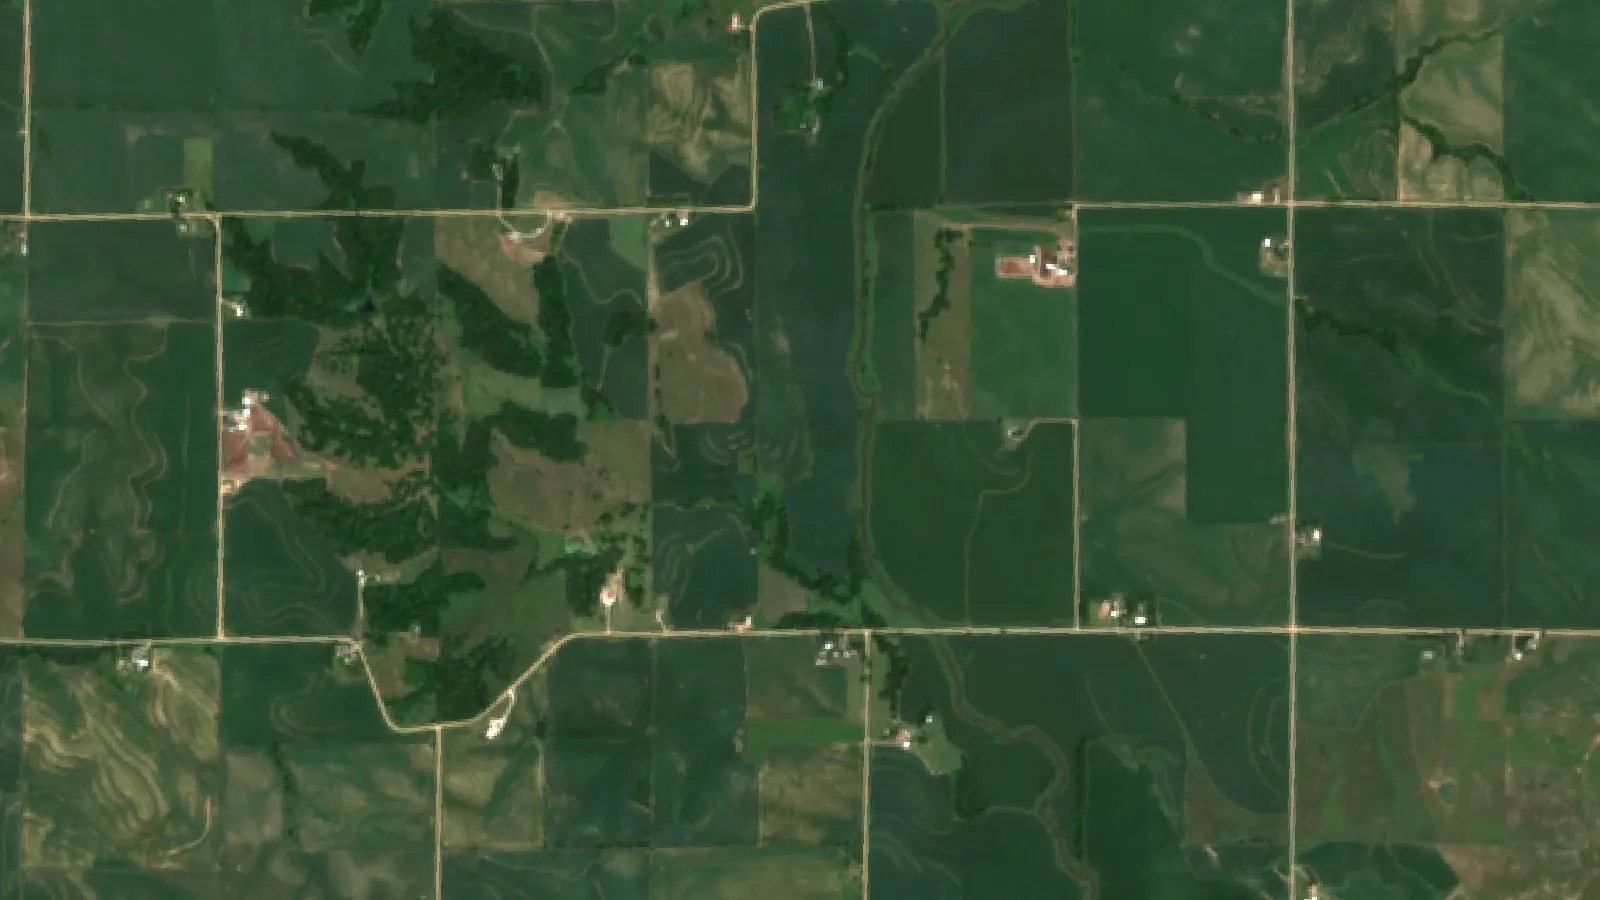
Key takeaways
- USDA ERS surveys found drone, aircraft or satellite imagery on 2.8% (cotton, 2019) to 9.8% (soybeans, 2018) of planted acres for the crops surveyed.
- Flying a drone for farm business in the US falls under FAA Part 107: under 55 lb, up to 400 ft, visual line of sight, certified pilot.
- Sentinel-2 gives 10 m crop maps about every 5 days at the equator (ESA); Landsat 9 gives 30 m every 16 days (NASA).
- Drones suit stand counts, thermal irrigation checks and damage records; satellite maps suit whole-farm checks without flying.
- A map shows where plants differ, not why. Walk the flagged spots before you act.
In this article
- What drone agriculture monitoring covers
- How many farms use drone and satellite imagery
- Drone vs satellite crop monitoring
- FAA rules for drone agriculture monitoring in the US
- What drone crop monitoring costs
- Drone and camera types for crop monitoring
- How to choose an agriculture monitoring setup
- Seven ways to monitor crops, with best uses
- Satellite crop maps as a drone alternative
- Making drone agriculture monitoring pay
- Weather, clouds and data limits
- How we checked the numbers
- FAQ
Drone agriculture monitoring means flying a small camera drone over fields to map crop health, water stress and damage at a few centimetres per pixel. In the US, aerial imagery from drones, aircraft or satellites was used on 2.8% to 9.8% of planted acres for the major row crops surveyed, according to the USDA Economic Research Service report on precision agriculture (EIB-248, 2023). So most planted acres in those surveys had no drone, aircraft or satellite imagery at all, and drones fill specific gaps.
This guide explains what a drone can and cannot see, what the FAA rules require, what it costs, and when satellite crop maps do the same job for less work. It has three charts built from official data and a calculator to compare owning a drone with hiring a drone service.
What drone agriculture monitoring covers
A monitoring drone is a camera platform. It does not spray, and it does not decide anything by itself. It flies a planned grid, takes hundreds of overlapping photos, and software stitches them into one map of the field. The value comes from three things: the camera, how often you fly, and whether someone acts on the map.
Common jobs for a monitoring drone on a farm:
- Crop health maps. Multispectral cameras record red and near-infrared light. Software turns that into vegetation indices such as NDVI, which show stronger and weaker growth.
- Water stress checks. Thermal cameras record canopy temperature. A warmer patch can mean plants are not using water well, for example a blocked emitter or a pivot problem.
- Stand counts. High-resolution colour photos let software count young plants and find gaps after emergence.
- Damage records. After hail, wind or flooding, a drone map gives a dated record for your own planning or for an insurance conversation.
- Drainage and terrain. Photogrammetry and lidar build elevation models that show where water pools.
- Livestock and fences. Short flights can check water points, gates and fences on large blocks.
The ERS report lists crop mapping, livestock monitoring, land surveying and crop spraying as the main farm uses of drones, aircraft and satellite tools.
What a drone map does not tell you
A drone map shows where plants look different. It does not name the cause. A low-NDVI patch can be nitrogen loss, compaction, disease, insects, weeds or a planter skip. Someone still has to walk to the patch, dig, look at leaves and, if needed, take a tissue or soil sample. Treat the map as a guide to where to scout, not as a diagnosis.
How many farms use drone and satellite imagery
Use is still limited. The USDA Agricultural Resource Management Survey asks farmers about drones, aircraft and satellite imagery as one group. The shares below are percent of planted acres for each crop in the survey year shown.
Chart
US acres using drone, aircraft or satellite imagery
Percent of planted acres, by crop and USDA ARMS survey year
Soybeans had the highest share in the data shown (9.8% of acres in 2018) and cotton the lowest (2.8% in 2019). The same ERS report says variable-rate technology is much more common than drones and other aerial tools. Use has likely grown since these surveys, but EIB-248 has no crop-by-crop figures after 2019 for this group.
Spray drones are a separate and faster-growing market. The American Spray Drone Coalition’s 2025 Impact Survey, as summarised by an industry statistics guide, counted 16.4 million US acres treated by spray drones in 2025, up from 3.7 million in 2023. Spraying is not monitoring, but many operators sell both services, which makes it easier to hire a pilot near you.
Chart
US acres treated by spray drones
Million acres per year, survey estimate
Drone vs satellite crop monitoring
Satellites and drones measure the same kind of light. The differences are pixel size, how often you get a picture, clouds, and how much work each map takes.
Chart
Pixel size of public satellite images
Metres per pixel, finest and coarsest bands
| Factor | Drone | Open public satellites (Sentinel-2, Landsat) |
|---|---|---|
| Pixel size | About 1 to 5 cm, set by camera and height | 10 m (Sentinel-2), 30 m (Landsat 9) |
| How often | Whenever you fly | About every 5 days (Sentinel-2 at the equator), 16 days (Landsat 9 alone) |
| Clouds | Flies under cloud | Optical images are lost under cloud |
| Area | Tens to a few hundred acres per battery set | Whole farm, every pass |
| Labour | Pilot, flight plan, processing | None to collect; you open a map |
| Rules | FAA Part 107 for commercial use | None for the user |
| Past seasons | Only what you flew | Archive back several years |
Sentinel-2 carries a 13-band camera with four bands at 10 m, a 290 km swath and a five-day revisit at the equator, according to the Copernicus Sentinel-2 mission page. Landsat 9 records 30 m pixels on a 16-day cycle, according to NASA’s Landsat 9 page. At mid-latitudes, revisits overlap, so you often get more passes than the equator figure, but cloud still removes some of them.
In practice, many farms use satellite maps for whole-farm checks every few days and a drone for close looks at problem areas, stand counts or damage records. A 10 m pixel is too coarse to count plants, but it is fine for spotting a 2-acre patch that is falling behind the rest of the field.
Chart
Days between images: public satellites
Nominal revisit in days (lower is more often); drones fly on demand
FAA rules for drone agriculture monitoring in the US
If you fly for your farm business, the FAA treats it as a commercial operation under Part 107. The main points from the FAA’s Part 107 summary:
- The drone must weigh under 55 pounds, including anything it carries.
- Fly no higher than 400 feet above ground level unless you are near a structure.
- Keep the drone in visual line of sight.
- Fly in daylight, or in twilight with anti-collision lighting, with at least 3 miles of visibility.
- The pilot needs a Remote Pilot Certificate.
To get the certificate, the FAA says you must be at least 16, pass an aeronautical knowledge test at an approved testing centre, and complete online recurrent training every 24 calendar months. Every drone flown under Part 107 must be registered, whatever its weight. Flying beyond visual line of sight, over people or at night without lights needs a Part 107 waiver, and you must show the operation is as safe as the rule it replaces.
Spraying with a drone is a different case. It needs Part 137 agricultural aircraft operator approval and, usually, an exemption for heavier aircraft, plus a pesticide applicator licence from your state. Always follow the product label and local rules, and check with your state department of agriculture before any aerial application.
Outside the US the rules differ. Canada, the UK, the EU and Australia each run their own drone pilot and registration schemes. Check your national aviation authority before you fly for business.
What drone crop monitoring costs
There are two routes: buy a drone and fly it yourself, or pay a drone service per acre or per visit.
Owning a drone
The costs to plan for are the drone and camera, spare batteries and propellers, mapping software, the pilot test and recurrent training, insurance, and your time to fly and process maps. ERS estimated the replacement cost reported by drone users in its 2018 survey at $2,610, which it notes was below new list prices, so some farmers likely bought used units. A multispectral or thermal camera adds to the price; check current dealer prices for the model you want.
Time is the cost people forget. Each flight needs a plan, a battery check, a site check for people and power lines, and an upload. If maps sit unread on a laptop, the drone has no value.
Hiring a drone service
A service provider brings the drone, the certified pilot and the processing. You pay per acre or per visit, and prices vary by region, acres and the products you need. Ask for the deliverable in writing: which index, which resolution, how fast you get the map, and whether the file works in your farm software.
The calculator below compares the two routes with your own numbers. The default values are examples set close to break-even, not market prices.
Try the numbers for your own farm below.
Calculator
Should you own a drone or hire a drone service?
Enter your own acres, flights, prices and drone costs.
- Hiring a service per year: $3,000
- Owning a drone per year: $3,000
- Break-even acres: 500 acres
Example values only, set near break-even; they are not market prices or a forecast. Every number is your input. Owning cost = drone price spread over the years you expect it to last, plus yearly extras (insurance, software, training, spares). Your own time is not counted.
Drone and camera types for crop monitoring
The camera matters more than the drone. Pick it for the question you want answered.
| Camera | What it records | Good for | Watch out for |
|---|---|---|---|
| RGB (colour) | Visible light photos | Stand counts, damage, weeds in rows | Shows only what the eye sees |
| Multispectral | Red, red-edge, near-infrared bands | NDVI and other vigour maps | Needs calibration panels and steady light |
| Thermal | Surface temperature | Irrigation and water stress | Readings shift with time of day and wind |
| Lidar | Laser distance points | Terrain, drainage, tree height | Higher cost; large files |
Most farm monitoring is done with small multirotor drones, which take off from a truck bed and hover for close looks. Fixed-wing and hybrid drones cover more acres per battery but need more space to launch and land. For a few hundred acres, a multirotor is usually easier to live with; for thousands of acres, ask a service provider which platform they use and how many acres they map per day.
Processing is the other half. Photos must be stitched into an orthomosaic, then turned into an index map. Some drones do this in a phone app; others need desktop or cloud software with a yearly fee. Check that the output can be exported as a GeoTIFF or shapefile if you plan to build prescriptions.
How to choose an agriculture monitoring setup
Work through these steps before you buy anything.
- Name the decision. Write down what you would do differently with a map: move irrigation, re-scout a block, replant, change a nitrogen rate. If you cannot name a decision, wait.
- Start with satellite history. Look at past seasons of satellite crop maps for your fields. Patterns that repeat every year (wet corners, sandy knolls) show where closer looks pay off.
- Match pixel size to the job. Plant counts and weed patches need a drone. Field-scale vigour and season trends work at 10 m.
- Count flights. Decide how many drone flights per season you will really make, and when. Two well-timed flights beat ten random ones.
- Check the data path. Make sure maps open in the software your agronomist or equipment uses, such as shapefiles or GeoTIFFs for prescriptions.
- Plan the people. Someone needs the Part 107 certificate, time to fly and time to walk the problem spots.
For readers who want a plain overview first, our video on precision agriculture for beginners covers the same steps.
▶ Precision agriculture for beginners: six plain steps to start. · 4:18
Seven ways to monitor crops, with best uses
The old version of this page listed seven commercial platforms with prices we could not confirm. This list compares the seven main monitoring methods instead, so you can see which fits your farm.
1. Multispectral drone mapping
Best for: zone-level crop vigour on fields you can reach, mid-season nitrogen or disease scouting. Gives centimetre detail, but needs flight time and processing for each map.
2. Thermal drone mapping
Best for: irrigation checks in orchards, vineyards and pivots. Fly at a consistent time of day, as canopy temperature changes through the day.
3. RGB drone photos and stand counts
Best for: emergence checks, replant decisions, storm damage records. A standard camera drone is enough.
4. Satellite crop maps
Best for: whole-farm monitoring every few days with no flying, and comparing this season with past ones. Sentinel-2 and Landsat data are open, and several services turn them into ready-made field maps.
5. Radar satellite images
Best for: regions with frequent cloud. Radar sees through cloud, but it records surface structure and moisture rather than plant colour, so it is read differently.
6. In-field sensors and weather stations
Best for: soil moisture, rainfall and frost alerts at fixed points. Sensors give continuous readings at one spot; images show how the whole field varies. The two work well together.
7. Walking and manual scouting
Best for: confirming the cause of any problem the other methods flag. No map replaces a look at roots and leaves.
Satellite crop maps as a drone alternative
If your main need is to know which part of which field is falling behind, a satellite service may be enough. You get a new map whenever a clear pass happens, without flying, and you can look back over earlier seasons.
Farmonaut is one such service. The Farmonaut Satellite + AI Farm Monitoring System sends vegetation, water-stress and other index maps for each field you draw, on web, Android and iOS. Our short video below shows how a satellite crop health map flags stress before it is easy to see from the ground.
Two limits to keep in mind: optical satellite maps are lost under cloud, and a 10 m pixel cannot count plants. When you need that detail, fly a drone or walk the field.
Developers and agtech teams can pull the same field data into their own tools through the satellite and weather API documentation. Larger operations can manage many farms and field teams through the agro admin app, and you can open the farm monitoring app on your phone.
▶ How satellite crop health maps show stress before you can see it. · 4:09
Making drone agriculture monitoring pay
A drone pays off when maps change what you do. A few habits help:
- Fly at fixed growth stages. For example, after emergence for stand counts and before a key nitrogen or fungicide decision.
- Fly at the same time of day. Light angle and canopy temperature shift during the day and can make fields look different between flights.
- Ground-truth every zone. Walk at least one high and one low area on each map, and record what you find.
- Keep a simple log. Note date, field, index, what you found and what you did. After two seasons you will know which flights were worth it.
- Combine layers. Compare drone maps with yield maps, soil maps and satellite history. A patch that is weak in all of them is a long-term zone, not a one-off problem.
The ERS report notes that drones are likely to suffer write-off damage much more often than equipment such as yield monitors, so budget for spare propellers, batteries and, sometimes, a replacement unit.
Weather, clouds and data limits
Every monitoring method has gaps. Drones cannot fly in strong wind or rain, and battery life limits area per day. Satellites miss cloudy days. Sensors only see the spot they sit in. Our explainer video on radar imagery shows why cloud is the main limit for optical satellite maps and what radar adds.
If you are new to remote sensing, NASA Earthdata’s fundamentals of remote sensing training explains how sensors record reflected light and how pixel size and revisit time trade off. That background makes it easier to judge any drone or satellite product.
▶ Can satellites see through clouds? Why radar can and optical cannot. · 2:37
How we checked the numbers
Adoption figures come from the USDA ERS report EIB-248, which uses the Agricultural Resource Management Survey. ERS groups drones, aircraft and satellite imagery together, so the chart cannot separate drones alone. Rules come from FAA pages read in October 2026. Satellite pixel sizes and revisit times come from ESA and NASA mission pages. Spray-drone acres come from an industry survey, not a government count, and are labelled as such. We removed the old comparison table of seven commercial platforms because we could not confirm its prices and features.
We cover a connected topic in Drought, Pest, Crop & Drone Monitoring: Innovations in Agriculture.
FAQ
What is the best agriculture monitoring system for a small farm?
For a small farm, a satellite crop map plus regular walking is often enough to start. Add a basic camera drone if you need stand counts or close checks on a few fields. Choose the setup that answers the decisions you actually make.
Do I need a licence to fly a drone over my own farm?
In the US, flying for farm business is a commercial use under FAA Part 107, so the pilot needs a Remote Pilot Certificate and every drone flown under Part 107 must be registered. Other countries have their own rules; check your national aviation authority.
Can a drone find crop disease?
A drone map can show areas that look different, which may be due to disease. It cannot confirm the cause. Walk the patch, look at the plants and, if needed, send a sample to a lab or ask your extension agronomist.
How often should I fly a monitoring drone?
Fly at the growth stages where a map changes a decision, such as after emergence and before a nitrogen or fungicide call. Satellite maps can cover the weeks in between.
Is satellite crop monitoring accurate enough?
For field-level patterns, yes. Sentinel-2 gives 10 m pixels about every five days at the equator, and more often at mid-latitudes, cloud allowing. It is not detailed enough for plant counts or single-tree checks.
Related pages on our site: farm carbon footprint monitoring, satellite data for crop loans and insurance, product traceability, farm fleet management and our agroforestry practices guide.
Farmonaut crop monitoring
See your fields from space between drone flights
Get satellite crop health maps for every field you draw, on web, Android and iOS.




Keep reading
Sources
- USDA ERS, Precision Agriculture in the Digital Era, EIB-248 (2023): ers.usda.gov
- FAA, Small UAS Regulations (Part 107): faa.gov
- FAA, Become a Certificated Remote Pilot: faa.gov
- FAA, Part 107 Waivers: faa.gov
- FAA, How to Register Your Drone: faa.gov
- ESA Copernicus, Sentinel-2 mission (SentiWiki): sentiwiki.copernicus.eu
- ESA, Sentinel-2 overview: esa.int
- NASA, Landsat 9: landsat.gsfc.nasa.gov
- NASA, Landsat 9 instruments: landsat.gsfc.nasa.gov
- NASA Earthdata, Fundamentals of Remote Sensing: earthdata.nasa.gov
- AgDroneDirectory, Agricultural Drone Spraying Statistics (citing ASDC 2025 Impact Survey): agdronedirectory.com
Discussion
Questions, corrections or field experience? Share them below. First-time comments are reviewed before they appear, and your email is never published.
No comments yet. Be the first to add a question or your experience.

 FCF India
 Rashail Infotech
 Unifrutti Gulf
 Deluxe Conseil
 TVS Electronics
 BW Pipelines
 WICO
 Gen Chayat
 Chimera Innovation
 SkyHarvest
 Polaris Digitech
 Teledarbas
 Wild Oak Farm
 SFX
 Doodlakine
 Exurbia Geospatial

 Licence holder · Niger · Gold










