

Farm waste · Examples by type
Agricultural Waste Examples: 5 Types With Amounts
The main agricultural waste examples are crop residue, animal manure, plastics, empty chemical containers and food lost after harvest. FAO puts post-harvest food loss at 13.3% of food produced in 2023, and agricultural value chains worldwide used 12.5 million tonnes of plastic in plant and animal production in 2019.
Key takeaways
- Five types: crop residue, manure, plastics and packaging, pesticide and fertilizer containers, and food lost between harvest and retail.
- EU agriculture, forestry and fishing reported 24.2 million tonnes of waste in 2022, of which 14.4 million tonnes was manure (Eurostat).
- Worldwide, 13.3% of food was lost after harvest and before retail in 2023; fruits and vegetables lost 25.4% (FAO).
- The US had 400 operating manure digesters in June 2024, which avoided 14.8 million tonnes of CO2e in 2023 (EPA AgSTAR).
- Manure and straw carry real fertilizer value: fresh broiler litter holds about 55 lb N per ton (Kentucky Extension) and wheat straw about 29 lb K2O per ton (Ohio State).
In this article
- Agricultural waste examples at a glance
- What counts as agricultural waste?
- 1. Crop residue: straw, stalks, husks and prunings
- 2. Animal manure and bedding
- 3. Plastics and packaging
- 4. Pesticide and fertilizer containers
- 5. Food loss on the farm and after harvest
- Calculator: what is your manure or crop residue worth?
- How to choose what to do with farm waste
- How we checked the numbers
- Where satellite monitoring helps
- FAQ
Agricultural waste examples fall into five main groups: crop residues such as straw and corn stalks, animal manure, plastics and packaging, empty chemical containers, and food lost between the field and the shop. The amounts are large. FAO puts post-harvest food loss at 13.3% of food produced worldwide in 2023, and agricultural value chains worldwide used 12.5 million tonnes of plastic products in plant and animal production in 2019.
This guide lists each type with a sourced quantity, explains what it can become, and gives a calculator that shows what a load of manure or straw is worth as fertilizer once you count hauling. Figures come from FAO, the US EPA, USDA, Eurostat and US university extension services, and each one carries its year.
Agricultural waste examples at a glance
The table sums up the five types. Each has its own section below, with the numbers and the source behind them.
| Type | Common examples | A sourced quantity | What it can become |
|---|---|---|---|
| Crop residue | Wheat and barley straw, corn stover, husks, prunings, vines | Wheat straw holds about 29 lb of potash per ton (Ohio State, 2023) | Mulch, bedding, compost, feed, biochar, bioenergy |
| Manure | Dairy, beef, hog and poultry manure, bedding, litter | Fresh broiler litter: about 55 lb N per ton (Kentucky Extension, 2025) | Fertilizer, compost, biogas, digestate |
| Plastics | Mulch film, silage wrap, bale twine, greenhouse film, bags | 12.5 million tonnes used in plant and animal production (FAO, 2019 data) | Recycled pellets, if clean and collected |
| Chemical containers | Pesticide jugs, drums, fertilizer bags | Up to 150,000 tonnes of empty pesticide containers a year in Asia (CropLife estimate in FAO, 2021) | Recycled plastic through take-back schemes |
| Food loss | Culled fruit, spilled grain, unsold produce, processing scraps | 13.3% of food lost after harvest, before retail (FAO, 2023) | Animal feed, compost, biogas |
What counts as agricultural waste?
Agricultural waste is any material left over from growing crops, raising animals or the first handling of farm products that the farm does not sell as its main product. Some of it is organic and breaks down: straw, stalks, leaves, roots, manure, culled fruit and processing scraps. Some of it is not: plastic films, twine, nets and chemical containers.
The word “waste” can mislead. A lot of what is listed here has a clear use and a price. Straw is baled and sold as bedding. Manure replaces bought fertilizer. Food scraps feed pigs or biogas plants. It becomes waste only when nobody collects it, when it is burned in the open, or when it washes into water.
Statistics offices count it in different ways. Eurostat, the EU statistics office, reports waste from “agriculture, forestry and fishing” as one sector. It only counts material reported as waste, so manure spread as fertilizer on the same farm is largely outside its numbers. Global bodies such as FAO measure parts of the picture instead, for example food loss or plastic use. Keep that in mind when you compare figures from different sources.
How much waste does agriculture report in the EU?
In 2022 the agriculture, forestry and fishing sector in the EU generated 24.2 million tonnes of waste, according to the Eurostat waste generation dataset (env_wasgen). Animal faeces, urine and manure made up 14.4 million tonnes of that, and vegetal wastes another 5.0 million tonnes. For scale, all economic activities and households in the EU generated 2,233 million tonnes in the same year, per the Eurostat waste statistics overview, so the farm sector’s reported share is small. Its real footprint is larger because much of its organic material never enters the waste statistics.
Chart
Waste reported by EU agriculture, forestry and fishing
Million tonnes, EU-27, 2022, by waste category
1. Crop residue: straw, stalks, husks and prunings
Crop residue is the plant material left after harvest. It is one of the most common agricultural waste examples, and it is often the largest by weight. Typical examples:
- Straw from wheat, barley, oats and rice
- Corn stover: the stalks, leaves, husks and cobs left after grain harvest
- Soybean and canola stems and pods
- Sugarcane bagasse and cotton stalks
- Vegetable leaves, vines and roots after harvest
- Prunings and woody biomass from orchards and vineyards
- Nut shells, hulls and fruit pits from first processing
How much is there? In corn, the grain is roughly half of the plant above ground. Iowa State University trials over 14 site-years found a grain harvest index of 51% on a dry matter basis, so a field leaves about as much stover as it yields in grain. The same Iowa State guide to nutrient removal with corn stover lists about 12 lb of nitrogen, 3 lb of phosphate (P2O5) and 22 lb of potash (K2O) per dry ton of stalks and leaves.
What it is worth. Straw carries nutrients that leave the field with each bale. Ohio State University valued the phosphate and potash in a ton of wheat straw at about $16.55 using June 2023 fertilizer prices, based on 3.7 lb P2O5 and 29 lb K2O per ton. Its C.O.R.N. newsletter on the nutrient value of wheat straw notes that the nitrogen in straw is organic and is not available to the next crop right away, so it did not give it a fertilizer value.
What it can become:
- Mulch and soil cover. Left on the field, residue protects soil from wind and rain, keeps moisture in and slowly returns organic matter.
- Bedding and feed. Straw and stover are baled for livestock bedding or low-quality roughage.
- Compost. Straw is the classic “brown”, carbon-rich layer mixed with manure or green material.
- Biochar. Heating dry residue with little oxygen makes a stable, carbon-rich char used as a soil amendment. Our page on biochar applications in agriculture covers how it is made and used.
- Bioenergy. Some residue is burned for heat or power, or used in biogas plants with manure.
Watch out for: removing all residue year after year takes nutrients and organic matter with it. Open burning, still used in some regions to clear fields fast, destroys that organic matter and releases smoke and greenhouse gases. Many places restrict it, so check local rules before you burn anything.
▶ Seven simple sustainable farming practices that protect soil and water, from cover crops onwards. · 4:34
2. Animal manure and bedding
Manure is the second big group of agricultural waste examples. It includes the dung and urine of livestock, plus whatever is mixed with it: straw or sawdust bedding, poultry litter, wash water and spilled feed. It comes as a solid (beef and dairy pack, poultry litter), a slurry, or a liquid from lagoons and pits.
Chart
Nutrients in a ton of solid manure
N + P2O5 + K2O combined, lb per ton, as-is moisture
What it contains. Manure is a fertilizer with a lot of water in it. The University of Kentucky publication AGR-146 on using animal manures as nutrient sources (revised February 2025) gives these average values on an as-is basis:
| Solid manure | N (lb/ton) | P2O5 (lb/ton) | K2O (lb/ton) | Moisture |
|---|---|---|---|---|
| Beef | 11 | 7 | 10 | 80% |
| Dairy | 11 | 9 | 12 | 80% |
| Swine | 9 | 9 | 8 | 82% |
| Broiler, fresh | 55 | 55 | 45 | 20% |
| Broiler, stockpiled | 40 | 80 | 35 | 20% |
| Layer | 30 | 40 | 30 | 40% |
In the table, dry broiler litter holds about five times more nutrients per ton than wet cattle or hog manure. That is why litter can be trucked a long way to fields that need it, while wet manure is usually spread close to the barn. The publication stresses that real manure varies a lot, so a lab test of your own manure, taken close to the time of use, gives the most reliable numbers.
What it can become:
- Fertilizer. Spread at agronomic rates, manure replaces part of the nitrogen, phosphate and potash a crop needs. Applying litter to meet a crop’s nitrogen need often supplies more phosphorus and potassium than the crop needs, which builds up soil test levels. A nutrient plan based on soil and manure tests avoids that.
- Compost. Composting dries and stabilises manure, cuts odour and makes it easier to move.
- Biogas. In an anaerobic digester, microbes break manure down without oxygen and release methane-rich biogas for heat, power or vehicle fuel. The leftover digestate is still a fertilizer.
How many US farms turn manure into biogas?
The US EPA’s AgSTAR programme counted 400 operational manure-based anaerobic digestion projects in the United States as of June 2024: 343 on dairy farms, 50 on hog farms, 9 on beef and 8 on poultry operations (some take manure from more than one species). The AgSTAR data and trends page says these systems avoided 14.8 million metric tons of CO2-equivalent emissions and generated 3.29 million MWh-equivalent of energy in 2023. AgSTAR also estimates biogas recovery is technically feasible on more than 8,000 large dairy and hog farms, though it notes economic feasibility varies. For more on energy routes, see our guide to agricultural waste to energy and recycling solutions.
Watch out for: manure that runs off into streams or leaches into groundwater carries nitrogen, phosphorus and pathogens. Storage, spreading dates and rates are regulated in many countries and states. Follow your local rules and your nutrient management plan, and get professional advice before changing how you store or spread manure.
Mixed farms that keep both crops and animals can cycle manure back to their own fields; our page on common farm animals covers which livestock suit which farm.
Chart
Operating manure digesters in the US
Cumulative operational livestock anaerobic digestion projects, selected years (2024 as of June)
3. Plastics and packaging
Plastic is the main example of farm waste that does not break down, and its use is rising. Common items:
- Mulch film laid over vegetable and strawberry beds
- Silage film, bale wrap, bale nets and twine
- Greenhouse and tunnel covers
- Drip tape and irrigation pipe
- Seed, feed and fertilizer bags, big bags and pallet wrap
- Plant pots, trays and crates
How much is there? In 2019, agricultural value chains used 12.5 million tonnes of plastic products in plant and animal production and 37.3 million tonnes in food packaging, according to the FAO assessment of agricultural plastics and their sustainability (2021). Crop and livestock production used about 10 million tonnes of that each year. The industry forecasts that global demand for greenhouse, mulch and silage films will rise by 50%, from 6.1 million tonnes in 2018 to 9.5 million tonnes in 2030. FAO also notes that data on how much plastic agriculture uses are limited, poorly defined and often old.
What it can become. Clean, sorted film and wrap can be recycled into pellets for new plastic products. The catch is contamination: soil, crop residue and water add weight and lower the value. So shake off soil, keep film types apart and store them dry if a collection scheme accepts them. Mulch film that stays in the field breaks into fragments that are very hard to recover, which is one reason FAO lists mulch films among its priority products.
Watch out for: burning or burying plastic on the farm is banned in many places and releases harmful fumes. Use a local collection scheme or a licensed waste contractor.
4. Pesticide and fertilizer containers
Empty chemical containers are a small share of farm waste by weight but a high-risk one. Examples include pesticide jugs and drums, intermediate bulk containers (IBCs), seed treatment packs, fertilizer sacks and veterinary medicine bottles.
How much is there? FAO cites a CropLife International estimate that up to 150,000 tonnes of empty pesticide containers are produced each year in Asia alone. Its 2021 plastics report includes container collection rates by region and lists the countries with dedicated container management systems.
What they can become. Rigid HDPE containers that are properly rinsed can be recycled through industry take-back schemes where these exist. FAO recommends triple rinsing straight after emptying, adding the rinse water to the spray tank, and puncturing the container so it cannot be reused for food or water.
Watch out for: never reuse a pesticide container for anything else, and never burn it. Follow the product label and local rules for rinsing, storage and disposal; the label is the legal reference.
5. Food loss on the farm and after harvest
Food loss is food that leaves the farm, or never leaves it, and is not eaten. FAO separates loss (from harvest up to, but not including, retail) from waste (at retail, in food service and at home). The farm-side examples:
- Crops left unharvested because prices are too low or labour is short
- Fruit and vegetables culled for size, shape or blemishes
- Grain spilled at harvest or spoiled in storage by moisture, insects or mould
- Milk discarded on farm, and eggs or birds lost in transport
- Trimmings, peels and pulp from packing and first processing
How much is there? FAO estimates that 13.3% of food was lost after harvest on farm, in transport, storage, wholesale and processing in 2023, up slightly from 13.0% in 2015. The FAO SDG 12.3.1 food loss indicator page shows that Northern America and Europe had the lowest regional loss, at 10.0%, while fruits and vegetables had the highest loss of any food group, at 25.4%. In the US, USDA’s Economic Research Service, for example, assumes shrinkage and loss of 2% of production for fresh cabbage in its food availability documentation, a reminder that loss rates differ a lot by crop.
What it can become. The US EPA ranks the options for wasted food in its Wasted Food Scale, which replaced the older Food Recovery Hierarchy. Preventing waste, donating food and upcycling it share the top tier, feeding animals comes next, then options such as anaerobic digestion and composting with the products used on land. Landfill and incineration sit at the bottom. On a farm that means selling or donating “ugly” produce where possible, feeding suitable culls to livestock where rules allow, and composting or digesting the rest.
Watch out for: feeding food waste to animals is tightly regulated. Some countries ban catering waste and meat products as pig feed to prevent animal disease. Check local rules before you feed any food scraps to livestock.
Chart
Food lost after harvest, by food group
Percent of production lost from farm to (not including) retail, world
Calculator: what is your manure or crop residue worth?
This calculator turns a pile of manure or a stack of straw bales into a fertilizer value per ton and for the whole load. It has no hauling input: compare the per-ton value with your own cost to load, haul and spread. Enter the nutrient content from your own lab test or from a published table, such as the Kentucky values above. Only part of the nitrogen in manure becomes available to the next crop, so the nitrogen line uses an availability percentage you set. Phosphate and potash are counted at full value here, which can overstate their worth if your soil test is already high.
Try the numbers for your own farm below.
Calculator
What is your manure or straw worth as fertilizer?
Enter your own tonnage, nutrient test results and local prices.
- Value per ton (break-even haul + spread cost): $14
- Nitrogen share of value: $275
- Phosphate share of value: $630
- Potash share of value: $540
Example values only, not a benchmark or a forecast; every number is an input. Default nutrient contents are the University of Kentucky AGR-146 (2025) book values for solid dairy manure; use your own lab test where you can. Fertilizer prices are round examples, not quotes; enter your local prices. The calculator does not subtract hauling. Compare the per-ton value with your own cost to load, haul and spread: if that cost is higher, the load is not worth moving at these prices. Phosphate and potash are counted at full value, which overstates their worth if your soil test is already high.
How to choose what to do with farm waste
There is no single best use. The right choice depends on what you have, how much, and what the land around you needs. These five steps help.
- List what you produce and when. Write down each stream: residue by field, manure by barn, plastics by type, containers by product. Note the season, since silage wrap and straw peak at different times.
- Test before you value. Send manure and soil samples to a lab. Book values are a starting point; your own numbers decide how much to spread and where.
- Use it close to home first. Wet manure and bulky residue cost a lot to move. Spreading on your own or a neighbour’s fields usually beats long hauls. Dry litter and baled straw can travel further.
- Keep streams clean and apart. Plastic in compost, or soil on film, ruins both. Separate organic waste, plastics and chemical containers at the source.
- Check rules and markets. Look up local rules on burning, manure storage, spreading dates and container disposal, and ask whether a collection scheme, digester or compost site is nearby.
▶ The benefits of mixing crops and livestock, including manure as fertilizer and crop leftovers as feed. · 2:55
How we checked the numbers
We used official and academic sources only: FAO for global food loss and plastics, Eurostat for EU waste reported by farms, the US EPA for digesters and food waste options, USDA’s Economic Research Service for a crop-level loss assumption, and the extension services of Iowa State, Ohio State and the University of Kentucky for nutrient values. Each figure keeps its year and its basis (as-is or dry matter, global or regional). Where sources measure different things, such as Eurostat’s reported waste and FAO’s food loss share, we did not add them together.
Where satellite monitoring helps
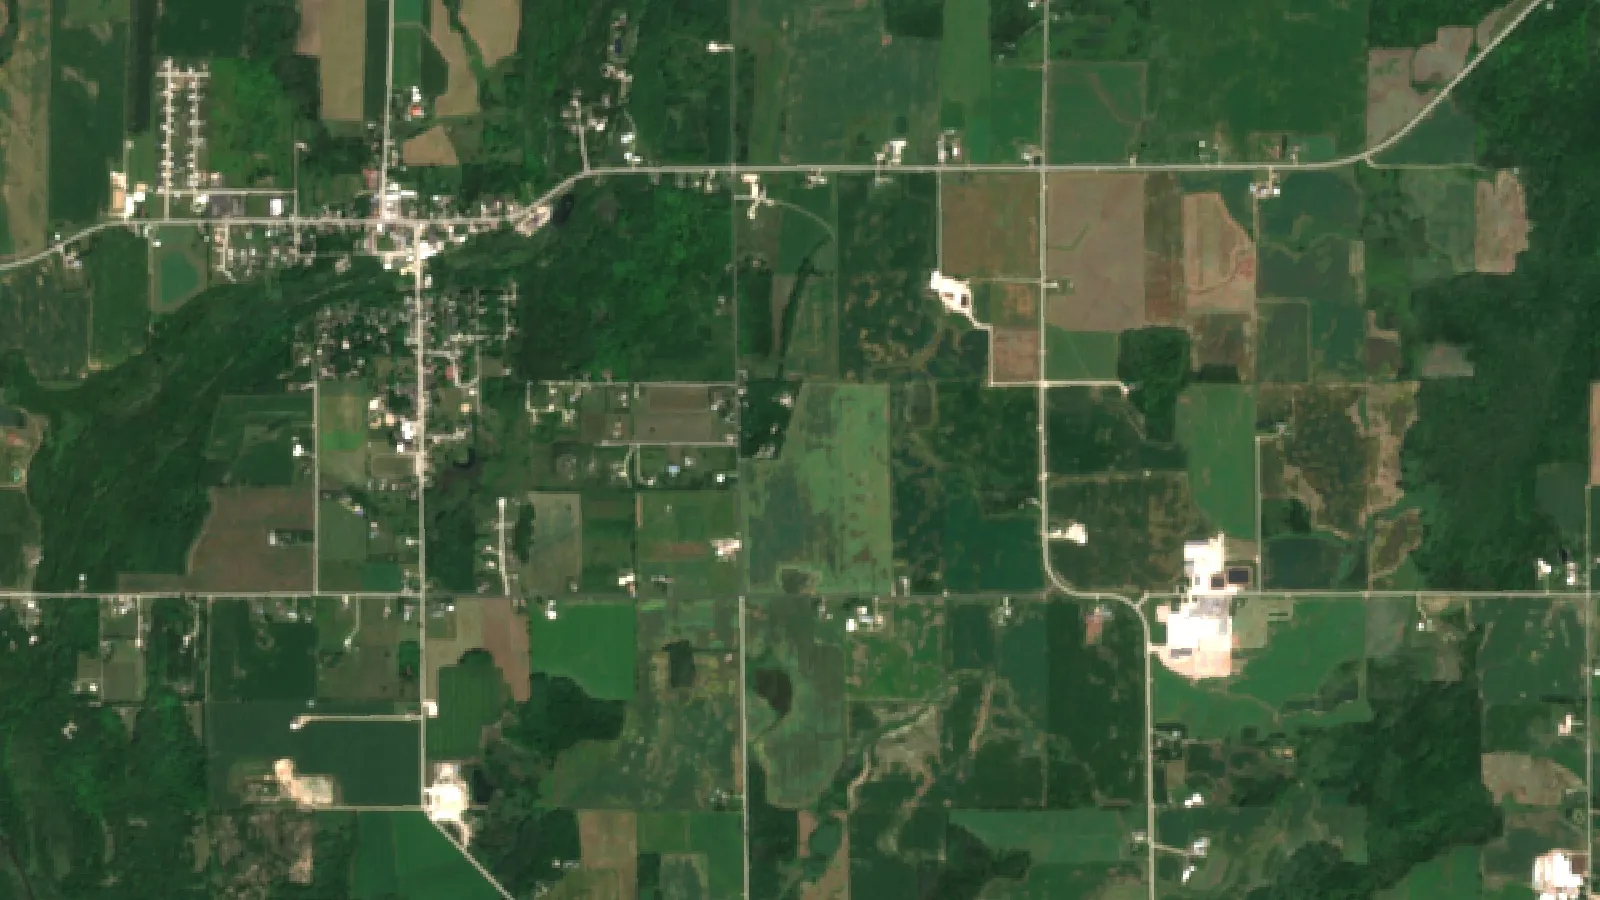
Satellite images cannot weigh a manure pile, but they can show where crops grow well and where they struggle. Comparing vegetation maps across a season helps you see which fields gain most from manure or compost, and whether a residue or cover practice changes crop vigour over time. The Farmonaut Satellite + AI Farm Monitoring System gives these field maps on web, Android and iOS.
Related pages on our site: Farmonaut home · the Farmonaut app · Agro Admin app for large farms · carbon footprinting · fleet management · product traceability · crop loan and insurance · satellite data API · API developer docs.
▶ How satellite NDVI maps show crop stress across a farm before it is visible on the ground. · 4:09
We cover a connected topic in Water Waste in Agriculture: 7 Powerful Solutions for Sustainable Farming.
FAQ
What are 5 examples of agricultural waste?
Five common examples are crop residue (straw, corn stover, husks), animal manure, plastic films and packaging, empty pesticide containers, and food lost after harvest such as culled fruit or spoiled grain. The first two are organic and can return to the soil; the last three need collection or careful handling.
What are 10 examples of farm waste?
Wheat straw, corn stalks, rice husks, orchard prunings, cattle manure, poultry litter, silage wrap, mulch film, pesticide jugs and culled vegetables. Others include bale twine, fertilizer bags, spoiled feed, milk discarded on the farm, and packing-shed trimmings.
Is manure considered agricultural waste?
It depends on how it is used. Manure spread on fields at agronomic rates is usually treated as a fertilizer. Manure that is stored badly, spread in excess or sent off the farm for disposal is treated as waste, and Eurostat reported 14.4 million tonnes of it from EU agriculture, forestry and fishing in 2022.
What is the most common agricultural waste?
By weight, crop residue and manure are the largest groups on most farms. In corn, Iowa State trials found the grain was 51% of the dry matter above ground, so the stalks and leaves left behind weigh about as much as the grain harvested.
How is agricultural waste managed sustainably?
Prevent loss first, then use organic waste on the land as mulch, compost or manure at tested rates, turn some into biogas or biochar, recycle clean plastics and rinsed containers through collection schemes, and avoid open burning. Follow local rules for each step.
Can crop residue be sold?
Yes. Straw and stover are sold as bedding, feed and biomass. When you sell it, count the nutrients that leave with it: Ohio State put the phosphate and potash in a ton of wheat straw at about $16.55 using June 2023 prices.
Farmonaut crop monitoring
See your own fields from space
Draw your fields once and Farmonaut shows satellite vegetation maps for them through the season, on web, Android or iOS.




Keep reading
Sources
- FAO, Assessment of agricultural plastics and their sustainability: a call for action (2021): fao.org
- FAO, SDG indicator 12.3.1 global food losses (data portal, 2025 update): fao.org
- Eurostat, Generation of waste by waste category, hazardousness and NACE Rev. 2 activity (env_wasgen), 2022: ec.europa.eu
- Eurostat, Waste statistics, Statistics Explained (2022 data): ec.europa.eu
- US EPA, AgSTAR data and trends (2024): epa.gov
- US EPA, AgSTAR Livestock Anaerobic Digester Database: epa.gov
- US EPA, Wasted Food Scale: epa.gov
- USDA Economic Research Service, Food Availability Data System documentation: ers.usda.gov
- University of Kentucky Cooperative Extension, AGR-146 Using animal manures as nutrient sources (revised 2025): publications.ca.uky.edu
- Iowa State University Extension, Nutrient removal when harvesting corn stover: crops.extension.iastate.edu
- Ohio State University, C.O.R.N. newsletter: Nutrient value of wheat straw (2023): agcrops.osu.edu
- Virginia Tech, Average nutrient analysis of manures (SPES-299): pubs.ext.vt.edu
Discussion
Questions, corrections or field experience? Share them below. First-time comments are reviewed before they appear, and your email is never published.
No comments yet. Be the first to add a question or your experience.

 FCF India
 Rashail Infotech
 Unifrutti Gulf
 Deluxe Conseil
 TVS Electronics
 BW Pipelines
 WICO
 Gen Chayat
 Chimera Innovation
 SkyHarvest
 Polaris Digitech
 Teledarbas
 Wild Oak Farm
 SFX
 Doodlakine
 Exurbia Geospatial

 Licence holder · Niger · Gold










