

Reviewed August 2026 against USDA’s National Agricultural Statistics Service, USDA’s Economic Research Service, and USDA’s Crop Production Report.
Try it: Run your own numbers →



What Is Yield Monitoring?
Yield monitoring is the practice of measuring crop output — bushels, tonnes, or kilograms — continuously as a combine harvests, using a flow sensor and GPS receiver to log exactly how much grain came off exactly which patch of field. The output is a yield map: a georeferenced grid showing where the field produced more and where it produced less, down to a few meters of resolution. It is not the same as a farm monitoring system, which is the broader category covering soil sensors, satellite crop-health tracking, weather stations, and — on livestock operations — animal health monitoring. Yield monitoring is one input into that larger agriculture monitoring system, specifically the one that tells you the financial result of everything else you measured that season.
By the end of 2023, 60% of US corn and soybean producers were using yield monitoring systems on their commodity crops, according to USDA’s National Agricultural Statistics Service (USDA NASS, Guide to Agricultural Yield Surveys). That figure covers the two crops where yield monitors are most standardized — combine-mounted grain flow sensors are mature technology for corn and soybeans specifically, which is why NASS tracks adoption there rather than across all commodity types.
Agriculture Monitoring System: The Broader Picture
An agriculture monitoring system combines sensors, satellite imagery, weather data, and analytics software to track the variables that determine a season’s outcome: soil moisture, crop vigor, pest pressure, weather risk, and — where livestock is part of the operation — animal health. Yield monitoring closes the loop by confirming which of those interventions actually paid off at harvest. A farm running a full agricultural monitoring stack uses yield maps to validate its in-season NDVI readings, soil moisture logs, and variable-rate application records against real tonnage, not projected tonnage.
Satellites form the other half of this toolkit, and our overview of how remote crop monitoring works walks through the indices involved and what they cost.
USDA’s Economic Research Service reported that 27% of all US farms used some form of precision agriculture — GPS guidance, yield mapping, variable-rate technology, or soil/yield mapping — to manage crops or livestock in 2023 (USDA ERS, 2023). That 27% farm-level figure and the 60% corn/soybean-producer figure describe different populations — the smaller number spans every farm type in the country, including operations where yield monitoring makes little sense (pasture, orchards, vegetables); the larger number is scoped to row-crop growers where combine-based yield monitors are the norm. Neither number should be read as “adoption of yield monitoring specifically” across all of agriculture — that all-farm figure is one of the gaps in current public reporting, addressed below.

Components of a Yield Monitoring and Farm Monitoring System
A working system layers several instruments, each answering a different question:
- Combine-mounted yield monitors: A flow sensor measures grain mass moving through the clean-grain elevator; a GPS receiver timestamps and geolocates each reading. Together they build the yield map field-by-field, pass-by-pass.
- Soil moisture sensors: These measure volumetric water content at set depths, feeding irrigation scheduling decisions before the crop shows visible stress.
- Satellite and drone imagery: Multispectral imagery tracks vegetation vigor across a field between harvests, filling the gap between planting and the yield monitor’s one-time-per-season reading.
- Weather stations: Automated stations log temperature, humidity, wind speed, solar radiation, and precipitation, supporting both irrigation and harvest-timing decisions.
- Livestock monitoring hardware: On mixed operations, a cow monitoring system uses IoT ear tags or collars to track activity, rumination, and body temperature, flagging illness or estrus days before a visual check would catch it.
These layers, properly integrated, form the smart agriculture stack that most large US, UK, and Australian operations are now assembling piece by piece rather than buying as one bundled product.

Yield Monitoring in NSW and Other Grain Regions
New South Wales is one of Australia’s largest winter-cropping regions, and grain growers there use the same class of hardware as their US counterparts: combine (header)-mounted flow sensors paired with GPS, producing a yield map at harvest for wheat, barley, and canola paddocks. The mechanics don’t change across borders — a flow sensor measuring grain mass and a receiver logging position work identically whether the crop is Illinois corn or Riverina wheat. What changes is the reporting infrastructure: Australian growers benchmark seasonal yield performance against the ABARES Crop Report, published monthly by the Australian Bureau of Agricultural and Resource Economics and Sciences, rather than USDA’s release calendar. If you farm in NSW or elsewhere in Australia and want a current-season national yield comparison, ABARES’ monthly release — not a US figure — is the right benchmark to check.
Because no single public dataset in this brief separately reports NSW-specific yield monitor adoption, the honest position is: adoption mechanics mirror the US pattern documented above (flow sensor plus GPS, validated at harvest against a yield map), but a distinct NSW percentage is not available from the sources reviewed here. Growers wanting that number should check the ABARES report directly for the current release.
What Yield Monitoring Actually Measures — With Current US Benchmarks
To make “what is yield monitoring” concrete: it measures output per unit area, and the current national averages give a sense of scale. USDA’s Crop Production Report puts the 2025 US corn yield average at 186.5 bushels per acre and the 2025 US soybean yield average at 53.0 bushels per acre (USDA Crop Production Report). A yield monitor doesn’t just confirm the field-average number — it shows a grower which 2-acre patches came in at 220 bushels and which came in at 140, which is the information a single end-of-season total can never provide.
USDA’s Crop Production Report is released quarterly — March, June, August, and November — so the 186.5 and 53.0 figures above are current as of the report cited and will be superseded at the next release. Check esmis.nal.usda.gov directly for the latest published report month before citing these numbers as current.

How a Crop Monitoring System Extends Yield Data Through the Season
A yield monitor tells you what happened at harvest. A crop monitoring system tells you what’s happening right now, so you can still act on it. The two are complementary, not competing:
- Continuous data flow: IoT-enabled sensors and satellite passes report field conditions in-season, well before the combine ever enters the paddock.
- Predictive analytics: Software flags stress, nutrient deficiency, or disease risk from imagery and sensor trends, well ahead of a visible symptom.
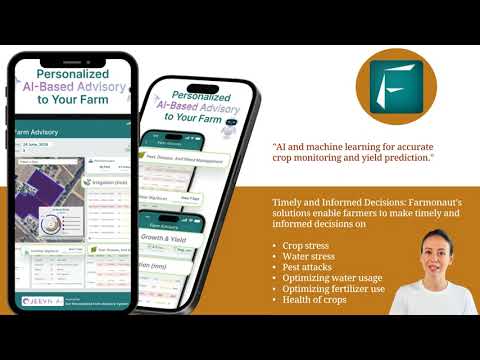
- Farmonaut’s Jeevn AI Advisory System issues satellite-driven recommendations on irrigation, fertilization, and pest management through its mobile and web apps.
- Remote imaging: Drone and satellite passes catch pest, disease, or deficiency patterns across a whole field, not just the rows a scout happened to walk.
- Traceability: Farmonaut’s Traceability Solution uses blockchain to keep the chain of data — from field to buyer — verifiable and tamper-resistant.
The link between in-season crop monitoring and end-of-season yield is not theoretical. USDA’s 2025 Crop Production averages above (186.5 bu/acre corn, 53.0 bu/acre soybean) are the outcome that in-season monitoring is trying to protect or improve — a yield monitor is simply the instrument that later confirms whether it worked on a given field.
What Precision Agriculture Practices Are Worth in Yield Terms
The Global Agricultural Productivity Initiative at Virginia Tech reports that precision agriculture practices — GPS guidance, drone imagery, and IoT sensor networks together — deliver a 20–30% average yield improvement over conventional management, based on data reviewed for 2024–2025 (Global Agricultural Productivity Initiative, Virginia Tech). That range describes the full precision-ag bundle, not yield monitoring in isolation — no source reviewed here isolates the yield contribution of the yield monitor alone versus the sensors and imagery it’s typically paired with, which is a genuine gap in current public research rather than something this article can responsibly narrow further.
Through Farmonaut’s satellite-based soil moisture assessment, delivered to phone or desktop, growers get the historical and daily moisture trend data that feeds precision irrigation decisions without installing in-ground hardware across every field.
For developers and agribusinesses, Farmonaut’s Monitoring API provides programmatic access to satellite soil moisture, weather, and crop health data for integration into any farm management platform.
Read more or try Farmonaut Satellite Monitoring API
Real-Time Crop Health Monitoring and Early Detection
Knowing the condition of every part of a field, continuously, is the practical goal of any agricultural monitoring system. Three components do the work:
- Normalized Difference Vegetation Index (NDVI): Multispectral satellite data tracks vegetation stress, chlorophyll content, and crop vigor across the whole field, not just sampled points.
- Early detection: Imagery-based models highlight problem zones — drought stress, disease, nutrient deficiency — before they’re visible from the field edge.
- Personalized recommendations: Farmonaut’s Jeevn AI translates imagery and sensor trends into specific, timed actions on fertilizer, water, or pest treatment.
This is where crop monitoring earns its keep against yield monitoring’s after-the-fact view: it lets a grower intervene while the season is still salvageable, rather than only learning the outcome once harvest is complete.
Yield Mapping with Drone and Satellite Imaging
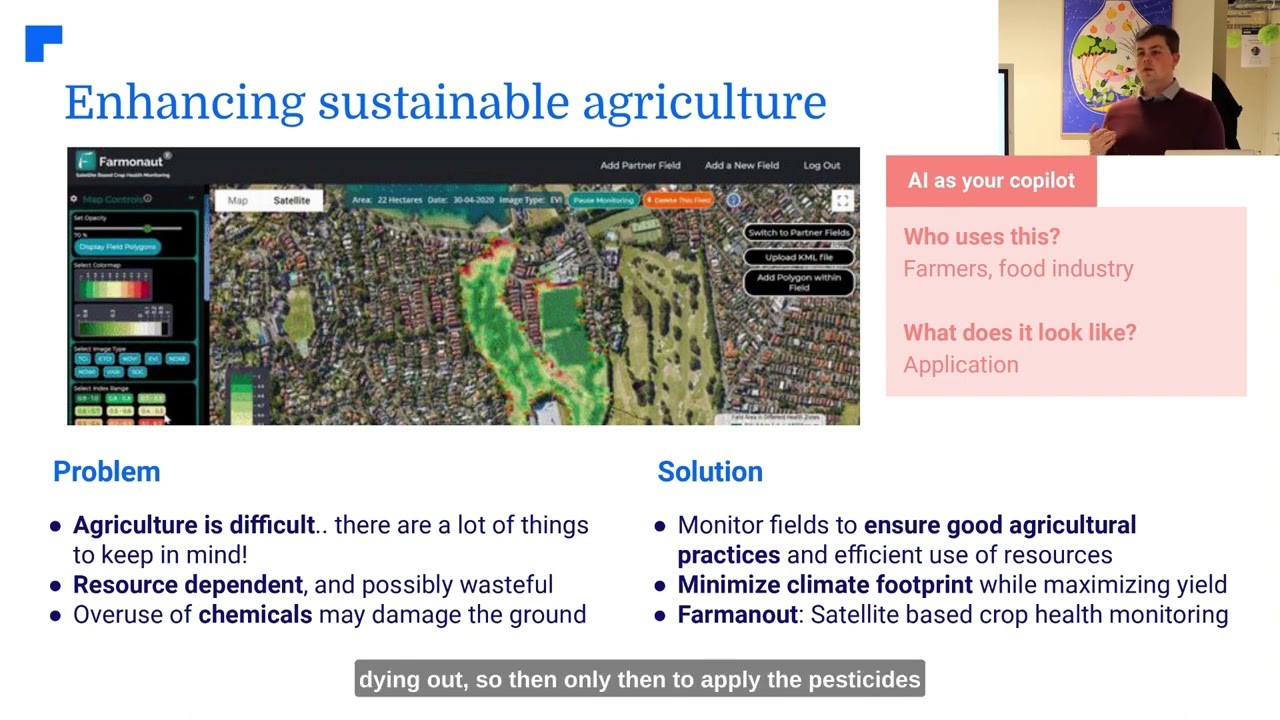
Yield mapping overlays the combine’s GPS-tagged flow-sensor readings onto a field map, showing exactly where output was strong and where it lagged. Satellite revisit imagery extends that same georeferenced logic earlier in the season — before the combine ever runs — by tracking vigor trends against the same field grid. Together they let a grower:
- Compare in-season vigor readings against the eventual harvest result, field zone by field zone
- Target variable-rate water, fertilizer, and pest-control applications to where the data — not a blanket assumption — says they’re needed
- Plan next season’s input and seed-rate decisions from a documented record instead of memory
Farmonaut’s platform provides automated growth assessment using frequent satellite revisits, usable on isolated fields and large-scale operations alike, without waiting for a drone flight window.
Weather-Based Farm Monitoring and Automation
Weather risk is one of the largest swing factors in any yield outcome, which is why farm monitoring systems in the US, UK, and Australia increasingly bundle weather stations with crop and soil sensors. With IoT in agriculture, growers get:
- Hyper-local, automated readings on temperature, humidity, precipitation, wind speed, and solar radiation
- Earlier warning on disease-conducive conditions and irrigation timing
- Better-timed planting, spraying, and harvest scheduling around forecast windows
Farmonaut delivers weather forecasts and insights through its platform, and that same weather record supports financial verification: Farmonaut’s Crop Loan & Insurance Verification helps lenders confirm crop conditions and process support faster.

Cow Monitoring Systems on Mixed and Livestock Operations
On operations that run cattle alongside row crops — common across the US Midwest, UK dairy country, and Australian grazing regions — a cow monitoring system extends the same real-time-data logic from field to herd. Ear-tag or collar sensors track activity level, rumination time, and body temperature continuously, and flag deviations that indicate illness, lameness, or estrus days earlier than a visual herd check typically would. Paired with barn or paddock environmental sensors tracking temperature, humidity, and air quality, these systems reduce disease outbreaks and cut the labor cost of manual health checks across a large herd.
No figure in the sources reviewed for this article breaks out cow monitoring adoption specifically by country — this is a gap rather than an omission, and a grower evaluating a system should request outbreak-detection lead-time data directly from the vendor rather than rely on an industry-wide adoption percentage that doesn’t yet exist in public reporting.
Sustainable Resource and Carbon Tracking
The same sensor and imagery infrastructure that drives yield gains also supports emissions accounting, which is increasingly a compliance requirement rather than a bonus feature. A monitoring system lets an operation:
- Track water and chemical input usage against actual crop need rather than a blanket schedule
- Measure emissions and align operations with buyer or regulatory sustainability requirements
- Document input reductions with a verifiable record rather than an estimate
Farmonaut’s Carbon Footprinting Tool lets operations assess, manage, and report emissions in real time.
- Running large operations or agribusiness fleets? See Farmonaut Fleet Management for resource allocation across equipment.
- For multi-field oversight, Large Scale Farm Management by Farmonaut brings analytics and reporting to every hectare under administration.
Comparative Table: Monitoring System Types and What Each One Confirms
No single tool covers everything a farm needs to track — each one answers a specific question, and most working operations run several in combination:
| System Type | What It Measures | When It Reports | Typical User |
|---|---|---|---|
| Combine yield monitor | Grain mass per GPS-tagged field position | At harvest only | Row-crop growers (corn, soybean, wheat, canola) |
| Satellite/drone crop monitoring | Vegetation vigor, NDVI, stress signals | Every satellite revisit (days, not months) | Any crop grower wanting in-season visibility |
| Soil moisture sensors | Volumetric water content by depth | Continuous / real-time | Irrigated operations |
| Weather stations | Temperature, humidity, wind, precipitation, solar radiation | Continuous / real-time | All field operations, especially disease-risk crops |
| Cow monitoring system | Activity, rumination, body temperature | Continuous / real-time | Dairy and beef operations |
How Farmonaut Fits Into a Monitoring Stack
Farmonaut’s role is specifically the satellite and AI-advisory layer — the part of the stack that fills the gap between planting and the combine’s yield monitor readings, without requiring a network of in-field hardware.
- Satellite-based monitoring: Farmonaut integrates satellite crop health tracking, soil moisture retrieval, weather analytics, and AI-powered advisory without on-field sensor installation.
- Crop health data: NDVI, moisture, and growth metrics mapped onto fields, accessible from Android, iOS, and web apps.
- AI-driven advisory: Jeevn AI issues field-specific recommendations for irrigation, fertilization, and pest response.
- Blockchain traceability: Transparent, verifiable data from farm to buyer via the Traceability Solution above.
- Fleet and resource management: Asset tracking for reduced downtime and better deployment.
- Carbon footprinting: Emissions quantification and reduction tracking.
The subscription model is scaled for individual growers, cooperatives, and larger operations — on mobile, web, or via API — so the entry point matches farm size rather than requiring a large upfront hardware purchase.
How to Verify Current Figures Yourself
Every figure in this article carries a vintage, and each one has a public refresh path so a reader can pull a more current number at any time:
- US corn and soybean yields: USDA’s Crop Production Report releases in March, June, August, and November each year. Check esmis.nal.usda.gov for the latest report month.
- Australian crop forecasts, including NSW: ABARES publishes its Crop Report monthly, with in-season updates through April. Check agriculture.gov.au/abares for the current release.
- Global yield and productivity outlooks: The OECD-FAO Agricultural Outlook refreshes every June; the next edition, covering 2027–2037 projections, publishes in June 2027.
- US precision agriculture and yield monitor adoption: USDA’s Economic Research Service and National Agricultural Statistics Service both update adoption figures periodically — check ers.usda.gov and nass.usda.gov directly for the current release.
This four-source check is the durable method: whatever the numbers are when you’re reading this, the same four release calendars will still get you the current figure.
Yield Monitor Data Density Calculator
Use this to see how many yield data points your own field generates per pass, based on your header width and GPS logging interval — the resolution that determines how finely your yield map can actually detect in-field variation.
Run your own numbers
Assumptions: straight-line passes at constant speed with no overlap or headland turns counted; actual field data density is lower once turns, overlap, and terrain are included. This estimates raw logging resolution only — it does not model yield accuracy, calibration error, or grain flow lag.
Frequently Asked Questions: Yield Monitoring and Agriculture Monitoring Systems
What is yield monitoring?
Yield monitoring is the use of a combine-mounted flow sensor and GPS receiver to measure and geolocate grain output continuously during harvest, producing a yield map that shows output variation across a field. It's a harvest-time measurement, distinct from in-season crop monitoring, which tracks vigor and stress before harvest.
What's the difference between a yield monitoring system and a crop monitoring system?
A yield monitoring system measures actual output at harvest. A crop monitoring system — using satellite imagery, soil sensors, and weather data — tracks field conditions throughout the season so growers can act before harvest. Most working operations use both: crop monitoring to manage the season, yield monitoring to confirm the result.
How many US farms use yield monitoring or precision agriculture?
By the end of 2023, 60% of US corn and soybean producers used yield monitoring systems, per USDA's National Agricultural Statistics Service. Across all US farms and all forms of precision agriculture, USDA's Economic Research Service put adoption at 27% in 2023. These are different populations — the first is scoped to row-crop growers, the second spans every US farm type.
Is there a yield monitoring adoption figure specific to NSW or Australia?
Not in the public sources reviewed for this article. Australian growers, including those in NSW, use the same flow-sensor-plus-GPS hardware as US operations; for current-season national yield benchmarks, ABARES' monthly Crop Report is the relevant source, not a US percentage.
What is a cow monitoring system?
A cow monitoring system uses ear-tag or collar sensors to track cattle activity, rumination time, and body temperature, flagging illness, lameness, or estrus earlier than a manual visual check typically would. It's the livestock equivalent of crop-side environmental sensors, applied to herd health rather than field conditions.
How does Farmonaut differ from a hardware-based yield monitoring system?
Farmonaut doesn't replace a combine's yield monitor — it fills the in-season gap before harvest, using satellite imagery and AI-based advisory instead of installed field hardware. It's the crop-monitoring layer of a stack that a combine's yield monitor completes at harvest.
How can I integrate yield or crop monitoring data with my own software?
Farmonaut provides an API and Developer Documentation for integrating satellite and weather data into other platforms.
Does farm monitoring extend to forestry and multi-crop operations?
Yes. Farmonaut's platform supports crops, plantation, forestry, and resource management across a range of agricultural and environmental applications.
Conclusion: Reading Yield Data Correctly
Yield monitoring answers one specific question — how much did this exact patch of field produce — and it does that well, at the resolution a flow sensor and GPS can deliver. It cannot tell a grower what's happening mid-season, which is what satellite and sensor-based crop monitoring is for, and it says nothing about herd health, which is what a cow monitoring system covers. The three are complementary layers of one agriculture monitoring system, not competing products, and the right stack depends on what's being grown and where.
The adoption numbers in this article — 60% of US corn/soybean growers using yield monitors, 27% of all US farms using some precision agriculture, per USDA — will move as USDA releases new survey rounds. The 186.5 and 53.0 bushel-per-acre national averages will be superseded at the next Crop Production Report. None of that changes the method: check the same release calendars listed above, and you'll always have the current figure rather than this article's.
Ready to add the in-season layer? Try Farmonaut today!

 Patrick America
 Red Dog Management
 Liquify Digital
 Ascentya
 CU Foods
 BeyondTech Global
 Rouge VC
 AgroGreen Dynamics
 AgroRisk
 Oath Inc
 Reddane Farming
 Esri North East Africa
 Cresol
 MDCV UK
 Zerella Group
 Etech Consulting Madagascar
 Vestlandsforsking
 Delicio
 WB Dev
 Sama Premium
 Prochecker
 Tres Valles
