

Farming systems · Method comparison
Farming Methods: 10 Compared With USDA Adoption Data
The 10 main farming methods run from traditional and organic to precision and vertical. No method wins on every measure, and many farms combine two or three. Here is what each needs, how many US farms use it where a count exists, and a calculator to test a change.
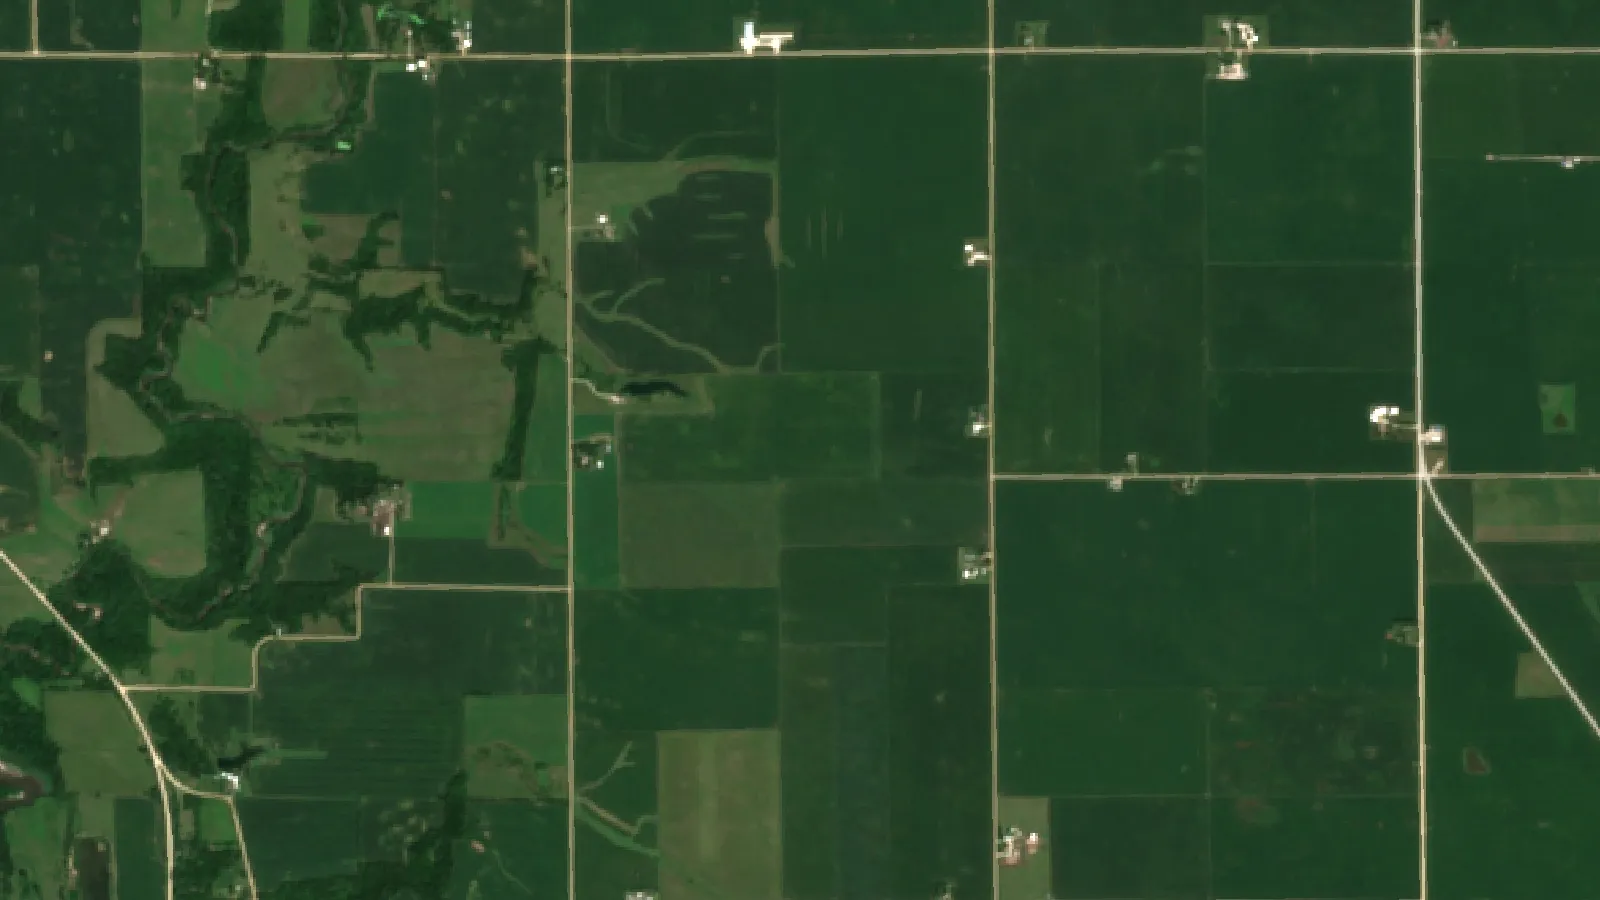
Key takeaways
- No-till led the methods compared here in the 2022 Census: 300,954 farms on 105.2 million acres.
- The 2025 organic survey counted 17,949 certified farms, 4.8 million acres and $14.3 billion in sales (USDA NASS, October 2026).
- Precision practices reached 226,092 farms in 2022, about 12% of US farms, but autosteering was on 70% of large-scale crop farms in 2023 (USDA ERS).
- Agroforestry was reported by 32,717 US farms in 2022, or 1.7% of all farms (US Forest Service analysis).
- Trade-offs are real: organic yields averaged 19.2% below conventional in one 115-study analysis (Ponisio et al., 2015).
In this article
- The 10 farming methods compared
- 1. Traditional farming: low-input methods
- 2. Modern intensive farming: high output per acre
- 3. Organic farming: the certified method
- 4. Agroforestry: trees with crops and livestock
- 5. Hydroponics and aquaponics: soil-less systems
- 6. Conservation agriculture: minimal soil disturbance
- 7. Precision farming: data-driven agriculture
- 8. Mixed farming: crops and livestock together
- 9. Vertical farming: stacked indoor production
- 10. Permaculture: design for self-maintaining systems
- Water-saving methods in rice: AWD and direct seeding
- What the evidence says on yield, water and cost
- How to choose among farming methods
The 10 main farming methods are traditional, modern intensive, organic, agroforestry, hydroponics and aquaponics, conservation agriculture, precision farming, mixed farming, vertical farming and permaculture. No single method is best. Many working farms combine two or three, and the right mix depends on your land, your water, your market and how much capital you can tie up.
This guide compares all 10 methods of farming on the same points: what each one requires, what it costs in inputs, how many US farms use it where a count exists, and where it fits. The counts come from the 2022 Census of Agriculture, the 2025 Certified Organic Survey (released 30 October 2026), USDA Economic Research Service (ERS) reports and a US Forest Service analysis. A calculator lets you test whether a change of method would pay on your own numbers.
The 10 farming methods compared
The table lines up each method on inputs, scale and the most recent US count. The count measures farms or operations, and each row names its survey year. A farm can appear in several rows, because these methods overlap.
| Method | Core idea | Input level | Fits | Latest US measure |
|---|---|---|---|---|
| Traditional | Farm-made fertility, manual or animal power | Low | Small acreage | No census category |
| Modern intensive | Hybrid seed, fertilizer, pesticides, machinery | High | Large row-crop farms | No census category |
| Organic | Certified; no synthetic inputs in most cases | Medium | Small to large | 17,949 farms, 4.8 million acres (2025) |
| Agroforestry | Trees with crops or livestock | Medium | Small to large | 32,717 farms (2022) |
| Hydroponics, aquaponics | Soilless, recirculating water | High | Limited land, cities | Part of 2,994 controlled environment operations (2019) |
| Conservation | Low disturbance, soil cover, diverse crops | Medium | Small to large | 300,954 farms on no-till (2022) |
| Precision | Field data, guidance, variable rates | High | Larger farms first | 226,092 farms (2022) |
| Mixed | Crops and livestock on one farm | Medium | Small to large | No census category |
| Vertical | Stacked layers indoors | Very high | Cities, leafy crops | Part of 2,994 controlled environment operations (2019) |
| Permaculture | Perennial design that copies natural systems | Low to medium | Small to medium | No census category |
Input levels in the table are our own plain-English grouping, not a USDA rating. Blank spots in the data matter too. The census has no line for traditional, intensive, mixed or permaculture farming, so any national percentage for those deserves a second look. Agroforestry is different: the census does ask about it, and a Forest Service team published the state-by-state results.
Chart
US farms reporting each measured method
Number of farms or operations; latest year available for each, so years differ
1. Traditional farming: low-input methods
Best for: small diversified farms, direct-market growers and land where purchased inputs do not pay.
Traditional farming relies on human and animal labor, farmyard manure, compost and local knowledge in place of purchased inputs. In the US it survives mostly in niches, such as small diversified farms and some Amish and Mennonite operations. It has no census category of its own. Small family farms are a much wider group: USDA ERS counted 86% of US farms as small family farms in 2023, but many of them use modern inputs.
- Labor: people and draft animals do more of the cultivation, sowing and harvest.
- Fertility: manure, compost and green manure replace most bought fertilizer.
- Risk spread: rotation, intercropping and mixed cropping guard against losing a whole crop.
- Knowledge: farmers carry site-specific skills from one generation to the next.
The trade-off is output per hour of work. USDA publishes no national yield comparison, since “traditional” is not a survey category, so be wary of exact claims. On a US farm the method often works as a base layer under something else: organic certification, reduced tillage or a small crop-livestock system.
2. Modern intensive farming: high output per acre
Best for: large row-crop farms with access to credit, machinery and commodity markets.
Modern intensive farming aims for the most output from the land through hybrid seed, fertilizer and pesticide programs and heavy machinery. Corn, soybeans, wheat and cotton grown at scale with tractors, planters, combines and often irrigation are the usual picture. Large-scale family farms produced 48% of the value of US farm production on 31% of agricultural land in 2023, according to the same ERS report. That is a measure of farm size, not of method, but it shows where scale sits.
- Seed: varieties bred to respond to inputs.
- Fertilizer and pest control: consistent at scale, but timing and rate decide whether money and nutrients are lost. Check the product label and local rules.
- Machinery: tractors, combines and pivot or drip irrigation replace most hand work.
- Weak points: soil loss, nutrient runoff and falling water tables if no conservation practice is added.
Few big farms run this method alone now. Many add guidance and variable-rate tools (method 7) and reduced tillage (method 6) on top of it. Farmonaut’s satellite vegetation maps are one way to see which parts of a field are lagging before the yield monitor confirms it at harvest.
▶ How NDVI maps show crop stress across a large corn farm. · 4:09
3. Organic farming: the certified method
Best for: farms with a premium market within reach and the patience for a transition period.
Chart
US certified organic sales by survey year
Billion US$ of certified organic commodities, nominal, selected surveys
Organic farming avoids most synthetic inputs and GMOs and relies on rotation, compost, manure and biological pest control. Because certification is federally regulated, it has some of the firmest numbers of any method here. The 2025 Certified Organic Survey, released on 30 October 2026, counted 17,949 farms on 4.8 million certified acres, with sales of $14.3 billion. Compared with the 2021 USDA NASS Organic Survey, farms rose 3%, land fell 2% and sales rose 28%.
That acreage is small against the 880 million acres of US land in farms in the 2022 Census: about 0.5%, though the two figures come from different years. Sales are also concentrated. Farms selling $500,000 or more were 22% of organic farms but took 88% of organic sales in 2025. Field crops fell 6% in value from 2021, while vegetables in the open rose 59%, so the growth is not spread evenly.
Plan for the wait. US rules require that land has had no prohibited substances applied for 3 years immediately before an organic harvest, so you carry organic-style costs before you get an organic price. In the 2025 survey, certified farms reported another 147,849 acres in transition, and 25% of them planned to increase organic production in the next five years, against 53% who planned to hold steady. Other countries have their own rules, so check with your local certifier.
- Pest control: beneficial insects, resistant varieties and planned planting locations.
- Fertility: animal manure and green manure, the practices organic farms reported often in the 2025 survey.
- Rotation: breaks pest and disease cycles and balances nutrients.
- Records: certification needs an audit trail, and product traceability tools can help with supply-chain records.
The yield trade-off is documented. A meta-analysis of 115 studies found organic yields 19.2% (plus or minus 3.7%) below conventional yields (Ponisio et al., 2015). The same study found the gap narrowed to about 9% with multi-cropping and 8% with crop rotation, when those practices were used in both systems, so treat 19% as a starting point, not a forecast. For the practices and rules in more detail, see our guide to methods of organic farming.
4. Agroforestry: trees with crops and livestock
Best for: farms with erosion, wind or shade problems, and owners who can wait years for tree income.
Agroforestry puts trees or shrubs on the same land as crops or animals. USDA’s National Agroforestry Survey lists five practices: windbreaks, silvopasture, riparian forest buffers, alley cropping and forest farming.
The US does have a count. A Forest Service analysis of the Census of Agriculture found 32,717 farm operations practicing agroforestry in 2022, or 1.7% of all farms, up 6% from 30,853 in 2017. Vermont (7.8%), Maine (6.0%) and New Hampshire had the highest shares of farms. Worldwide the picture is far larger: FAO estimates agroforestry is found on more than 43% of agricultural land.
- Soil: deep roots hold soil and add organic matter over time.
- Erosion: windbreaks and streamside buffers slow wind and water.
- Habitat: layered planting gives pollinators and wildlife more cover.
- Income: nuts, fruit, timber, fodder or honey can come from land that also grows a crop or feeds stock.
- Shelter: shade and wind protection reduce heat stress on animals.
The catch is time. Trees compete with crops for light and water, and tree income can take years to arrive. Landowners interested in the climate side can read about carbon footprinting, but carbon payment rules differ widely, so get professional advice before you count on that income.
5. Hydroponics and aquaponics: soil-less systems
Best for: high-value leafy crops, herbs and tomatoes near buyers, where land or water is short and power is affordable.
Hydroponics grows plants in a nutrient solution with no soil. Aquaponics joins that to fish tanks, so fish waste feeds the plants and the plants clean the water. USDA ERS Economic Information Bulletin 264 (January 2024) counted 2,994 US controlled environment operations in 2019, nearly three times the 1,015 of 1998. More than 60% of the tomatoes, cucumbers and lettuce grown in those systems in 2019 were hydroponic.
- Root-zone feeding: nutrients go directly to the roots.
- Water: closed loops reuse water that field crops would lose.
- Season: climate control frees the crop from the outdoor calendar.
- Aquaponics: two products, plants and fish such as tilapia or catfish, but two living systems to keep in balance.
The water saving comes with a power bill. A modelled comparison of lettuce in Yuma, Arizona, found hydroponics used about 13 times less water per kilogram and gave about 11 times the yield per area, but needed about 82 times more energy per kilogram (Barbosa et al., 2015). Those are engineering estimates for one crop and place, so ask a supplier for figures for your crop, system and climate. Operators running several sites may also want to read about large-scale farm administration.
6. Conservation agriculture: minimal soil disturbance
Best for: row-crop and grain farms with erosion or moisture problems, especially in dry areas.
FAO defines conservation agriculture by three principles: minimum soil disturbance, permanent soil cover and a diverse mix of plant species. This conservation farming method has the deepest crop-by-crop data of any on this list, because ERS has tracked tillage for decades.
In ERS survey data charted in 2022, with the latest survey year differing by crop, farmers reported conservation tillage on 68% of wheat acres, 76% of corn and 74% of soybeans, but only 43% of cotton. No-till alone has grown: corn went from 16% of acres in 2001 to 36% in 2021, and wheat from 20% in 2004 to 45% in 2017. If you grow cotton, see our guide to cotton soil types.
How US cropland was tilled in the latest Census
The ERS figures are by crop. The 2022 Census of Agriculture, Table 47 gives one national snapshot across all cropland that year.
| Practice | Farms | Acres |
|---|---|---|
| No-till | 300,954 | 105.2 million |
| Reduced tillage | 228,221 | 97.1 million |
| Intensive tillage | 263,512 | 73.4 million |
| Cover crops | 153,328 | 18.0 million |
Reduced tillage in this table excludes no-till, and cover crops exclude Conservation Reserve Program land. Cover crop area rose from 15.4 million acres in 2017 to 18.0 million in 2022, but it is still far behind no-till. Of these census measures, cover crops have the least area, though crop residue also counts as soil cover and this table does not measure it.
What about yield? A global analysis of 610 studies found that no-till on its own reduces yields, but the loss shrinks when it is combined with residue retention and rotation. With all three principles, rainfed yields rose significantly in dry climates (Pittelkow et al., 2015). The method needs the whole package to do its best work.
- Less tillage: protects soil structure and improves water entry.
- Soil cover: cover crops and residue protect the surface between cash crops.
- Rotation: ERS says rotations can improve soil nutrient levels and break pest cycles. Its Crop Sequence Boundaries dataset shows field-level rotation patterns.
For the water side of soil management, see our notes on water harvesting and efficient irrigation.
Chart
US cropland by tillage practice and cover crop
Million acres, 2022 Census of Agriculture
7. Precision farming: data-driven agriculture
Best for: farms with uneven fields and enough acres to spread the fixed cost.

▶ Six plain steps to start precision agriculture without buying a robot. · 4:18
Precision farming, also called smart farming, uses satellite images, drones, sensors, yield maps and guidance to manage parts of a field differently, not the whole field at one rate. The 2022 Census of Agriculture counted 226,092 farms using precision agriculture practices, about 12% of the 1.9 million US farms.
Uptake climbs steeply with farm size. USDA ERS, America’s Farms and Ranches at a Glance (December 2024), reports that in 2023 guidance autosteering was on 9% of small, 52% of midsize and 70% of large-scale crop farms. Variable rate technology, which changes seed or input rates across a field, was on 5%, 32% and 45%. ERS adds that yield monitors, yield maps or soil maps were on 68% of large-scale crop farms, and it lists higher yields, labor savings and lower input costs among the common reasons for adopting. Drones stayed at about 12% of large-scale crop farms.
- Field monitoring: NDVI (Normalized Difference Vegetation Index) maps from satellites or drones show where plant growth differs. They show that a change happened, not its cause, so a field check still matters.
- Variable rate: applies water, seed or fertilizer by zone.
- Guidance: reduces overlap and operator fatigue.
- Yield maps: build a record of which zones pay.
Machinery is often the biggest cost here, and our pages on farm equipment and tools and fleet management cover that side. Start with one question, such as which field zone loses money, before you buy hardware.
Chart
Precision tools by farm size
Percent of crop-producing farms in each size group, 2023
8. Mixed farming: crops and livestock together
Best for: farms with pasture or forage ground, and owners who want two income streams.
Mixed farming combines crops and livestock on one operation. It is one of the oldest methods of agriculture and has no line of its own in USDA statistics, because the census reports crop acres and livestock inventory separately.
- Nutrient recycling: manure returns to the land and can reduce fertilizer purchases.
- Income spread: when drought or disease hits a crop, livestock sales can still bring money in.
- Feed: crop residue and cover crops can feed animals.
- Costs: two enterprises need fencing, water, more skills and more labor at peak times.
The management load is the usual reason farms specialize. A mixed farm also has a smaller scale in each enterprise, so it may pay more per unit for inputs and sales. Run the numbers on each enterprise separately before you add the second one. Nutrient planning needs care too: manure rules vary by state and country, so check local rules.
9. Vertical farming: stacked indoor production
Best for: leafy greens, herbs and microgreens sold at premium prices close to the farm.
Vertical farming grows crops in stacked layers, usually indoors under LED lights with full climate control. It is one type of controlled environment agriculture, and the same ERS bulletin does not report it as a separate farm count. Yield per square foot of floor is the main attraction, because each extra layer adds growing area on the same footprint. The bulletin cites a lettuce trial where yield per unit of occupied floor was about 14 times that of a horizontal hydroponic system, at 20 times the planting density, so output per plant was lower.
- Land: rooftops, warehouses and other non-farm sites become usable.
- Water: recirculating systems reuse water, but the saving depends on crop and design.
- Pests: sealed rooms limit outdoor pest pressure, though they do not end disease risk.
- Season: output continues whatever the weather.
- Cost: buildings, lighting and cooling make this the most capital-heavy method here.
Light replaces the sun, so electricity is a core cost, and fast-growing, high-value crops carry that cost best. Grain and other low-value crops rarely fit this model. Before investing, price your crop against local power rates and confirmed buyers, and get professional financial advice.
10. Permaculture: design for self-maintaining systems
Best for: homesteads, small farms and community projects that value resilience over peak output of one crop.
Permaculture is a design approach more than a single technique. It arranges plants, animals, water and buildings so that each part supports the others, using natural patterns as the guide. It is not a USDA statistical category, and there is no federal certification or national count.
- Copying nature: perennial crops, trees, shrubs and ground covers work in layers.
- Water harvesting: swales, ponds and rain gardens hold rain on site.
- Diversity: many species spread risk and can limit pest outbreaks.
- Fewer bought inputs: the design aims to reduce fertilizer, pesticide and tillage over time.
- Scale: the ideas work on a backyard plot and can extend to a whole farm.
Field evidence is young but growing. A study of nine permaculture farms in Germany and Luxembourg, each paired with a nearby control field, found 27% higher soil carbon stocks on the permaculture sites and more plant, earthworm and bird species (Reiff et al., 2024). Nine farms is a small sample, and it did not settle what these farms earn.
The limit is commercial evidence. Mixed perennial plantings are hard to compare with single-crop yields, and harvests can be labor-heavy and uneven. Many commercial growers borrow parts of it, such as swales or hedgerows, instead of adopting the whole system.
Water-saving methods in rice: AWD and direct seeding
Rice is usually grown in flooded fields, so water is often the first thing rice farmers try to change, in places such as California, Arkansas, Australia and East Asia. The International Rice Research Institute (IRRI) promotes two methods.
Alternate wetting and drying (AWD). The field is drained until the water falls to about 15 cm below the soil surface, then flooded again. A perforated tube pushed into the soil shows the level. IRRI reports that AWD cuts water use by about 30% and methane by 30-70% with no yield penalty, because methane-producing bacteria are held back in the dry spells.
Direct seeded rice (DSR). Seed goes straight into the field, with no nursery or transplanting. IRRI’s Direct Seeded Rice Consortium puts irrigation savings at 12-35% with good water management. Weeds are the main risk, because no standing water holds them back, so DSR needs a planned weed program. Follow the product label and local rules for any herbicide.
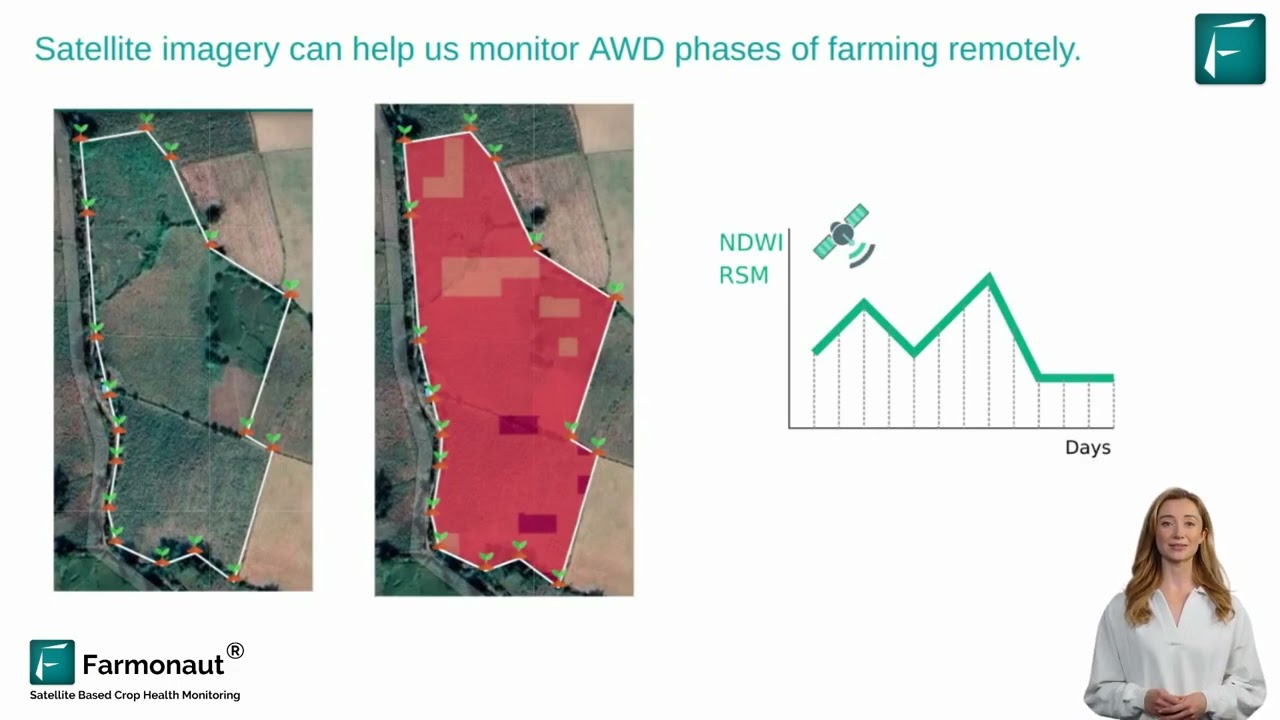
▶ Detecting alternate wet and dry phases in rice fields by satellite. · 4:03
What the evidence says on yield, water and cost
Comparisons between methods are harder than most lists suggest. A result depends on crop, place and what is being measured, and few studies test a method on working farms over many years. This table collects the strongest figures used in this guide, with what each one covers.
| Method | Finding | What it covers |
|---|---|---|
| Organic | Yields 19.2% below conventional | Global meta-analysis of 115 studies; narrows with rotation or multi-cropping |
| Conservation | No-till alone lowers yields; loss shrinks with residue and rotation | Global, 610 studies; gains in dry rainfed areas with all three principles |
| Hydroponics | 13 times less water, 82 times more energy per kilogram | Modelled lettuce in Yuma, Arizona |
| Rice AWD | About 30% less water, 30-70% less methane | IRRI summary of the method |
| Permaculture | 27% more soil carbon stock | Nine farms in Central Europe; not a yield result |
Cost figures are missing from the table on purpose. Machinery, land, labor and certification costs vary so much by farm that a national number would mislead. Your own budget is the better guide, which is why the calculator further down asks for it.
How to choose among farming methods
Treat the choice as layers, not one decision. These steps follow the order most costs fall in.
- Start with land and water. Soil, slope, rainfall and irrigation rights rule out some options. Our guide to agricultural land types helps here.
- Find the buyer. Organic and indoor crops depend on a market that pays for them. Get prices from real buyers first.
- Pick the base method. Conventional, organic or conservation is the usual base on field land. Hydroponic and vertical systems are their own base.
- Add one layer at a time. Cover crops, trees, livestock or field data each answer a different problem.
- Test on one field. Keep a comparison strip or field for at least a few seasons, because a single year can mislead.
- Check support and rules. Conservation funds, certification rules and loans differ by country and state. Take local professional advice on finance and legal points.
The table below shows common pairings. These are examples of methods that work together, not ranked advice.
| If your problem is | Base method | Layer to consider |
|---|---|---|
| Soil erosion | Conservation | Windbreaks or cover crops |
| High input bills | Intensive | Variable rate in the worst zones |
| Low crop prices | Organic or mixed | Direct sales or livestock |
| Little land | Hydroponic | Vertical layers for leafy crops |
| Dry climate | Conservation | Water harvesting, full residue cover |
A farm’s first season under a new method is rarely its typical one. For the wider cycle of field work, see our guide to the steps of farming. Farmonaut can provide satellite maps for comparing test fields through a season, which is useful when you are trying a new method on only part of the farm.
The calculator here compares the margin per acre of your current method with a new one. It uses only your numbers, and the example defaults sit close to break-even on purpose.
Common mistakes when changing method
- Judging by one season. A dry or wet year can flatter or punish a new system. Soil changes under conservation methods also build slowly.
- Copying a yield figure from another region. A study average can differ from what your soil and climate deliver. Use it to set a range, then test it.
- Counting the premium but not the wait. Organic transition years and young trees both cost money before they pay.
- Buying hardware before asking a question. Precision tools pay when they change a decision, such as where to cut a rate.
- Forgetting labor. Mixed farms, organic weed control and diverse plantings can shift work to busy weeks. Put your own hours and wage into the cost line.
- Ignoring the power bill. In indoor systems, electricity can change the whole budget, so get a quote at your local rate.
Try the numbers for your own farm below.
Calculator
Would switching method pay on your farm?
Enter your own yields, prices and costs for the current and the new method.
- Current margin per acre (US$): $150
- New margin per acre (US$): $151
- Break-even new price (US$/unit): 6.19
All values are examples near break-even, not benchmarks or forecasts. Use today’s prices and your own budget. The yearly switching cost spreads one-off costs such as certification, equipment or transition losses. Risk, labor changes and transition years are not modelled. Get professional advice before a major change.
FAQ
What are the 10 main methods of farming?
Traditional, modern intensive, organic, agroforestry, hydroponics and aquaponics, conservation agriculture, precision, mixed, vertical and permaculture. These groups overlap, so a single farm can use several.
What is the best farming method?
There is no single best method. It depends on the goal, whether that is yield per acre, input cost, water use, price premium or land footprint. The studies above show the trade-offs: organic yields averaged about 19% lower in one large analysis but can earn a premium, and hydroponic lettuce saved water but used far more energy in a modelled Arizona case.
What are the modern farming methods?
Modern intensive farming, precision farming, hydroponics and vertical farming are the methods usually called modern. Conservation agriculture also relies on modern no-till planters and herbicide or cover crop management.
What are traditional farming methods?
They include hand and animal labor, manure and compost for fertility, crop rotation, intercropping and saving seed. Some of them, such as rotation and composting, are also core parts of organic and conservation systems today.
Which farming method is most common in the US?
Among the methods compared in this guide, no-till had the most farms (300,954) and the most acres (105.2 million) in the 2022 Census. The census counts inputs such as commercial fertilizer on more farms (775,055), but those are not farming methods. It usually sits inside a conventional crop system, so it does not mean those farms follow all three conservation principles.
Can farming methods be combined?
Yes. A crop-livestock farm can use reduced tillage and yield maps. Agroforestry pairs with organic or permaculture systems, and aquaponics is itself a combination of hydroponics and fish farming.
Matching a method to your operation
The 10 methods are a toolkit, not a ranking. USDA figures show no-till on more acres than any other tillage practice, organic land at about 0.5% of US farmland with $14.3 billion in 2025 sales, and precision tools on 12% of all farms but on most large crop farms. Each method answers a different question. Start from your acreage, soil and market, then add only the layer that closes your largest gap.
Related pages on our site: crop loans and insurance; web and mobile apps; satellite data API; API developer docs.
Farmonaut crop monitoring
See your own fields from space
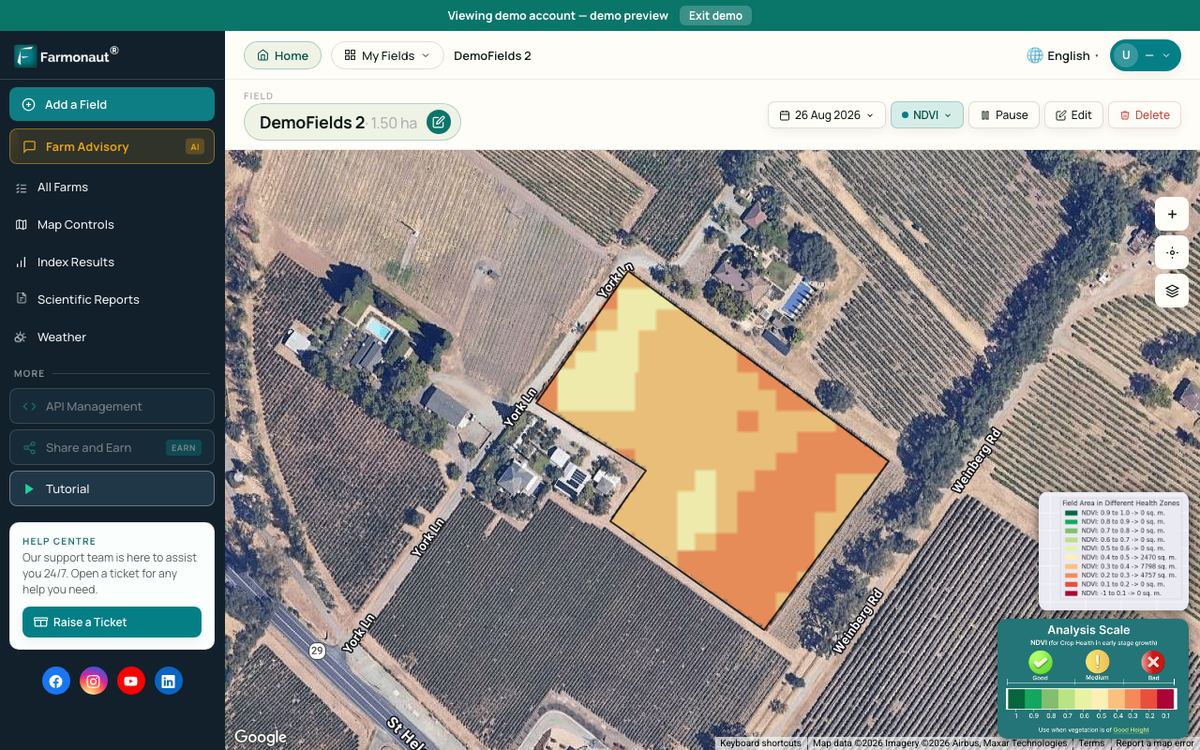
Draw your fields once and Farmonaut shows satellite vegetation maps through the season, so you can compare a test field with the rest of the farm.



Keep reading

Sources
- USDA NASS, 2025 Certified Organic Survey highlights (October 2026): nass.usda.gov
- USDA NASS, 2021 Certified Organics Survey highlights (2022): nass.usda.gov
- USDA NASS, 2022 Census of Agriculture, US volume (2024): nass.usda.gov
- USDA ERS, America’s Farms and Ranches at a Glance, EIB-283 (December 2024): ers.usda.gov
- USDA ERS, Precision agriculture use increases with farm size (December 2024): ers.usda.gov
- USDA ERS, Adoption of conservation tillage has increased (Charts of Note): ers.usda.gov
- USDA ERS, Soil Tillage and Crop Rotation: ers.usda.gov
- USDA ERS, Controlled environment agriculture, EIB-264 (January 2024): ers.usda.gov
- USDA Forest Service, Agroforestry across the United States: Results of the 2022 Census of Agriculture (2025): research.fs.usda.gov
- USDA NASS, National Agroforestry Survey: nass.usda.gov
- FAO, Agroforestry: fao.org
- FAO, Conservation Agriculture: fao.org
- Ponisio et al., Diversification practices reduce organic to conventional yield gap, Proc. R. Soc. B (2015): pmc.ncbi.nlm.nih.gov
- Pittelkow et al., Productivity limits and potentials of the principles of conservation agriculture, Nature (2015): nature.com
- Barbosa et al., Comparison of land, water and energy requirements of lettuce, IJERPH (2015): ebi.ac.uk
- IRRI, Alternate wetting and drying: ghgmitigation.irri.org
- IRRI Direct Seeded Rice Consortium, What is DSR: dsrc.irri.org
- Reiff et al., Permaculture enhances carbon stocks, soil quality and biodiversity in Central Europe, Communications Earth & Environment (2024): nature.com
- US Code of Federal Regulations, 7 CFR 205.202, land requirements for organic production: law.cornell.edu
Discussion
Questions, corrections or field experience? Share them below. First-time comments are reviewed before they appear, and your email is never published.
No comments yet. Be the first to add a question or your experience.

 Aerospect
 Delicio
 Payagri
 WB Dev
 Sama Premium
 Prochecker
 Tres Valles
 LACOS Geoinformation
 Pulsar Supernova
 Magrifly
 LatConnect 60
 WebsEdge
 Blickwinkel
 Agricultural Credit Policy Council
 Marei Nursery
 eKGIS
 Mostas Tech
 Andex
 FCF India
 Unifrutti Gulf
 Deluxe Conseil

 Licence holder · Niger · Gold
 Licence holder · Nigeria · Gold + lithium










