

Reviewed August 2026 against USDA ERS, USDA NASS and GAO.
Try it: Ag software: subscribe vs. custom build (5-year view) →
Agriculture Software Companies: What Each One Actually Specializes In
“Agriculture software company” covers at least five different businesses sold under one label: farm management information systems (records, fields, work orders), machinery telematics and guidance, remote-sensing and agronomic analytics, traceability and compliance documentation, and custom software development for agribusinesses that need something built rather than bought. Which category you need depends on whether your binding constraint is paperwork, equipment, agronomy, or a buyer audit — and picking the wrong category is the most common reason a subscription gets cancelled after one season. The market is also younger than the marketing suggests: the U.S. Government Accountability Office, drawing on USDA data covering June 2022–June 2023, reported that 27 percent of U.S. farms or ranches used precision agriculture practices to manage crops or livestock (GAO-24-105962, published 31 January 2024).
Table of Contents
- The five categories of agriculture software company
- Specialization map: which firms do what
- What U.S. adoption data says about who buys
- The margin the software has to beat
- Calculator: subscribe, or pay a development company to build?
- Hiring an agriculture software development company
- Where Farmonaut sits in this map
- The seven-question vendor checklist
- FAQ
- Try it: Ag software: subscribe vs. custom build (5-year view)
The Five Categories of Agriculture Software Company
Vendors rarely describe themselves by category, so buyers compare a telematics platform against a records platform and conclude that one is “cheaper.” These are the five distinct product types, and the question each one answers:
- Farm management information systems (FMIS). Field boundaries, crop plans, work orders, input records, labour hours, cost centres. The question: what happened on which acre, and what did it cost?
- Machinery telematics and guidance. Autosteer, section control, as-applied maps, fleet position, machine hours, prescription files pushed to a display. The question: did the iron do what the plan said?
- Remote sensing and agronomic analytics. Satellite or drone imagery turned into vegetation indices, moisture proxies, zone maps and scouting alerts. The question: where in this field should I walk today?
- Traceability, sustainability and compliance. Lot-level chain of custody, buyer audits, emissions and carbon accounting, insurance and lending evidence. The question: can I prove it to someone who pays me?
- Agriculture software development companies. Contract engineering: they build a platform, an integration layer, or an API-fed dashboard that a cooperative, processor, input retailer or lender owns outright.
The first four are subscription products. The fifth is a services business, and it is priced, contracted and risked completely differently — which is why the queries “agriculture software companies” and “agriculture software development companies” should never land you on the same shortlist.

Specialization Map: Which Agriculture Software Firms Do What
The table below is organised by specialty rather than by vendor size, because that is how buying decisions actually break down. Named examples are illustrative of the category, not a ranking — and the “verify it yourself” column matters more than the names, because product lines move between owners. Trimble’s precision agriculture business, for instance, became PTx Trimble on 1 April 2024, with AGCO holding 85 percent and Trimble 15 percent, per Trimble’s closing announcement. Any list of “ag software companies” older than that announcement is already wrong on ownership.
| Specialty | Typical buyer | Example platforms | Verify it yourself |
|---|---|---|---|
| Row-crop agronomy & field data | Corn, soybean, wheat and cotton operations | Bayer Climate FieldView; Granular (Corteva Agriscience) | FieldView publishes Basic, Plus and Premium tiers on Bayer Crop Science’s product page — ask which tier the quoted price is |
| Machinery, guidance & mixed-fleet telematics | Farms whose limit is machine capacity or overlap | John Deere Operations Center; PTx Trimble (AGCO) | Ask for the retrofit compatibility list for your oldest display, not the newest |
| Satellite remote sensing & advisory | Growers, agronomists, lenders, plantation and forestry managers | Farmonaut; Planet; EOS Data Analytics | Ask which satellites and what revisit; NASA’s Harmonized Landsat Sentinel-2 project gives 30 m observations at a 1.4-day global average (2025, five satellites) with 2–3 day latency, free |
| Livestock & grazing records | Cow-calf, feeder, sheep operations | AgriWebb (Australia-founded, U.S. operations) | Check whether mob/lot movements sync offline — pasture coverage is the failure point |
| Irrigation & soil moisture | Pivot and drip operations in the Plains, Delta and West | Lindsay FieldNET; CropX | Confirm pivot-panel makes supported and cellular coverage at the far end of the field |
| Permanent crops (orchards, vineyards) | Tree nut, pome fruit and wine grape blocks | Semios | Ask for degree-day and pest models validated for your species, not “crops generally” |
| Farm accounting & business management | Operations with landlords, lenders and multiple entities | Traction Ag; Conservis | Require a live export to your accountant’s system before signing |
| Traceability, carbon & compliance | Processors, exporters, retail supply chains | Farmonaut; IBM Food Trust | Ask to see one finished audit pack, not a demo dashboard |
| Custom development / integration | Co-ops, retailers, insurers, government programmes | Contract engineering firms; platform APIs | Ask which open standards they build to — see the development section below |
Notice what is missing: market-share percentages. Nobody audits the market share of private agtech platforms, so any table that assigns “13%” to one vendor and “9%” to another is asserting something no filing supports. Deere is the rare case with a public operating metric — engaged acres, defined as unique acres with at least one documented operation pass in the Operations Center over the prior 12 months, which the company reports in its sustainability and investor disclosures. Ask any vendor for the equivalent disclosed metric; if it does not exist, treat the share claim as marketing.
What U.S. Adoption Data Says About Who Actually Buys
Adoption is not uniform across technologies or crops, and that shapes which vendors have deep products in which crop. USDA’s Economic Research Service, using the Agricultural Resource Management Survey, reports variable rate technology on 37.4 percent of corn planted acres in 2016, up from 11.5 percent in 2005, and on 25.3 percent of soybean acres in 2018, 22.7 percent of cotton acres in 2019 (from 5.4 percent in 2007), 18.8 percent of winter wheat acres in 2017 and 13.9 percent of sorghum acres in 2019 (ERS Charts of Note). ARMS surveys each crop on a rotating cycle, which is why the years differ — the next reading for a given crop arrives when that crop’s rotation comes up again.
Two structural facts follow. First, adoption rises sharply with farm size: ERS reported guidance autosteering on 52 percent of midsize family farms and 70 percent of large-scale crop-producing farms in 2023, with yield monitors, yield maps and soil maps on 68 percent of large-scale crop farms (ERS Charts of Note, 10 December 2024). Second, the buyer base is consolidating: the 2022 Census of Agriculture counted 1.9 million farms on 880 million acres, a 7 percent drop in farm numbers and 2 percent drop in farmland from 2017, with average size up 5 percent to 463 acres; farms with internet access rose from 75 percent in 2017 to 79 percent in 2022 (USDA NASS, 13 February 2024). The census runs every five years, so the next comparable count covers 2027.
Vendors respond to that shape by building depth in corn and soybeans first. If you grow rice, sorghum, specialty vegetables or run livestock, the practical consequence is that you should ask for reference customers in your crop and state before you ask about price.

The Margin the Software Has to Beat
Software is bought out of a margin that is under pressure, which sets the size of the prize. USDA ERS forecast net farm income of $153.4 billion for 2026, down $1.2 billion (0.7 percent) in nominal terms and 2.6 percent after inflation from 2025, in the forecast updated 7 May 2026 (ERS farm income highlights). At the field level the University of Illinois farmdoc team projected 2026 returns of −$72 per acre in northern Illinois to −$111 per acre in southern Illinois for corn on cash-rented ground, against price assumptions of $4.15 per bushel for corn and $10.30 for soybeans, with breakevens covering non-land costs and cash rent of $4.66–$4.94 per bushel for corn and $10.72–$11.16 for soybeans (farmdoc daily, 19 August 2025, Paulson, Schnitkey, Zwilling and Zulauf).
That is the arithmetic every agriculture software company is competing against: a per-acre fee has to be recovered from a per-acre margin that has been negative for four consecutive crop years on rented Illinois ground. The credible savings claims are on the input side. The Association of Equipment Manufacturers, with the American Soybean Association, CropLife America and the National Corn Growers Association, published a study on 1 February 2021 estimating that precision agriculture had already raised productivity by 4 percent, improved fertiliser placement efficiency by 7 percent, cut herbicide use by 9 percent, fossil fuel use by 6 percent and water use by 4 percent — with further potential gains of 6, 14, 15, 16 and 21 percent respectively at full adoption (AEM newsroom).
Fertiliser is where those percentages bite hardest, because it is the largest swing item in the budget. ERS calculated fertiliser at about 22 percent of total corn production costs per acre across 2006–2016, around 17 percent across 2017–2021, and about 24 percent in 2022 during the price spike (ERS Charts of Note, 27 March 2024).
To get a figure for your own crop and region rather than a national average, use the ERS Commodity Costs and Returns data product. Its recent cost-and-returns tables were updated 1 May 2026 with the next release scheduled for 1 October 2026; the cost-of-production forecasts (2026F–2027F) were updated 18 June 2026 with the next release scheduled for 10 November 2026. Pull your own per-acre fertiliser and chemical line, then apply an efficiency percentage you are willing to defend.

Calculator: Subscribe, or Pay a Development Company to Build?
Enter your own acreage, the per-acre quote you have been given, and the fixed-price quote from a development firm; the tool compares both over five years against input savings you choose.
Ag software: subscribe vs. custom build (5-year view)
Assumptions: five-year horizon, no discounting, no inflation on the subscription price, maintenance charged every year including year one, and the efficiency gain applied to the input spend you entered. Excludes hardware, displays, connectivity, training, staff time, data migration, and any yield effect. Efficiency percentages are sector-level estimates from the AEM study of 1 February 2021, not a guarantee for your fields.
Try the platform side of that comparison directly. Farmonaut's browser interface needs no installation:

and the mobile builds are here:


Hiring an Agriculture Software Development Company
A development contract is a different purchase from a subscription, and three named, durable reference points should appear in the statement of work. Directory rankings of "top agriculture software development companies" are paid placement; these are not.
1. Interoperability: name the standard, not the intention
AgGateway, a non-profit that develops resources for digital connectivity in agriculture, maintains ADAPT, an open-source platform for agriculture data interoperability, and AGIIS, a subscription identifier registry for standardising entity and product identity across the supply chain. A development firm that cannot say whether it will implement ADAPT plugins or hand-roll every machine-file parser has not scoped the hardest part of the job.
2. Data rights: use the sixteen published principles as contract clauses
The Ag Data Transparent core principles were first developed in November 2014 by the American Farm Bureau Federation with commodity groups and ag technology providers, and updated in 2024. There are sixteen, covering ownership and control, collection consent, notice of changes, transparency, choice, portability, identity of the provider and of data partners, limits on disclosure and sale, retention and deletion, termination, anti-competitive use, anonymisation and aggregation, and security. Lift the wording into your contract and require the vendor to answer each point in writing. GAO named data ownership concerns, high upfront costs and the absence of uniform interoperability standards as the three principal barriers to adoption — the same three a good contract addresses on page one.
3. Data source: buy the pipeline, not the pixels
Public satellite data is free, so any quote that treats imagery itself as the expensive part is mispriced. NASA and USGS distribute Harmonized Landsat Sentinel-2 products at 30 m resolution from Landsat 8, Landsat 9, Sentinel-2A, Sentinel-2B and Sentinel-2C, at a global average revisit of 1.4 days as of 2025 with two-to-three-day latency. The engineering cost sits in cloud masking, field-boundary geometry, time-series gap filling, alert logic and delivery — not in acquisition. Federal money has gone into that layer too: GAO reported that USDA and the National Science Foundation allocated almost $200 million to precision agriculture research and development across fiscal years 2017–2021.
If you would rather integrate than build from scratch, Farmonaut exposes its satellite and weather layers through the Farmonaut API, with request formats and field-registration flows documented in the developer documentation. That turns a twelve-month build into an integration sprint for teams whose product is the workflow, not the remote sensing.

What "AI Agriculture Companies" Means in Practice
Four things are sold as AI in agriculture, and they carry different evidence burdens. Computer vision on satellite, drone or in-cab imagery for disease, weed and stand assessment — ask for accuracy on a held-out season, not a demo field. Statistical and machine-learning yield and risk models — ask which years were used for training and which were held back. Language-model advisory layers that summarise field data into recommendations — ask what happens when the underlying imagery is cloud-covered. Autonomy in guidance, spraying and harvesting — the closest to being independently measurable, since fuel, overlap and chemical volumes are all countable. Our own explainer on applied AI techniques in agriculture walks through several of these, and the broader shift in field practice is covered in this piece on how the mechanisation-to-data transition changed agronomy.
The durable test for any AI claim: ask the vendor to state the counterfactual. Compared with what — a scout walking the field, last year's flat rate, or nothing at all? A vendor who cannot name the comparison has not measured the benefit.

Where Farmonaut Sits in This Map
We build in two of the five categories: satellite remote sensing with an advisory layer, and traceability and compliance. That is a deliberately narrow footprint — we do not sell autosteer, and we do not replace your accountant.
- Satellite crop monitoring. Multispectral indices for crop vigour and soil moisture proxies, delivered per registered field through the web and mobile apps, with no hardware to install.
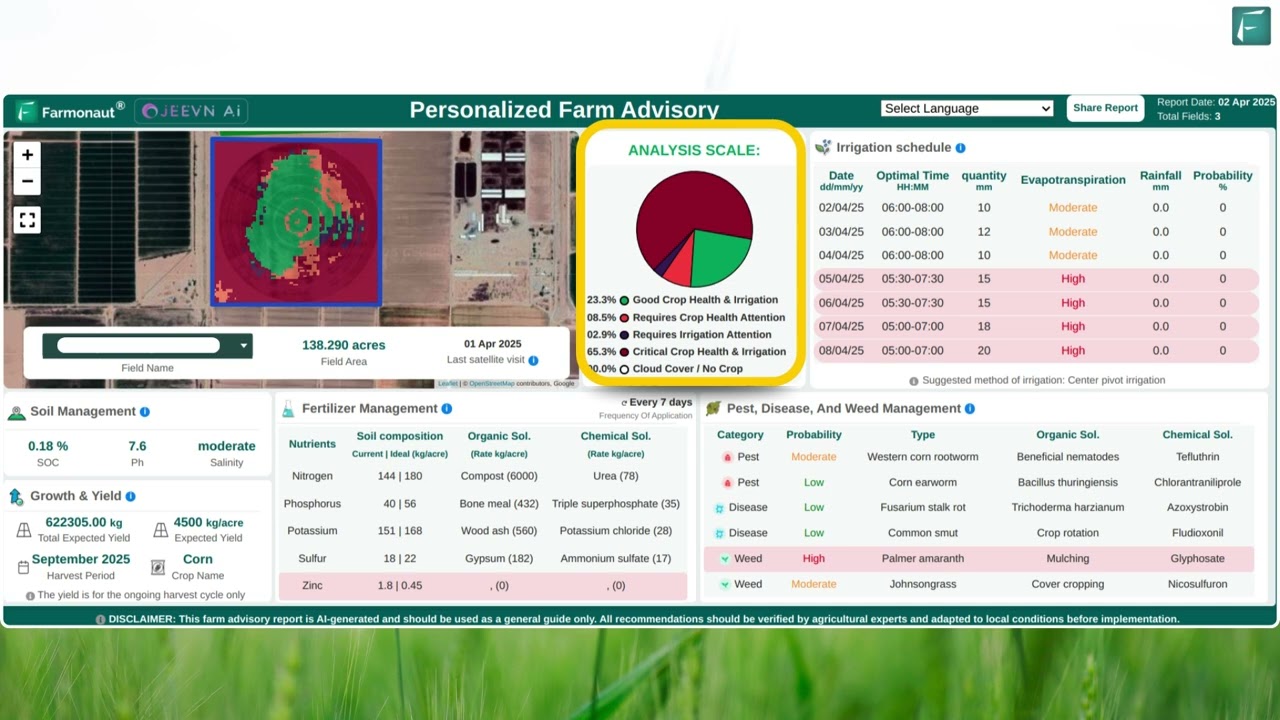
- Jeevn AI advisory. Field-level irrigation, nutrition and pest guidance generated from the satellite time series and local weather, rather than from a generic crop calendar.
- Large-acreage administration. Multi-farm and multi-user oversight for cooperatives, estates and programme managers via the large-scale farm management console.
- Traceability. Lot-level chain-of-custody records for buyer and retailer audits — see product traceability.
- Lending and insurance evidence. Independent, time-stamped field observation for underwriting and claims, described on the crop loan and insurance page.
- Emissions accounting. Field-level activity and monitoring data feeding carbon footprint reporting.
- Fleet and logistics. Vehicle and machinery movement for haulage-heavy operations through fleet management.
Deployment scale matters more than feature lists when you are judging a vendor, which is why we publish partnership write-ups such as this multi-thousand-hectare sustainable-sourcing rollout with an organic ingredients supplier. Ask every shortlisted vendor for one comparable account, and for permission to call it.
The Seven-Question Vendor Checklist
These questions do not expire when the pricing pages change. Run them against every agriculture software company on your shortlist, and score each answer as documented, verbal, or refused.
- Which of the five categories are you, and which do you integrate with? A vendor claiming all five is quoting a roadmap.
- Show me one customer in my crop, my state, and my acreage band. Corn-belt references do not transfer to rice or to a 400-head cow-calf operation.
- What is your answer to each of the sixteen Ag Data Transparent principles? Portability and deletion are the two that get dodged.
- How does data leave? Request a full export in your format during the trial, not after.
- What breaks without connectivity? Twenty-one percent of U.S. farms had no internet access in 2022. Ask what the app does offline and what queues.
- Which display and equipment vintages are supported? Get the compatibility list for your oldest machine in writing.
- What is the per-acre price at renewal, and what is the multi-year escalator? Model it with the calculator above before signing.
Then set your own baseline so that next season's comparison is real: record this year's fertiliser and chemical spend per acre from your own invoices, pull the matching regional figure from the ERS Commodity Costs and Returns tables on their published update dates, and note the acres where you already run guidance or variable rate. Without that baseline, no vendor's savings claim can be tested — and it is the single cheapest thing on this page to do.

FAQ
Which agriculture software companies are the biggest?
There is no audited market-share table for this sector, because most platforms are private or are business units inside larger companies that do not report software revenue separately. Deere publishes engaged acres — unique acres with at least one documented operation pass in the Operations Center in the prior twelve months — and Bayer publishes FieldView tier structures. Compare disclosed operating metrics from company filings and investor materials rather than third-party share estimates.
What do agriculture software companies specialise in?
Nine specialties, mapped in the table above: row-crop agronomy, machinery telematics and guidance, satellite remote sensing and advisory, livestock and grazing records, irrigation and soil moisture, permanent crops, farm accounting, traceability and compliance, and custom development. Most vendors are strong in one or two and thin in the rest.
How much precision agriculture software is actually in use in the United States?
GAO reported 27 percent of U.S. farms or ranches using precision agriculture practices, based on USDA data covering June 2022 to June 2023. Use rises with size: 52 percent of midsize family farms and 70 percent of large-scale crop farms used guidance autosteering in 2023, per USDA ERS.
Is an agriculture software development company different from an ag software vendor?
Yes. A vendor sells a subscription to a product it controls and improves; a development company builds software you own and must then maintain. Use the calculator above to compare the five-year totals, and remember that maintenance, hosting and support are recurring costs on the build side too.
Do these platforms work for small farms?
Satellite-based monitoring has the lowest entry cost because there is no hardware, and public imagery is free at 30 m resolution with a 1.4-day average revisit across the harmonized Landsat and Sentinel-2 constellation. Equipment-dependent categories — guidance, section control, variable rate — carry hardware costs that scale poorly below a few hundred acres, which is exactly the pattern in the ERS adoption-by-farm-size data.
How do I keep the numbers in this article current?
Four sources, all with published update cycles: ERS Commodity Costs and Returns for per-acre input costs, the ERS farm income forecast for sector margin, USDA NASS Census of Agriculture every five years for farm counts and internet access, and ARMS-based ERS Charts of Note for technology adoption by crop.

Start With the Category, Not the Vendor
Decide which of the five categories your constraint sits in, demand one reference in your crop and acreage band, put the sixteen Ag Data Transparent principles in the contract, and test any savings claim against a baseline you recorded yourself. With corn returns projected at −$72 to −$111 per acre on cash-rented Illinois ground for 2026 and sector net farm income forecast to slip to $153.4 billion, the software has to earn its per-acre fee in the first season — and a documented answer to seven questions is what tells you whether it will.
If satellite monitoring and traceability are the categories you need, start with the free tier in the Farmonaut web and mobile apps, or read the API reference if you are building the integration yourself.
Discussion
Questions, corrections or field experience? Share them below. First-time comments are reviewed before they appear, and your email is never published.
No comments yet. Be the first to add a question or your experience.

 MapMyCrop
 Cresol
 Atur Kuliner
 MDCV UK
 Zerella Group
 Etech Consulting Madagascar
 Vestlandsforsking
 Agritein
 Delicio
 WB Dev
 Sama Premium
 Prochecker
 Tres Valles
 LACOS Geoinformation
 Magrifly
 LatConnect 60
 Blickwinkel
 Agricultural Credit Policy Council
 Marei Nursery
 eKGIS
eKGIS Mostas Tech
