

Farming basics · Process guide
4 Basic Processes of Farming, With Data and Calculator
The 4 basic processes of farming are land preparation, sowing, crop care and harvesting. Each is explained with dated US data on tillage, planting dates, nutrients and harvest losses, plus a calculator that prices the grain left in your field.
Key takeaways
- The four processes in order: land preparation, sowing, crop care, harvesting. Longer lists of 7 or 10 steps split the same work.
- No-till covered 27.5% of US cropland and cover crops 4.7% in 2022 (Choices magazine, Census of Agriculture data).
- Corn yield potential falls about 0.3% a day early in May and about 1% a day from mid-May (Purdue, citing Midwest studies).
- NC State reports soybean field losses averaging about 10% of yield in North Carolina; a machine loss of 3 to 4% is practical with careful combining.
- Four soybeans or two corn kernels per square foot left behind equal about one bushel per acre lost (Iowa State).
In this article
- The 4 basic processes of farming at a glance
- The 4 processes in simple words, for students
- Traditional and modern ways of doing each process
- 1. Land preparation
- 2. Sowing
- 3. Crop care
- 4. Harvesting
- Which process matters most?
- How satellite images help across the four processes
- Common mistakes in the four processes
- How we checked the numbers
- FAQ
The 4 basic processes of farming are land preparation, sowing, crop care and harvesting. Land preparation makes the seedbed. Sowing puts seed in it at the right depth, spacing and time. Crop care covers water, nutrients, weeds, pests and disease until the crop is ready. Harvesting gathers the crop at maturity with as little loss as possible. Other guides split the work into 7 or 10 steps, but the same four jobs sit underneath. This guide gives each process a plain explanation, sourced numbers from US extension services, USDA and FAO, charts, and a calculator for harvest losses.
If you want the longer list, read our guide to the 7 steps of farming with pictures. It splits seed choice, watering and feeding out as separate steps and adds US corn cost data.
The 4 basic processes of farming at a glance
The table shows what each process does, what a farmer decides and the number that matters most. Timings change with crop, climate and machinery, so the table does not give durations.
Infographic
The four processes in order
- 1Land preparationTest soil, clear residue, make the seedbed.
- 2SowingSet date, depth and spacing.
- 3Crop careWater, feed, scout and control pests.
- 4HarvestingCut at maturity and keep losses low.
| Process | Main job | Key decision | Number to watch |
|---|---|---|---|
| 1. Land preparation | Clear residue, loosen or leave the soil, level it, correct soil acidity and nutrients | Till, or sow into residue with no-till | Soil test result, sampled to the depth your lab asks for |
| 2. Sowing | Place seed at the right depth and spacing | Planting date and seed variety | Soil temperature at seed depth |
| 3. Crop care | Water, feed, control weeds, pests and disease | When to act, and with what | Pest counts against an action threshold |
| 4. Harvesting | Cut or pick at maturity, then dry and store | Timing and machine settings | Seeds left per square foot |
The 4 processes in simple words, for students
Think of growing a crop as four jobs done in order. First you get the soil ready, like clearing a table before a meal. Next you plant the seed. Then you look after the plants while they grow: you give them water and food, and you keep weeds, insects and disease away. Last you collect the crop when it is ripe and store it so it does not spoil. A school answer can be one sentence for each job. The sections below add the detail that a farmer needs.
A worked example with corn in the US Midwest: soil is sampled and limed in autumn or early spring, seed goes in when the soil is warm enough in spring, weeds and pests are checked through summer, and the combine runs in autumn. Each region and crop has its own calendar, so use the dates from your state extension service.
Traditional and modern ways of doing each process
The jobs stay the same; the tools change. The table compares them without invented percentages, because no single figure fits every farm.
| Process | Traditional tools | Modern tools |
|---|---|---|
| Land preparation | Hand hoe, animal-drawn plow | Tractor with GPS auto-steer, no-till drill, soil test lab |
| Sowing | Hand broadcasting, simple seed drill | Precision planter |
| Crop care | Hand weeding, visual scouting, flood irrigation | Drip lines, sensors, pest thresholds, satellite vegetation maps |
| Harvesting | Sickle, hand threshing | Combine with moisture sensor, grain dryer, cold storage |
1. Land preparation
Land preparation is the first process. It makes a seedbed where seed can touch moist soil and roots can grow. The usual jobs are clearing weeds, stones and old crop residue, loosening the soil, levelling it so water does not pool, and correcting acidity or nutrient shortages with lime or fertilizer. In flood irrigation, a level field matters because water spreads evenly only on an even surface.
Soil testing comes before any amendment. Iowa State’s guide to nutrient and limestone recommendations bases its advice on soil samples taken to a 6-inch depth. Take samples the way your state laboratory asks, and follow the product label and local rules when you apply lime or fertilizer.
Tillage, no-till and cover crops
Tilling is not the only way to make a seedbed. In no-till farming the seed goes through the residue with a special drill and the soil is not turned. A cover crop is, as the US program SARE describes it, a plant used primarily to slow erosion, improve soil health, smother weeds and help control pests and diseases.
US Census of Agriculture data analysed in Choices magazine show how far these practices have spread. No-till covered 27.5% of US cropland in 2022 and cover crops 4.7%. Both grew slowly between 2017 and 2022, and many counties moved the other way: in about 1,261 counties (44.7% of all counties) the no-till area fell during that period.
How the practice differs by region
The Choices analysis shows that no-till use varies across the US. In 2022 it was highest in the Northern Great Plains at 34.7% of cropland, then the Heartland at 32.1%, the Prairie Gateway at 30.1% and the Southern Seaboard at 27.3%. The authors say the pattern may reflect highly erodible land, where farmers may use no-till as part of a conservation plan needed to enrol in USDA programs. Soil conditions, rainfall and the crop all shape which method fits.
The choice is also about weeds and moisture. Residue on the surface shades the soil and slows runoff, but it can keep soil cooler in spring, which links back to the soil temperature point in the sowing section. Talk to your local extension adviser before changing your system.
Guidance systems for field work
Tractors with GPS auto-steer help with tilling, seeding and spraying by cutting skips and overlaps. A USDA Economic Research Service study found that more than half of the acres planted to corn, soybeans, winter wheat and cotton were managed with auto-steer and guidance systems in the survey years 2016 to 2019. For corn, winter wheat and soybeans, adoption was far lower on the smallest farms than on the largest; cotton was the exception, with half of the smallest farms already using guidance. The same study lists lower energy costs, less soil compaction and less operator fatigue as potential benefits, not guaranteed ones.
Chart
No-till and cover crops on US cropland
Share of cropland in the 48 contiguous states, Census of Agriculture years
Chart
Guidance system use: smallest vs largest farms
Share of farms using auto-steer or guidance, fifth of farms by acreage, survey year in brackets
2. Sowing
Sowing, also called planting, places seed or seedlings into prepared soil at the right depth, spacing and time. The three common methods are broadcasting (scattering seed over the surface), drilling or planting in rows, and transplanting seedlings that were grown in a nursery. Rice, vegetables and many tree crops are often transplanted.
Four choices decide how even the crop comes up: seed quality, depth, spacing and date. Depth and spacing depend on the crop, so use the figures your extension service gives for your crop and variety.
Planting date and soil temperature
For corn, Purdue’s Bob Nielsen calls 50 F soil temperature at planting depth the traditional rule of thumb for safe planting. He adds that corn needs about 115 growing degree days to emerge, which means roughly 10 days of soil averaging 61 to 62 F if you want it up in 10 days. A cold spell soon after planting slows emergence.
Planting late costs yield, but not in a straight line. Purdue reports that yield potential falls by about 0.3% a day early in May and about 1% a day from mid-May, based on Midwest studies that he cites. In a year with a 190 bushel per acre ceiling, a 30-day delay after 1 May could cut potential to about 154 bushels per acre. Over 30 years, though, planting progress explained only about 13% of the year-to-year change in Indiana’s state yield, because weather during the season matters more.
Sowing checklist
- Check seed quality: use clean seed from a label you trust, and keep seed dry and cool before sowing.
- Check soil temperature at seed depth, not air temperature, and look at the forecast for the next few days.
- Set the planter depth and spacing for your crop, then dig up a few seeds to confirm depth.
- Walk the field a week or two later and count plants, so you know the stand before weeds and pests arrive.
Purdue also notes that the usual prime window for corn in much of Indiana runs from about 20 April to 10 May, a week later in the north and a week earlier in the south. In the past 20 years half of Indiana’s corn was planted after mid-May. Early planting favours higher yields but does not guarantee them, since planting date is one of many yield factors.
Machines
Precision planters and GPS guidance make row spacing and seed placement more even on large fields. Gains from these tools depend on the field and the machine, so we give no single speed-up figure.
Chart
Corn yield potential lost per day of late planting
Percent of yield potential per day, Midwest studies cited by Purdue, two periods

▶ Our visual guide to the five essential stages of crop farming. · 12:13
3. Crop care
Crop care, or crop management, is everything between sowing and harvest. It is the longest process and the one with the most decisions. The main jobs are watering, feeding, weed control, and pest and disease control. Orchards and forests add pruning.
Feeding the crop
Crops take nutrients out of the field with the grain. Ohio State University Extension (2019, from on-farm trials in Ohio) reports that 180 bushels per acre of corn removes about 62 pounds of P2O5 and 36 pounds of K2O in the grain, while 60 bushels per acre of soybean removes 47 and 68 pounds. Once a soil is in the maintenance range, fertilizer rates roughly replace what the grain removes. A soil test tells you where your field stands.
Weeds, pests and disease
Integrated pest management, or IPM, avoids spraying by habit. The US EPA describes a series of steps that starts with setting an action threshold and monitoring and identifying pests before any control is chosen. The FAO also promotes integrated pest management as a way to cut pesticide risk. Always follow the product label and local rules when you use any pesticide, and get advice from a licensed adviser for your crop.
Scouting, not guessing
Walk fields on a regular schedule, look at the same spots each time, and keep notes with dates. A note such as “aphids on 12 plants of 100 on 15 June” tells you more than a memory of “a lot of aphids”. Compare counts against the action threshold from your extension service before you spray. The product label is the law on rates, timing and protective equipment.
Weeds compete with the crop early, so many growers aim to remove them in the first weeks after emergence. Methods include cultivation, mulches, cover crops and herbicides, and an IPM plan mixes them. Rotating crops and herbicide modes of action helps to slow resistance, so ask your adviser for a plan for your region.
Reading the nutrient table
Ohio State’s table gives removal per bushel: corn takes 0.74 pounds of nitrogen, 0.35 of P2O5 and 0.20 of K2O per bushel, and soybean takes 3.55, 0.79 and 1.14. The values show why a soybean crop removes much more potassium than corn at typical yields. They describe grain only, not stalks left in the field, and they are not a fertilizer recommendation.
Irrigation
Water is supplied by rain, surface flooding, sprinklers or drip lines. Which one fits depends on the crop, soil and water supply. The longer guide linked at the top compares FAO field application efficiencies for each method.
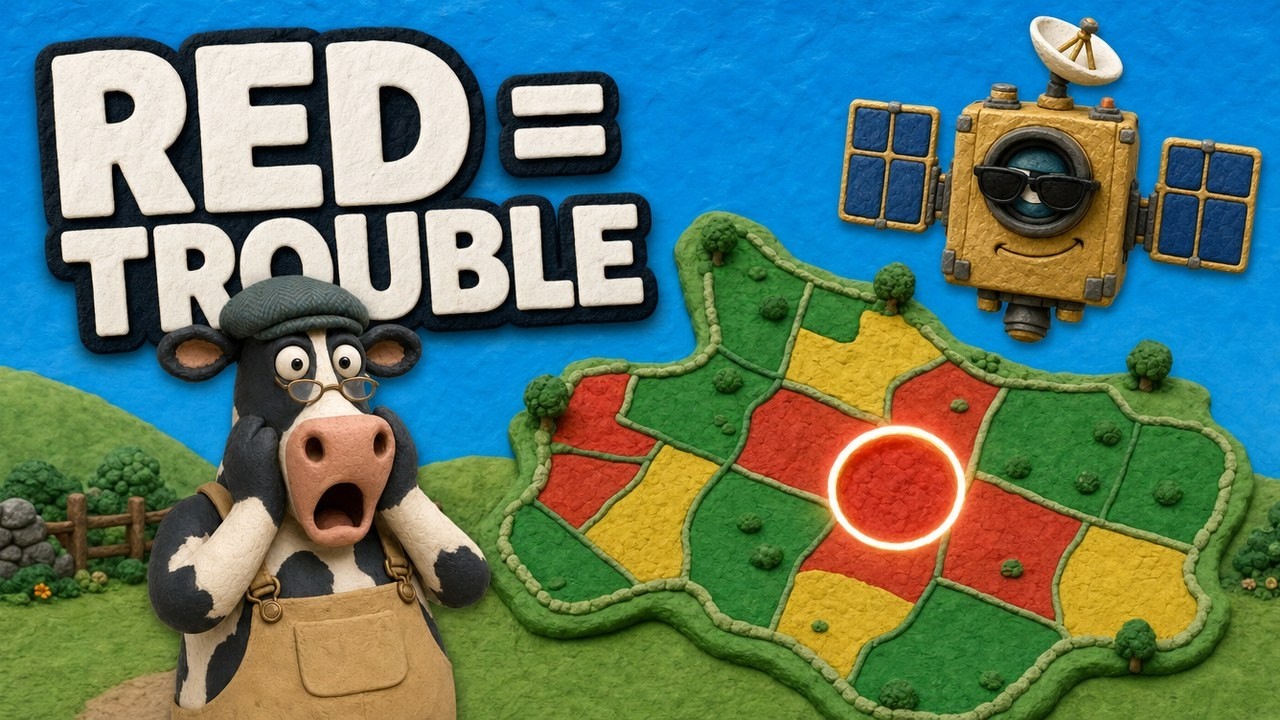
▶ How NDVI satellite maps show crop stress before you can see it. · 4:09
4. Harvesting
Harvesting collects the crop once it reaches maturity. Timing matters for both yield and quality. Cut too early and grain is wet and immature. Wait too long and crop is lost to shattering, lodging, birds and weather. After the field, grain is cleaned, dried, stored and moved, and perishables need cooling.
Where harvest losses happen
Machine settings are a large source of loss. NC State Extension (2017) reports that soybean field losses in North Carolina average about 10% of yield and run as high as 15 to 20% in many cases, while a machine loss of 3 to 4% is practical with careful operation. Iowa State adds that header loss can be as much as 60% of total corn loss and 90% of total soybean loss.
How to measure your own loss
Count what is left on the ground. Iowa State’s rule of thumb is that four soybeans or two corn kernels per square foot equal about one bushel per acre lost. NC State notes that very small beans can need up to 10 per square foot, and very large beans only two. Check a few spots, compare with the count in standing crop to separate pre-harvest loss, and adjust the combine. NC State suggests continuing if total loss is not above 3% of yield.
The four kinds of combine loss
NC State groups soybean losses into pre-harvest loss (beans already on the ground), gathering unit loss (beans that never enter the combine), cylinder loss (beans left in the pod) and separation loss (threshed beans blown out with the trash). Most harvesting loss falls in the gathering unit group. Finding which type dominates tells you which setting to change. Iowa State suggests matching ground speed to the stalk roll speed in corn, setting soybean reel speed about 25% above travel speed and keeping the threshing unit well loaded.
NC State also stresses that careful combining costs nothing extra, so each bushel saved goes straight to profit. Use the calculator below to see what your own count means in dollars.
After harvest
Losses continue after the field. The FAO estimates that 13.3% of food was lost worldwide between harvest and retail in 2023, up slightly from 13.0% in 2015. Good drying, storage and handling are part of the harvesting process, not an extra.
Chart
Header share of total harvest loss, upper figures
Highest share the header can account for, percent of total loss
Try the numbers for your own farm below.
Calculator
What does the grain left in my field cost?
Count seeds in one square foot behind the combine and enter your own numbers.
- Loss per acre: 2.0 bu/acre
- Loss as share of yield: 3.3 %
- Value lost per acre: $20
Example values only, not benchmarks or forecasts. A count behind the combine is total field loss, which includes beans on the ground before harvest; NC State says to subtract a count taken in standing crop to get machine loss. Seeds per square foot equal to one bushel per acre: Iowa State gives 4 for soybeans and 2 for corn kernels; NC State says very small beans can need up to 10 and very large beans two. Price is an example, use today’s price. Money is in US$.
Which process matters most?
No single process wins every season. A poor seedbed shows up as a patchy stand, a late sowing shortens the season, weak crop care lets weeds and pests take yield, and a careless harvest throws away grain that was already grown. The data above show a measurable cost for late planting and for harvest loss. Late planting costs a fraction of a percent to about one percent of corn yield potential per day, according to Purdue. NC State reports that soybean field losses in North Carolina average about 10% of yield, and that machine loss of 3 to 4% is practical with careful combining. Treat the four processes as a chain, and check the weakest link on your own farm first. Records help: note dates, soil test results, inputs and loss counts each year, so next season starts from facts and not memory.
How satellite images help across the four processes
Satellite images show vegetation change across a whole field. They do not show the cause of a change. A weak patch can be dry soil, a nutrient shortage, a pest or a drainage problem, so a visit to the field is still needed. Tools such as the Farmonaut Satellite + AI Farm Monitoring System draw NDVI vegetation maps for fields you outline, which helps you decide where to scout during crop care.
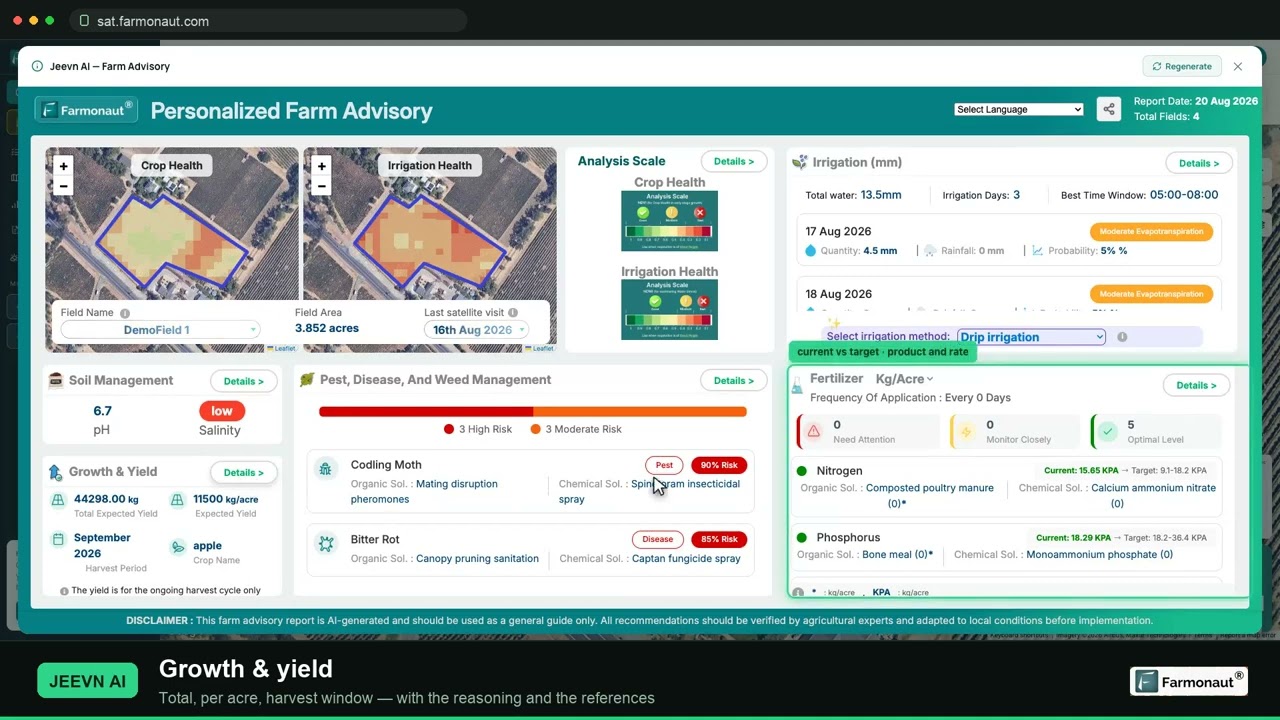
▶ A walkthrough of satellite crop monitoring and reading NDVI. · 19:36
Common mistakes in the four processes
- Planting by calendar date alone, without checking soil temperature and forecast.
- Applying fertilizer without a soil test, or without checking what the last crop removed.
- Spraying on a set schedule instead of checking pest counts against a threshold.
- Never measuring harvest loss, so combine settings stay wrong all season.
How we checked the numbers
Every number in the text and charts comes from a page we opened: USDA Economic Research Service, Choices magazine’s analysis of the Census of Agriculture, Purdue, Iowa State, Ohio State and NC State extension pages, SARE, the US EPA and the FAO. Where a source covers one state or one crop, the text says so. Reviewed 26 October 2026.
FAQ
What are the 4 basic processes of farming?
Land preparation, sowing, crop care and harvesting. Some guides add storage and marketing after harvest.
What is the correct order of the steps of farming?
Prepare the land, sow, look after the crop, then harvest. Soil testing comes before land preparation is finished, and drying and storage follow harvest.
How is this different from the 7 steps of farming?
The 7-step list splits the same work into smaller parts: seed choice, watering, feeding and crop protection are shown as separate steps.
Does no-till replace land preparation?
No. No-till changes how you prepare the seedbed, because the soil is not turned. Soil testing and weed control still apply.
Do the same four processes apply to forestry and orchards?
Yes, with differences. Trees are planted once and managed for years, so crop care includes pruning and long-term nutrition. Check advice for your crop from your extension service.
Related pages on our site: reducing soil erosion, farm management, crop monitoring, farm machinery, food traceability, crop finance, carbon footprints, weather data, satellite data.
Farmonaut crop monitoring
See your own fields from space
Outline your fields once and follow their vegetation maps through the season on web, Android or iOS.




Keep reading

Sources
- Choices magazine, disadoption of cover crops and no-till (Q3 2024): choicesmagazine.org
- USDA ERS, Auto-steer and guidance systems (2023): ers.usda.gov
- Purdue, Planting Date Conundrum for Corn (2024): agry.purdue.edu
- Purdue, Soil Temperatures and Corn Emergence: agry.purdue.edu
- NC State Extension, Reduce Soybean Harvest Losses: content.ces.ncsu.edu
- Iowa State, Verifying Combine Adjustments (2019): crops.extension.iastate.edu
- Ohio State, Nutrients Removed with Harvested Grain: ohioline.osu.edu
- SARE, Cover Crops: sare.org
- US EPA, IPM Principles: epa.gov
- FAO, Integrated Pest Management: fao.org
- FAO, SDG 12.3.1 Global food losses: fao.org
- Iowa State, nutrient and limestone recommendations: naturalresources.extension.iastate.edu
Discussion
Questions, corrections or field experience? Share them below. First-time comments are reviewed before they appear, and your email is never published.
No comments yet. Be the first to add a question or your experience.

 SFX
 BACF Africa
 Nivia
 Doodlakine
 Exurbia Geospatial
 FieldZero
 Indico Company
 Kubota
 FFBS
 Jontra
 Tucor
 Hayleys Agriculture

 Licence holder · Niger · Gold
 Licence holder · Nigeria · Gold + lithium










