

Gold miners · Ranked list
Australian Gold Mining Companies Ranked by Output
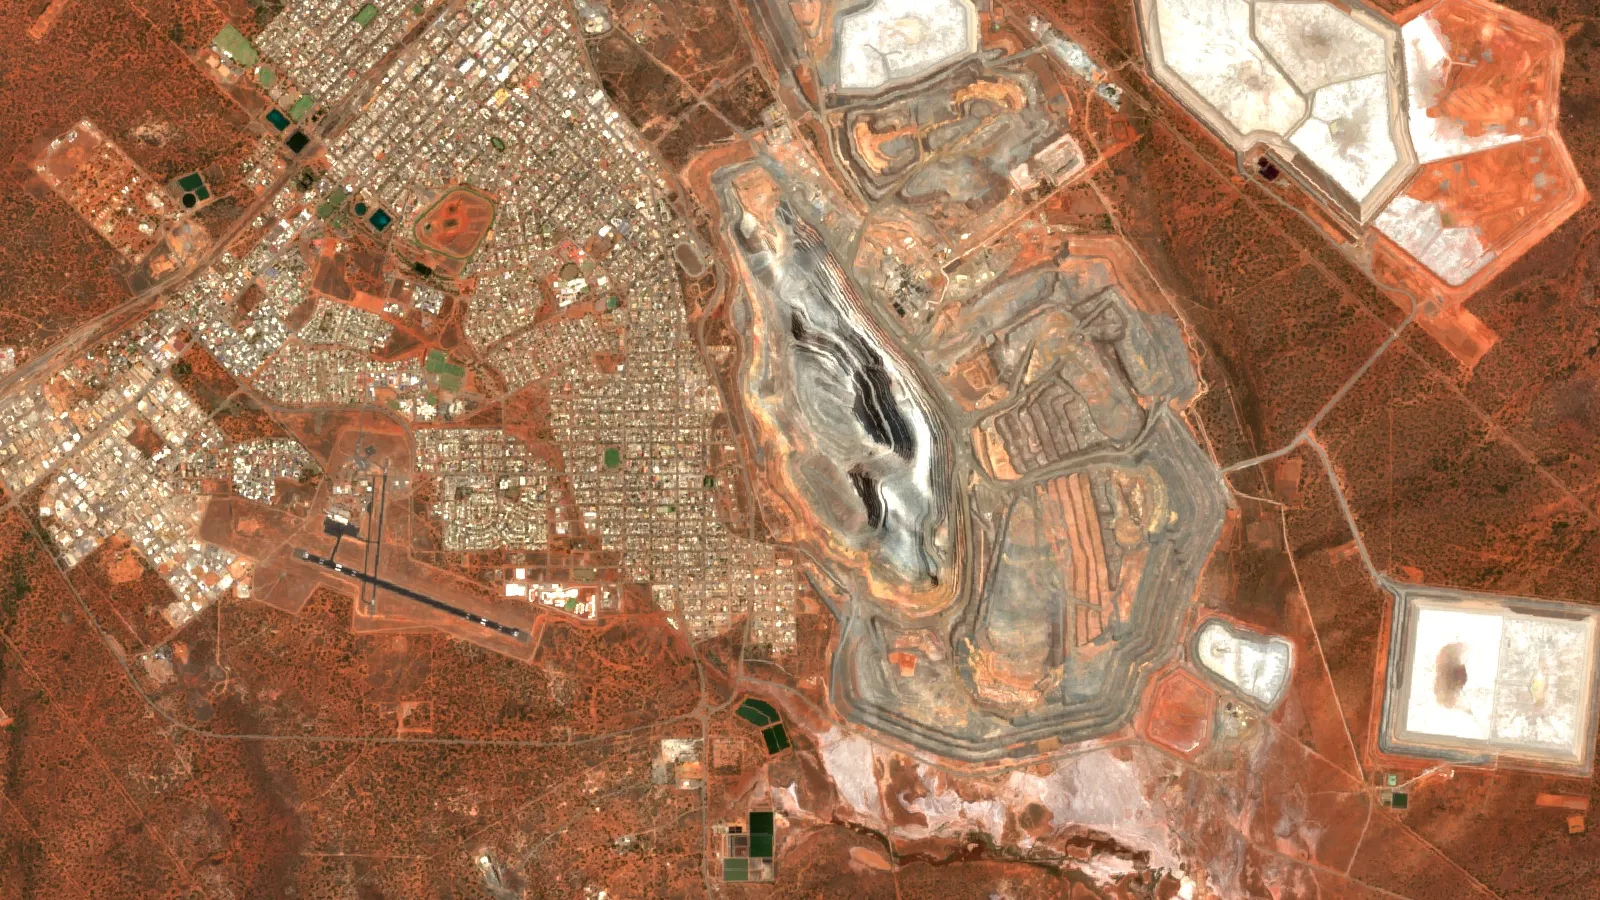
Northern Star sold 1.54 million ounces in FY26, more than twice Evolution’s 715,000. Ten more ASX-listed Australian producers made 140,000 ounces or more.
Key takeaways
- Northern Star Resources sold 1,543,000 oz of gold in the year to 30 June 2026 at an AISC of A$2,698/oz.
- Evolution Mining produced 715,000 oz at A$1,717/oz, helped by copper credits.
- Twelve ASX-listed Australian gold miners produced at least 140,000 oz in FY26; Capricorn Metals was next at 123,589 oz.
- Westgold grew output 19%, while Ramelius fell from 302,882 oz to 190,261 oz sold after Edna May closed.
- Vault Minerals and Genesis Minerals plan to merge in November 2026, targeting about 600,000-700,000 oz a year.
In this article
- Australian gold mining companies ranked by gold output
- How we chose the list
- The twelve producers in detail
- What it costs Australian gold miners to produce an ounce
- Who grew and who shrank
- Mergers reshaping the list
- Foreign gold miners with large Australian mines
- The Gold Coast gold mining company in history
- Estimate a gold miner's annual margin
- What to check before dealing with an Australian gold miner
- Copper and the gold-copper producers
- Frequently asked questions
The biggest Australian gold mining company by output is Northern Star Resources (ASX: NST), which sold 1,543,000 ounces of gold in the year to 30 June 2026, more than twice the 715,000 ounces produced by second-placed Evolution Mining (ASX: EVN), according to the companies’ own June 2026 quarterly report and full-year results. Behind them sits a tight pack of mid-tier producers, each making between roughly 140,000 and 410,000 ounces a year.
This page ranks the twelve ASX-listed, Australian-based gold miners that produced at least 140,000 ounces in the 2026 financial year (FY26), using each company’s reported figures. You will also find what each one owns, what it costs them to produce an ounce, who grew and who shrank, the mergers now redrawing the list, and a calculator that turns any producer’s output and costs into an annual margin. If you run a mining business that supplies, contracts to or competes with these companies, the tables show where the volume and the cash are.
Most of these ounces come from one state. Western Australia produced 209 tonnes (6.7 million ounces) of gold in 2024-25, 72% of Australian production, and gold sales hit a record A$29 billion, according to the WA government statistics digest. Nine of the twelve companies below run all their Australian mills there.
Australian gold mining companies ranked by gold output
The table lists each company’s FY26 gold output (the year ended 30 June 2026). Most companies report “gold produced”; Northern Star and Ramelius report “gold sold”, which is close to but not the same number. Alkane reports gold-equivalent ounces because it also mines antimony. One ounce here is a troy ounce, about 31.1 grams.
Chart
FY26 gold output of Australia’s largest listed gold miners
Thousand ounces, year to 30 June 2026 (NST and RMS: gold sold; ALK: gold equivalent)
| Rank and company (ASX code) | FY26 gold output (oz) | Main operations | Best known for |
|---|---|---|---|
| 1. Northern Star Resources (NST) | 1,543,000 sold | Kalgoorlie and Yandal (WA), Pogo (Alaska) | Owner of the Kalgoorlie Super Pit and Australia’s largest gold producer |
| 2. Evolution Mining (EVN) | 715,000 | Cowal and Northparkes (NSW), Ernest Henry (QLD), Mungari (WA), Red Lake (Canada) | Gold with large copper by-product credits |
| 3. Perseus Mining (PRU) | 404,998 | Edikan (Ghana), Sissingué and Yaouré (Côte d’Ivoire) | Perth-based miner with all producing mines in West Africa |
| 4. Westgold Resources (WGX) | about 387,000 | Murchison and Southern Goldfields (WA) | Largest number of underground mines among the mid-tiers |
| 5. Regis Resources (RRL) | 379,000 | Duketon (WA), 30% of Tropicana (WA) | Long-running Duketon open pits and underground |
| 6. Vault Minerals (VAU) | 336,540 | Leonora and Deflector (WA), Sugar Zone (Canada) | King of the Hills plant upgrade |
| 7. Greatland Resources (GGP) | 328,986 | Telfer and Havieron (WA) | Revived the Telfer gold-copper mine |
| 8. Genesis Minerals (GMD) | 285,402 | Leonora district (WA) | Fast growth by acquisition, now merging with Vault |
| 9. Ramelius Resources (RMS) | 190,261 sold | Mt Magnet and Penny (WA) | High margins on lower volume after Edna May closed |
| 10. Alkane Resources (ALK) | 168,337 gold equivalent | Tomingley (NSW) plus mines from the Mandalay merger | Gold and antimony |
| 11. Bellevue Gold (BGL) | 143,539 | Bellevue (WA) | High-grade underground mine near Leinster |
| 12. Ora Banda Mining (OBM) | 140,949 | Davyhurst (WA) | Record June 2026 quarter of 39,552 oz |
Sources for each row are listed at the end of the page; the Ramelius, Alkane, Vault and Genesis figures come from Australian Mining’s FY26 results round-up (21 August 2026), and the Greatland figure from its FY26 production report. Just below the cut-off is Capricorn Metals (ASX: CMM), whose Karlawinda mine produced a record 123,589 ounces.
How we chose the list
The metric is gold output in the 2026 financial year, as reported by each company to the ASX or summarised by mining media from those reports. To qualify, a company had to be listed on the ASX, run from Australia and report a June year end. We set the cut-off at 140,000 ounces, which captures every producer we found at or above that level; the next company down, Capricorn Metals, reported 123,589 ounces.
Three groups are left out on purpose. Foreign-headquartered miners with big Australian mines, such as Gold Fields, are covered in their own section below. Companies that report on a calendar year cannot be compared with FY26 figures. Explorers and developers without a producing mine have no output to rank.
A ranking by output is not a ranking by quality or share value. A smaller miner with low costs can earn more per ounce than a larger one with high costs, which is why the next sections compare costs and growth. For a world view, see our list of the top 20 gold mining companies in the world by output and the top 10 gold mining companies.
The twelve producers in detail
Northern Star Resources
Northern Star sold 1,543,000 ounces in FY26 at an all-in sustaining cost (AISC) of A$2,698 per ounce, within its original guidance. AISC is the industry’s standard measure of what it costs to keep a mine running, including mining, processing, royalties and the capital needed to sustain output, but not new growth projects. In the June 2026 quarter, the Kalgoorlie centre alone sold 227,730 ounces and Yandal 123,937 ounces. Northern Star also owns the Pogo mine in Alaska.
Infographic
From ore to gold bar in 4 steps
- 1MineDrill, blast and haul ore from pit or underground.
- 2CrushCrush and grind ore to fine particles.
- 3LeachDissolve gold and catch it on carbon.
- 4PourStrip the carbon and pour doré bars.
Evolution Mining
Evolution produced 715,000 ounces in FY26, down 5% from 751,000, at an AISC of A$1,717 per ounce, among the lowest in the group. That low figure reflects copper: Evolution sells copper from Northparkes and Ernest Henry and counts it as a credit against gold costs. Its achieved gold price was A$6,023 per ounce, and the company has guided FY27 production at 660,000 to 730,000 ounces.
Perseus Mining
Perseus is headquartered in Perth but mines in West Africa. Its FY26 output was 404,998 ounces, down from 496,551, as the main ore sources at Yaouré and Edikan moved to new pits, according to its 26 August 2026 results release. For readers who know West Africa, Edikan is in Ghana, the former Gold Coast colony.
Westgold Resources
Westgold produced about 387,000 ounces in FY26, up 19% on the 326,000 ounces of FY25 and above guidance. It runs a large group of mostly underground mines feeding several mills in the Murchison and Southern Goldfields of Western Australia.
Regis Resources
Regis produced 379,000 ounces, at the top of its guidance, from its Duketon operations and its 30% share of Tropicana, which is run by AngloGold Ashanti. Group AISC was A$2,945 per ounce, and FY27 guidance is 360,000 to 400,000 ounces.
Vault Minerals
Vault produced 336,540 ounces and finished FY26 with A$841.6 million in cash and bullion and no debt. It closed out all of its remaining gold hedges, 57,542 ounces, for A$203.9 million. Its King of the Hills plant upgrade at Leonora is due to lift throughput by about 50%, and it targets FY27 production of 355,000 to 375,000 ounces before the Genesis merger.
Greatland Resources
Greatland produced 328,986 ounces from Telfer in FY26, above its 260,000 to 310,000 ounce guidance, at an AISC of A$2,179 per ounce. Telfer ore reserves rose by 1.1 million ounces to 1.8 million ounces. Guidance for FY27 is 260,000 to 300,000 ounces.
Genesis Minerals
Genesis increased production by 33% to 285,402 ounces at an AISC of A$2,670 per ounce, meeting guidance for the third year in a row. During the year it bought Magnetic Resources for A$447 million in cash plus 28 million shares, adding the 2.2-million-ounce Lady Julie deposit.
Ramelius Resources
Ramelius sold 190,261 ounces in FY26, down from 302,882 ounces, after operations at Edna May ended. A realised price of A$5,400 per ounce still gave it a record EBITDA margin of 74%. EBITDA means earnings before interest, tax, depreciation and amortisation, a common measure of operating cash profit.
Alkane Resources
Alkane’s merger with Mandalay Resources made it a three-mine gold and antimony producer. Gold-equivalent output rose 140% to a record 168,337 ounces, and the company has guided FY27 at 163,000 to 177,000 gold-equivalent ounces.
Bellevue Gold
Bellevue reported record production of 143,539 ounces, in the top half of its 130,000 to 150,000 ounce guidance, at an AISC of A$2,827 per ounce.
Ora Banda Mining
Ora Banda produced 140,949 ounces from its Davyhurst operation in FY26, meeting its target of about 141,000 ounces, with a record 39,552 ounces in the June 2026 quarter.
All of these companies run the same basic chain from ore to bar: drill, blast, haul, crush, leach the gold into solution, recover it on carbon and pour doré. Where ore varies a lot in grade, many also look at ore sorting to reject waste before the mill.
▶ How gold is mined and refined, from rock to ring · 5:27
What it costs Australian gold miners to produce an ounce
AISC is the number buyers, lenders and contractors watch most closely, because it shows how much room a miner has if the gold price falls. Among the producers that published a full-year group figure, costs ranged from A$1,629 per ounce at Capricorn’s Karlawinda to A$2,945 per ounce at Regis. Evolution’s A$1,717 per ounce is low because copper revenue is subtracted from costs.
Chart
All-in sustaining cost per ounce, FY26
A$ per ounce, full-year group figures
Compare that with the price. Kitco showed a gold bid of US$4,098.30 per ounce on 13 November 2026 (Kitco gold chart). The companies above report in Australian dollars: Evolution achieved A$6,023 per ounce over FY26 and Ramelius A$5,400. Even the highest-cost producer in the chart therefore earned well over A$2,000 per ounce above AISC through the year, which explains the record profits and dividends reported in August 2026.
Costs differ for reasons a business owner can see on the ground: open pit or underground, ore grade, haul distance, power source and the size of the mill. Fuel and haul trucks are a large share of cost at every Western Australian site, which is why fleet management and site weather data such as a weather API for planning around heavy rain matter to operators.
Who grew and who shrank
FY26 was not a year of growth for everyone. Westgold and Genesis increased output strongly, Regis held steady, while Ramelius and Perseus fell as old pits closed or new ones ramped up. Evolution slipped 5%. The chart compares FY25 and FY26 for companies that published both figures.
Chart
Gold output, FY25 vs FY26
Thousand ounces (Ramelius: gold sold)
Falling output does not always mean a weaker company. Ramelius made less gold but a higher margin, and Perseus explained its drop as a planned change of ore sources. For a supplier or contractor, though, ounces drive the volume of work: fewer tonnes milled means fewer reagents, fewer haul hours and fewer drill metres.
Mergers reshaping the list
The ranking above will look different within a year. The biggest change is the proposed merger of Vault Minerals and Genesis Minerals, scheduled to complete in November 2026. Genesis says the combined group would produce around 600,000 to 700,000 ounces a year, with 34 million ounces of resources and 9 million ounces of reserves; Vault says it would be a top-three gold producer in Australia. That would place it behind Northern Star and close to Evolution.
Other deals during FY26 already show in the numbers: Alkane’s merger with Mandalay Resources, and Genesis’s purchase of Magnetic Resources. Consolidation tends to favour companies that own several mills in one district, such as the Leonora area, because ore from one mine can be trucked to whichever plant has spare capacity.
Foreign gold miners with large Australian mines
Several of the country’s biggest gold mines belong to companies based elsewhere, which is why they do not appear in the ranking. Gold Fields, headquartered in South Africa, describes itself as a producer with eight operating mines in Australia, Ghana, Peru and South Africa and about 2.04 million gold-equivalent ounces a year (Gold Fields). AngloGold Ashanti runs Tropicana, where Regis holds 30%. If you are bidding for work, these operations matter as much as the ASX-listed producers.
For where the mines sit on the ground, see our Australia mineral deposits map and the NSW gold mines map. For deep, high-value deposits around the world, see the highest gold mines by reserves.
The Gold Coast gold mining company in history
Many people searching for a “Gold Coast gold mining company” are not looking for Queensland at all. The Gold Coast was the British colonial name for what is now Ghana, and its best-known gold miner was the Ashanti Goldfields Corporation. Its Ashanti mine at Obuasi, 56 km south of Kumasi, has produced gold since 1897. In 2004 Ashanti merged with AngloGold to form AngloGold Ashanti, which was then the world’s second-largest gold producer (Ashanti Goldfields history).
The link to Australia is direct. AngloGold Ashanti is the operator of Tropicana in Western Australia, and Perth-based Perseus Mining runs Edikan in Ghana today. The Queensland city called Gold Coast, by contrast, is a coastal tourism centre and has no major gold mine.

▶ Who can hold a small-scale mining licence in Africa · 5:16
Estimate a gold miner’s annual margin
The calculator below takes three numbers you can find in any quarterly report: ounces produced, AISC per ounce, and the gold price. It returns an estimate of the margin before tax, growth capital and exploration. Use it to compare producers on the same price, or to test how much a fall in price would squeeze a high-cost miner. The gold price is an example: enter today’s price in Australian dollars.
Calculator
What margin does a gold miner earn?
Enter a producer’s ounces, its AISC and a gold price.
- Margin per ounce (A$): $3,300
- Margin as share of price (%): 55.0
- Price fall that wipes out margin (%): 55.0
Example values only, not a forecast. Gold price is an input: example, use today’s price. All money is in A$. Margin is before tax, growth capital and exploration.
What to check before dealing with an Australian gold miner
If you are a mining business owner looking to sell services, buy a project or partner with one of these companies, check five things before the first meeting:
- Guidance and track record. Has the company met production and cost guidance in recent years? Genesis met guidance for the third year in a row in FY26; that history says something about planning discipline.
- Mine life and reserves. Reserves are the part of a resource that has been shown to be economic to mine. A company with growing reserves, such as Greatland at Telfer, has years of work ahead.
- Cash and debt. Vault reported no debt and A$841.6 million in cash and bullion at 30 June 2026; companies with cash pay suppliers on time and can fund expansions.
- Pending deals. A merger can change who signs contracts. Check announcements on the ASX before you rely on an existing relationship.
- Environmental and traceability rules. Buyers increasingly ask where gold came from and what it cost the environment. Read up on acid mine drainage, carbon footprinting and product traceability.
If you hold your own licence and want to compare it with ground these companies are working, satellite imagery can show alteration, structure and disturbance across the area before you spend on drilling. Farmonaut prepares such screening reports for licence owners on request.
▶ Can a satellite detect gold? The honest answer · 2:00
Copper and the gold-copper producers
Copper is a big part of the story for several Australian gold miners. Evolution’s Northparkes and Ernest Henry produce copper alongside gold, and Telfer is a gold-copper mine. If copper interests you, see the largest copper producers worldwide, the copper mines in the United States, and how uranium, gold and copper ores are processed in seven steps.
Frequently asked questions
What is the largest gold mining company in Australia?
Northern Star Resources is the largest Australian gold miner by output. It sold 1,543,000 ounces in the year to 30 June 2026, more than twice Evolution Mining’s 715,000 ounces.
How many gold mining companies are there in Australia?
Dozens of companies hold gold mining leases, but only about a dozen ASX-listed Australian producers made 140,000 ounces or more in FY26. Many more are explorers or small producers.
Which Australian gold miner has the lowest costs?
Among full-year FY26 group figures, Capricorn Metals reported the lowest AISC at A$1,629 per ounce, followed by Evolution at A$1,717 per ounce, which is helped by copper credits.
What was the Gold Coast gold mining company?
The Gold Coast was the colonial name for Ghana. Its most famous gold miner was the Ashanti Goldfields Corporation, whose Obuasi mine has produced since 1897 and which merged with AngloGold in 2004 to form AngloGold Ashanti.
Is there gold mining at the Gold Coast in Queensland?
No major gold mine operates at Queensland’s Gold Coast. Queensland gold production comes from inland areas, for example Evolution’s Ernest Henry copper-gold mine near Cloncurry.
Which Australian gold miners also produce copper?
Evolution Mining produces copper at Northparkes and Ernest Henry, and Greatland’s Telfer is a gold-copper mine. Copper revenue lowers the reported cost of each gold ounce.
What is AISC in gold mining?
All-in sustaining cost is the cost of producing an ounce including mining, processing, royalties, site overheads and sustaining capital, but not new projects. It is the most used measure for comparing producers.
Which Australian gold miners operate overseas?
Perseus Mining’s producing mines are in Ghana and Côte d’Ivoire, Northern Star owns Pogo in Alaska, and Evolution owns Red Lake in Canada. Vault Minerals is developing Sugar Zone in Canada.
Which gold miners are merging in Australia?
Vault Minerals and Genesis Minerals agreed to merge, with completion scheduled for November 2026. Alkane Resources merged with Mandalay Resources during FY26.
Why do some companies report gold sold instead of gold produced?
Gold sold counts ounces delivered to buyers during the period, while gold produced counts ounces poured. Timing of shipments makes the two numbers differ slightly, so compare like with like where you can.
This page is for information only and is not investment advice. Company figures are as reported for the year to 30 June 2026 and may be revised; check the latest ASX announcements before acting.
Farmonaut mining
Screen your mining licence
Mining business owners can request a quote to screen a licence area from satellite data and rank exploration targets before drilling.
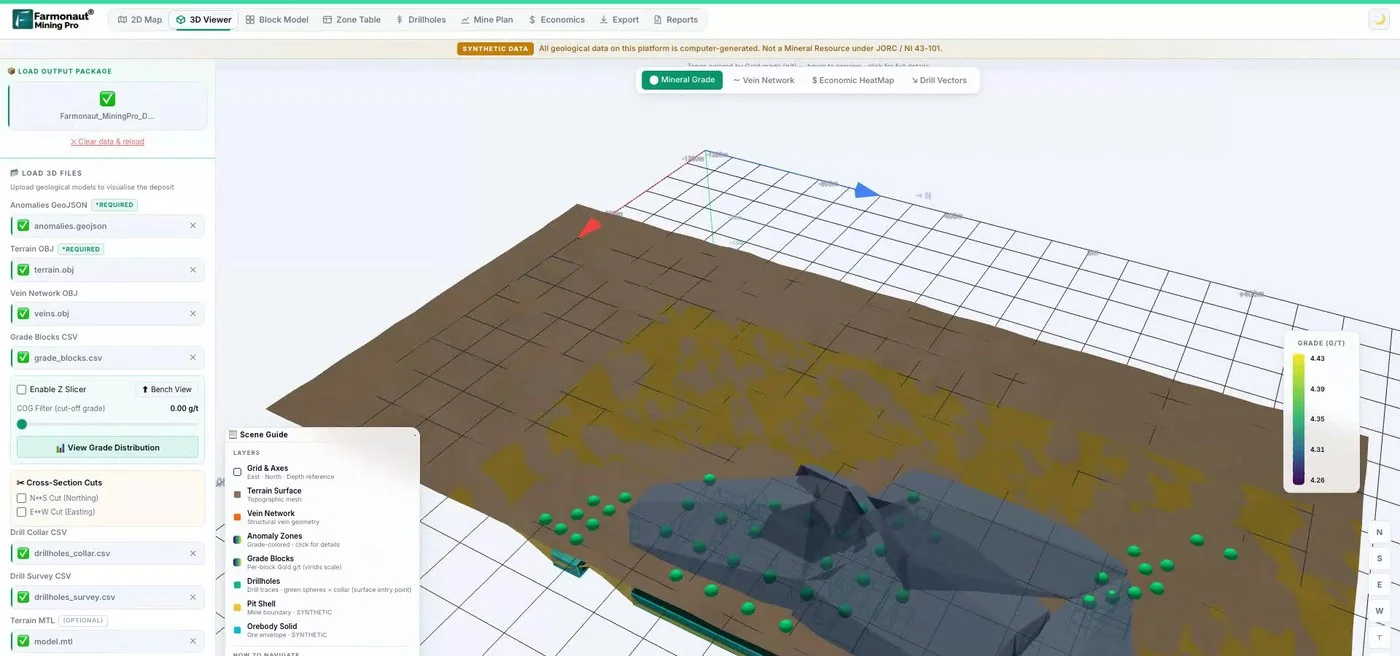
Mining Pro sample view, synthetic data
Keep reading
Sources
- Northern Star Resources, June 2026 quarterly activities report: nsrltd.com
- Evolution Mining, FY26 full year financial results (ASX, 19 Aug 2026): announcements.asx.com.au
- Perseus Mining, FY26 results release (ASX, 26 Aug 2026): announcements.asx.com.au
- Australian Mining, Major gold miners FY26 results (21 Aug 2026): australianmining.com.au
- Government of Western Australia, 2024-25 Statistics Digest: wa.gov.au
- Colitco, Westgold FY26 results summary: colitco.com
- The Motley Fool Australia, Regis Resources FY26 production (24 Jul 2026): fool.com.au
- Proactive Investors, Greatland tops FY26 guidance: proactiveinvestors.com.au
- IBTimes Australia, Bellevue Gold record FY26 production: ibtimes.com.au
- Kalkine Media, Ora Banda June 2026 quarter and FY26 output: kalkinemedia.com
- The Motley Fool Australia, Capricorn Metals record FY26 production (31 Jul 2026): fool.com.au
- Gold Fields, company overview: goldfields.com
- Wikipedia, Ashanti Goldfields Corporation: en.wikipedia.org
- Kitco, gold price chart (read 13 Nov 2026): kitco.com
Discussion
Questions, corrections or field experience? Share them below. First-time comments are reviewed before they appear, and your email is never published.
No comments yet. Be the first to add a question or your experience.

 CIMISCO SARL
 Mining SARL
 SenGold Invest SAS
 Sania Corporation
 Sean Mining Limited
 NTS Group (Pty) Ltd
 Mine4Africa
 Lithspo Minerals Limited
 Tintina Mining Group
 Dalgety Minerals Pty Ltd
 Vortex Minerals Pty Ltd
 Faith At Work (Pty) Ltd
 Geotech Mining Solutions plc
 Vulcan International Limited
 Kidepo Associates
 GKY Mining
 Alkimy SARL
 Double A Trading
 GemSprout Metals Limited
 Qader Group
 Ileys General Trading
 SG Gold Mining LLC
 VRV Global Pte Ltd
 Omsri International FZE

 Client · Tanzania · Gold
 Client & affiliate partner · Ghana · Gold










