

Gold mining companies · ESG comparison
Gold Miners ESG Performance: Biggest Companies Compared
Newmont is the biggest gold miner by output. On 2025 ESG data, Barrick reported the highest emissions of five producers compared and the highest water reuse of the four that state it, plus four deaths at work. Definitions differ, so this page shows each basis.
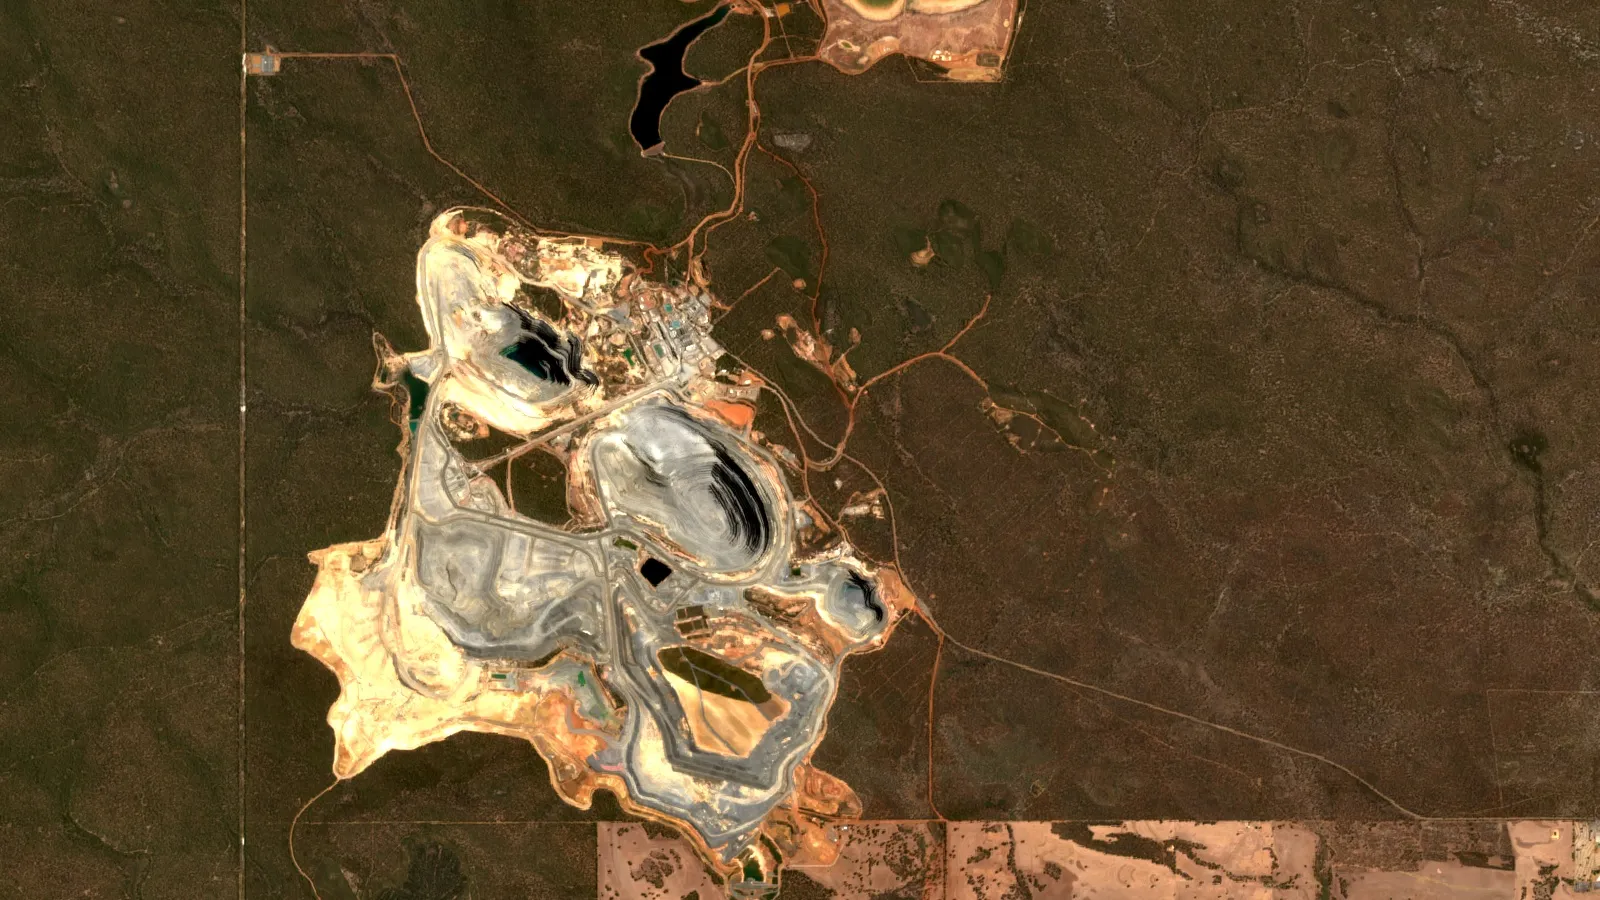
Key takeaways
- Newmont led 2025 output at about 5.89 million ounces (company results).
- Reported Scope 1 and 2 emissions ranged from 0.76 Mt CO2e at B2Gold to a preliminary 7.72 Mt at Barrick (2025 reports).
- Barrick’s TRIFR improved to 0.71, yet it reported four fatalities in 2025, so injury rates and deaths need separate reading.
- Water reuse ranged from 67% at Newmont to 81% at Barrick (2025 reports).
- Boundaries and definitions differ, so these figures are a guide, not a league table.
In this article
- Biggest gold mining companies in the world by output
- Gold miners ESG performance compared
- Emissions: who reports what
- Safety: injury rates and fatalities
- Water reuse and tailings
- Which standards gold miners sign up to
- How to read a gold miner's ESG report
- Carbon cost per ounce calculator
- What smaller operators can take from the majors
- Frequently asked questions
Among the biggest gold mining companies in the world, reported ESG (environmental, social and governance) results for 2025 differ widely. Barrick reported the highest Scope 1 and 2 emissions of the five compared here, at a preliminary 7.72 million tonnes of CO2e, and the highest water reuse of the four that state it, at 81%, but also four deaths at work. Newmont, the largest producer, reported no work-related fatalities at its sites and 4.4 million tonnes of emissions.
Scope 1 means direct emissions, such as diesel burned in haul trucks. Scope 2 means emissions from purchased electricity. CO2e, or carbon dioxide equivalent, puts all greenhouse gases on one scale. This page sets out those figures side by side, explains why they cannot be turned into a simple league table, and gives a calculator that shows what a carbon price could mean per ounce.
Biggest gold mining companies in the world by output
ESG numbers only make sense next to size. Our full list of the top 20 gold mining companies ranked by output shows each company’s reporting basis. The ten largest, by gold produced or sold in the latest full reporting year, are below. The USGS estimates world mine production at 3,300 tonnes for 2025, so even the largest company makes only a modest share of world supply.
| Rank | Company | Home market | Gold output (million oz) | Basis |
|---|---|---|---|---|
| 1 | Newmont | United States | 5.89 | Attributable production |
| 2 | Agnico Eagle Mines | Canada | 3.45 | Payable production |
| 3 | Barrick Mining | Canada | 3.26 | Attributable production |
| 4 | Navoi Mining and Metallurgical Company | Uzbekistan | 3.15 | Total production |
| 5 | AngloGold Ashanti | United States HQ (UK-registered) | 3.09 | Production |
| 6 | Zijin Mining | China | 2.89 | Mined gold, about 90 t |
| 7 | Polyus | Russia | 2.53 | Total output |
| 8 | Gold Fields | South Africa | 2.44 | Attributable gold-equivalent |
| 9 | Kinross Gold | Canada | 2.01 | Attributable gold-equivalent |
| 10 | Northern Star Resources | Australia | 1.63 | Gold sold, year to June 2025 |
Figures are for 2025 unless stated and come from company results, with a source for each row on our top 20 page (for example Newmont). Gold-equivalent output converts silver or copper into ounces of gold. Regional lists differ again: see our guide to the biggest gold mining companies in Australia, and our overview of the biggest iron and gold producers for how gold compares with bulk metals.
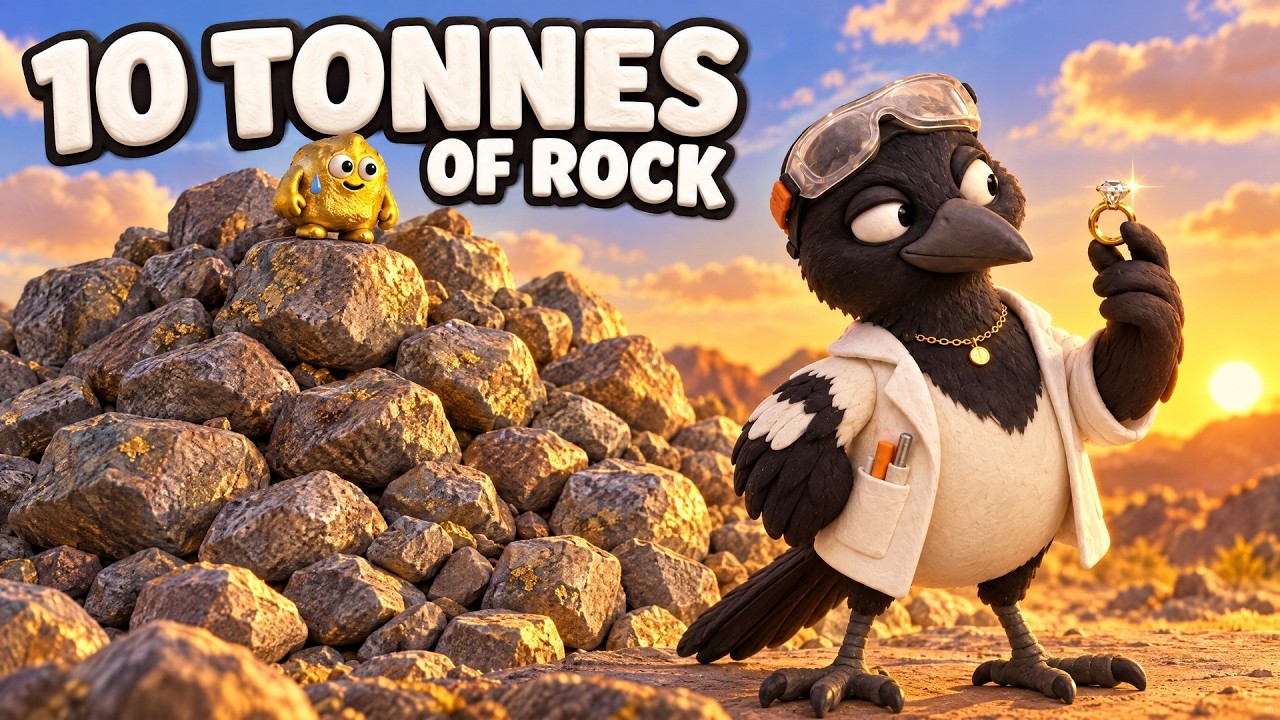
▶ Farmonaut explainer in clay: how gold is mined and refined, from rock to ring (5:27). · 5:27
Gold miners ESG performance compared
How we chose the companies and metrics
We compare five producers whose 2025 sustainability or annual reports state these measures: Newmont, Agnico Eagle, Barrick, AngloGold Ashanti and B2Gold. B2Gold, at about 0.98 million ounces, sits outside the top ten and is included as a mid-tier reference. The table is not a ranking, because the companies measure things in different ways. All figures are as the companies report them.
| Company | Scope 1 and 2 (Mt CO2e) | Injury rate (TRIFR) | Work-related deaths | Water reused or recycled |
|---|---|---|---|---|
| Newmont | 4.4 | Not shown | 0 at its sites | 67% |
| Agnico Eagle | 1.36 | 4.83 | 1 | 74% |
| Barrick | 7.72 (preliminary, location-based) | 0.71 | 4 | 81% |
| AngloGold Ashanti | 1.81 | 0.97 (managed operations) | 0 at managed operations | 70% |
| B2Gold | 0.757 | 0.35 | 0 | Not shown |
Sources: Newmont 2025 sustainability report, Agnico Eagle 2025 sustainability report, Barrick 2025 annual report, AngloGold Ashanti 2025 annual report, B2Gold 2025 responsible mining report and B2Gold climate strategy report.
Emissions: who reports what
Barrick’s total is the largest in this group, and its report links the rise from 2024 mainly to more limestone used for neutralization at Pueblo Viejo and higher output at Porgera. Barrick also mines copper, so its total does not relate to gold alone.
Chart
Emissions change on reported figures
Million tonnes CO2e, Scope 1 and 2, 2024 versus 2025, three producers
Chart
Scope 1 and 2 emissions, 2025
Million tonnes CO2e, company-reported; Barrick preliminary and location-based
Newmont’s 4.4 million tonnes is 12% below its restated 2018 baseline of 5.0 million tonnes. Its target is a 32% cut in absolute Scope 1 and 2 emissions by 2030. It also reports 5.7 million tonnes of Scope 3 emissions, which are those in its supply chain and joint ventures. The company says power deals are part of the plan, including a wind supply for Boddington in Western Australia, the district shown in the satellite view above. Boddington alone emitted about 906,000 tonnes in 2025.
AngloGold Ashanti’s total rose to 1.81 million tonnes from 1.50 million tonnes in 2024. It bought Centamin, owner of the Sukari mine, in late 2024, so part of the rise reflects a larger group. It aims for a 30% reduction by 2030 and net zero by 2050.
Agnico Eagle reports 1.36 million tonnes, with an intensity of 0.39 tonnes of CO2e per ounce, against 0.38 the year before. Its target is a 30% cut by 2030 and net zero by 2050. B2Gold reports 757,000 tonnes and 0.77 tonnes per ounce, up from 699,000 tonnes in 2024. That rise comes from adding Back River; its three earlier mines fell to 673,000 tonnes, and intensity fell from 0.89. It has a 30% reduction target for 2030 against a 2021 baseline.
Emissions per ounce: a rough comparison
Intensity means emissions for each ounce produced. Only Agnico Eagle and B2Gold state it in the figures above. For the others we divided reported emissions by gold output, which gives only a rough number.
| Company | t CO2e per gold ounce | How to read it |
|---|---|---|
| Agnico Eagle | 0.39 | Company figure |
| AngloGold Ashanti | about 0.65 | Our division: 1.81 Mt by 2.79 Moz from managed mines (3.09 Moz less Kibali’s 303,000 oz) |
| Newmont | about 0.75 | Our division: 4.4 Mt by 5.89 Moz; other metals are not removed, and the ounces include mines Newmont does not manage |
| B2Gold | 0.77 | Company figure |
| Barrick | about 2.37 | Our division: 7.72 Mt by 3.26 Moz; includes copper mines and is overstated for gold |
Safety: injury rates and fatalities
TRIFR, the total recordable injury frequency rate, counts recordable injuries per million hours worked. A lower rate is better, but what counts as recordable matters. Agnico Eagle says its 4.83 rate includes lost-time injuries, restricted work and medical aids for employees and contractors, which helps explain why it looks high next to the others.
Chart
Injury rate (TRIFR), 2025
Recordable injuries per million hours, four producers, as each company defines them
Low injury rates do not mean no deaths. Barrick’s TRIFR improved 24% to 0.71, yet its report records four fatalities in 2025: one at Nevada Gold Mines, one at Bulyanhulu and two at Kibali, all underground. Agnico Eagle reported one death after two years with none. B2Gold reported none at a TRIFR of 0.35, while missing its goal of reducing the rate from 2024.
Security deaths are often counted apart from workplace deaths. AngloGold Ashanti reports no workplace deaths at managed operations and a record TRIFR of 0.97, but also describes security-related fatalities at Obuasi in clashes between public security forces and illegal miners. Newmont’s report describes two fatal security incidents near Ahafo South in Ghana in early 2025, and a fatality at Tanami in Australia on 4 February 2026, which falls outside the 2025 count. Smaller producers show the same tension: Fresnillo cut its TRIFR to 6.26 but reported two fatal accidents. Our page on mine safety innovations covers common controls.
Water reuse and tailings
Water reuse is the share of water a site uses again rather than drawing new supply. Barrick reports 81% for 2025 against an 80% target. Agnico Eagle reports 74%, up from 68%. AngloGold Ashanti reports 70%, and Newmont 67%, after revising how some sites calculate it; another page of its report still gives 71%. Newmont also says overall water consumption is 10% below its 2018 baseline, and 12% below at the water-stressed Cerro Negro and Peñasquito sites.
Chart
Water reused or recycled, 2025
Percent, four producers, company-reported
Reuse rates depend on climate and processing, so a desert mine and a wet tropical mine are not directly comparable. Tailings are the waste left after processing. Barrick says it has disclosed conformance with the Global Industry Standard on Tailings Management, known as GISTM, for its sites in scope. Sustainable gold mining practices covers site-level measures in more detail.

▶ Farmonaut explainer: the seven environmental impacts of mining (2:31). · 2:31
Which standards gold miners sign up to
Two frameworks come up most often. The ICMM member list includes AngloGold Ashanti, Barrick, Gold Fields and Newmont. ICMM is the International Council on Mining and Metals. The World Gold Council’s Responsible Gold Mining Principles set out what responsible gold mining means, and companies that implement them must get assurance from an independent third party.
Agnico Eagle’s report names the Principles and the Mining Association of Canada’s Towards Sustainable Mining programme. Newmont says PwC completed limited assurance on parts of its reporting. Outside scores can add a view: CDP scored Barrick A- for both climate change and water in its September 2025 questionnaire round. CDP runs a global environmental disclosure system.
How to read a gold miner’s ESG report
For an investor, consultant or licence owner benchmarking a project, these checks catch most false comparisons:
Infographic
Reading an ESG figure in 4 steps
- 1BoundaryFind which operations the figure covers.
- 2MethodCheck definitions, such as location-based or market-based.
- 3BaselineSee whether the base year was restated.
- 4AssuranceCheck what an outside party reviewed.
- Check the boundary. Managed operations, attributable share and consolidated totals give different numbers. Kibali, for example, appears in some AngloGold Ashanti figures and not others.
- Check the method. Location-based and market-based Scope 2 can differ. Barrick quotes location-based; Newmont’s site table is market-based.
- Check the baseline. Newmont restated its baseline after selling assets, so a past percentage may not match a new one.
- Look at absolute and intensity together. Selling a mine lowers a total without making any site cleaner.
- Read deaths and injury rates separately. A single rate can hide serious events, and security incidents may sit in another section.
- Ask what was assured. Limited assurance on selected data is not an audit of every claim.
- Note preliminary figures. Barrick’s 2025 emissions were stated as preliminary in its annual report.
Carbon cost per ounce calculator
Emissions become a financial question when a carbon price or tax applies. Use the calculator to test that against your own figures. For scale, gold futures were at about US$4,124 per ounce on MINING.COM on 5 November 2026, so at example inputs a carbon cost is small against the price. It can matter more for high-intensity or thin-margin ounces.
Calculator
What would a carbon price cost per ounce?
Enter your own output, intensity and prices. The defaults are round examples.
- Emissions (t CO2e per year): 50,000
- Carbon cost per year (US$): $2,500,000
- Margin per ounce before carbon (US$): $2,000
- Carbon cost as share of margin (%): 1.2%
Example values only, not figures for any company and not a forecast. Gold price and carbon price are inputs: example, use today’s price. All money is in US$. For intensity, Agnico Eagle reports 0.39 and B2Gold 0.77 t CO2e per ounce for 2025. Assumes the carbon price applies to all Scope 1 and 2 emissions, which depends on local rules.
What smaller operators can take from the majors
Licence owners rarely need a report of this size, but buyers and lenders ask similar questions early. Start with records you can already keep: fuel and power use, water drawn and reused, injuries, and community complaints. These feed directly into the emissions and safety figures used above.
Early exploration choices also shape later footprint. Remote screening with satellite-based mineral detection causes no ground disturbance during that stage and can help decide where field crews go first; it produces exploration targets ahead of any resource estimate, and it is not an environmental clearance. Planning questions for one major producing country are covered in our note on the future of Australian mining. For a project-specific discussion, use the mining query form or contact us.

▶ Farmonaut explainer: how satellites help in gold exploration (4:25). · 4:25
Frequently asked questions
What is the biggest gold mining company in the world?
Newmont, by output. It reported about 5.89 million ounces for 2025, ahead of Agnico Eagle at 3.45 million and Barrick at 3.26 million.
What are the top 10 gold mining companies in the world?
By latest full-year gold output: Newmont, Agnico Eagle, Barrick, Navoi Mining, AngloGold Ashanti, Zijin, Polyus, Gold Fields, Kinross and Northern Star. Reporting bases differ, as the table shows.
Which is the best gold company in the world?
There is no single answer, as it depends on the measure. Newmont is largest by ounces. Among the producers here that state each figure, Barrick reports the highest water reuse and B2Gold the lowest injury rate, on differing definitions.
How do gold miners compare on ESG performance?
Their 2025 reports show Scope 1 and 2 emissions from about 0.76 to 7.72 million tonnes of CO2e among the five compared, and water reuse from 67% to 81% among four. Boundaries differ, so read them as a guide.
Which gold miner has the lowest emissions per ounce?
Among the five compared here, Agnico Eagle reports 0.39 tonnes of CO2e per ounce. It is the lowest figure in this group, but not a claim about the whole industry.
What does TRIFR mean in mining?
Total recordable injury frequency rate: recordable injuries per million hours worked. Companies can differ on what they count as recordable.
Are Scope 3 emissions included in these figures?
No. The comparison uses Scope 1 and 2. Newmont separately reports 5.7 million tonnes of Scope 3 emissions for 2025.
Which gold companies are ICMM members?
ICMM’s member list includes AngloGold Ashanti, Barrick, Gold Fields and Newmont, along with Minsur, which mines gold among other metals.
What are the Responsible Gold Mining Principles?
A World Gold Council framework setting out what responsible gold mining means. Companies that implement it must obtain assurance from an independent third party.
Do the big gold miners also produce other metals?
Yes. ICMM describes Newmont as also producing copper, zinc, lead and silver, and Barrick as a gold and copper producer. For copper itself, see our page on top copper mining countries.
Where do the largest gold miners operate?
Across many countries; no country makes more than about 12% of world output on USGS 2025 estimates. See the major gold producing countries and active US gold regions.
This page is for information only. It is not investment advice. Company figures are as reported and can be restated.
Farmonaut mining
Map your own licence area from space
Request a quote to screen your licence area with satellite data and produce exploration targets, ahead of a resource estimate.

Mining Pro sample view, synthetic data
Keep reading
Sources
- Newmont, 2025 Annual Sustainability Report: s24.q4cdn.com
- Newmont, full-year 2025 results: seekingalpha.com
- Agnico Eagle, 2025 Sustainability Report: s205.q4cdn.com
- Barrick Mining, 2025 Annual Report: s25.q4cdn.com
- AngloGold Ashanti, 2025 Annual Report: minedocs.com
- B2Gold, 2025 Responsible Mining Report: s204.q4cdn.com
- B2Gold, 2025 Climate Strategy Report: s204.q4cdn.com
- Fresnillo, 2025 Annual Report: fresnilloplc.com
- ICMM, our members: icmm.com
- World Gold Council, Responsible Gold Mining Principles: gold.org
- USGS, Mineral Commodity Summaries 2026: Gold: pubs.usgs.gov
- MINING.COM, gold price page (5 November 2026): mining.com
Discussion
Questions, corrections or field experience? Share them below. First-time comments are reviewed before they appear, and your email is never published.
No comments yet. Be the first to add a question or your experience.

 Dalgety Minerals Pty Ltd
 Vortex Minerals Pty Ltd
 Faith At Work (Pty) Ltd
 Geotech Mining Solutions plc
 Vulcan International Limited
 Kidepo Associates
 GKY Mining
 Alkimy SARL
 Double A Trading
 GemSprout Metals Limited
 Qader Group
 Ileys General Trading
 SG Gold Mining LLC
 VRV Global Pte Ltd
 Omsri International FZE
 G.I.T.T.
 Jaunita Erss Ltd
 Almosi SARL
 SRK Consulting
 Berks Gold Limited
 Mwerezi Minerals Company Limited
 Mining SARL
 SenGold Invest SAS

 Exploration consultancy · South Africa · Gold










