

Reviewed August 2026 against USDA NASS, USDA ERS, and Market Research Future.
Try it: Run your own numbers →
Precision agriculture now reaches 27% of US farms growing crops or raising livestock, according to USDA’s Economic Research Service, while the US precision agriculture market itself is valued at $7.5 billion. Those two figures, one measuring adoption and one measuring market size, are the clearest signal that agriculture technology news has moved from press-release hype to a sector with real spending behind it. This page tracks that sector on an ongoing basis: precision farming, drones, irrigation data, indoor and vertical farming, and the AI advisory tools now built into satellite platforms.
Below you’ll find the current state of each trend with sourced figures, a comparison table of where the technology stands today, and a calculator so you can estimate your own irrigation costs against the national averages USDA publishes every year.
Table of Contents
- Agriculture Technology News: What’s Actually Driving Adoption
- AI-Driven Precision Farming: The Adoption Numbers
- Irrigation Technology: USDA’s Latest Survey Data
- Drones and Automated Machinery in US Fields
- Forestry, Vertical Farming, and Land-Use Technology
- Irrigation Cost Calculator
- Supply Chain Intelligence and Traceability
- Sustainability, Carbon, and Climate Resilience Tools
- Technology Comparison Table
- Where Farmonaut Fits: Satellite and AI Tools
- How to Verify These Numbers Yourself
- Frequently Asked Questions
- Try it: Run your own numbers
Agriculture Technology News: What’s Actually Driving Adoption
The agriculture technology news cycle is dominated by four measurable trends rather than speculative ones: precision farming adoption, irrigation infrastructure spending, drone market growth, and early-stage AI advisory tools. Each has a published figure behind it, not just a projection.
- Precision agriculture is used by 27% of US farms for crop or livestock operations, per USDA ERS data drawn from the Agricultural Resource Management Survey.
- The US precision agriculture market is valued at $7.5 billion as of 2024, according to GM Insights market research.
- US agricultural drones represent a $1.78 billion market as of 2024, per Market Research Future, projected to grow at an 11.36% compound annual growth rate between 2025 and 2035.
- Irrigation infrastructure covers 212,714 US farms operating irrigation systems across 53.1 million acres, according to USDA NASS’s 2023 Irrigation and Water Management Survey.
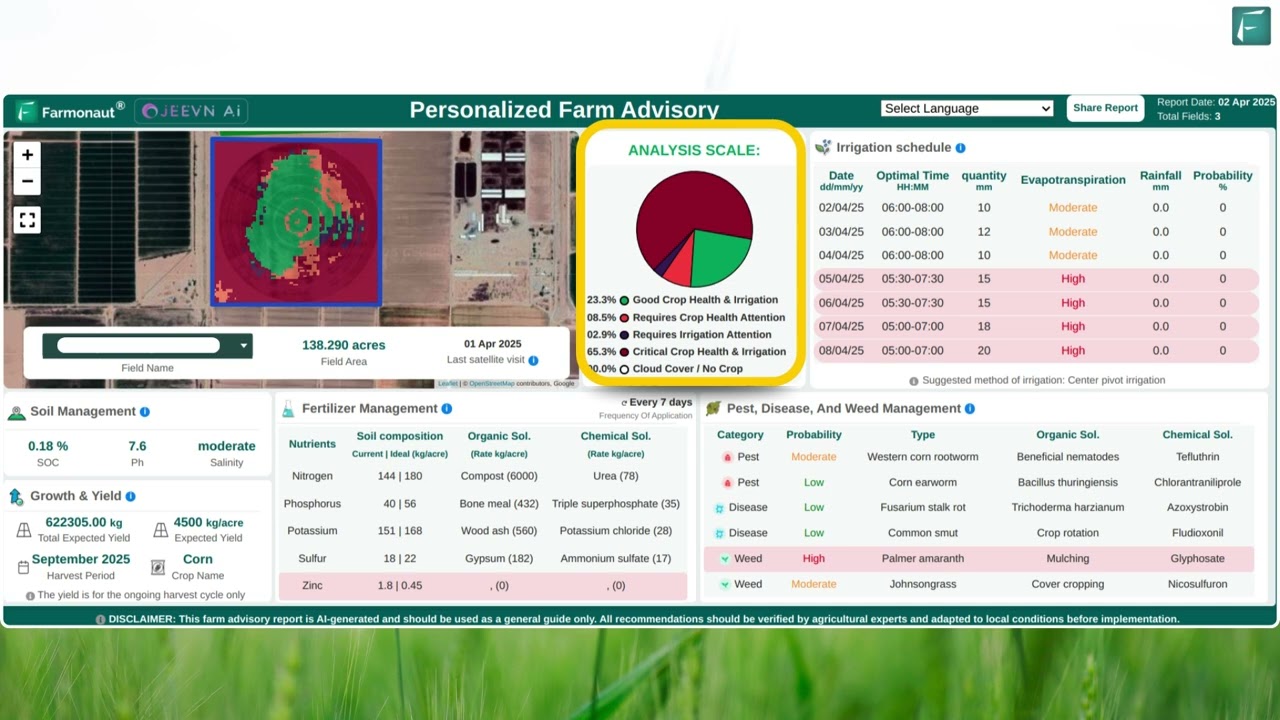
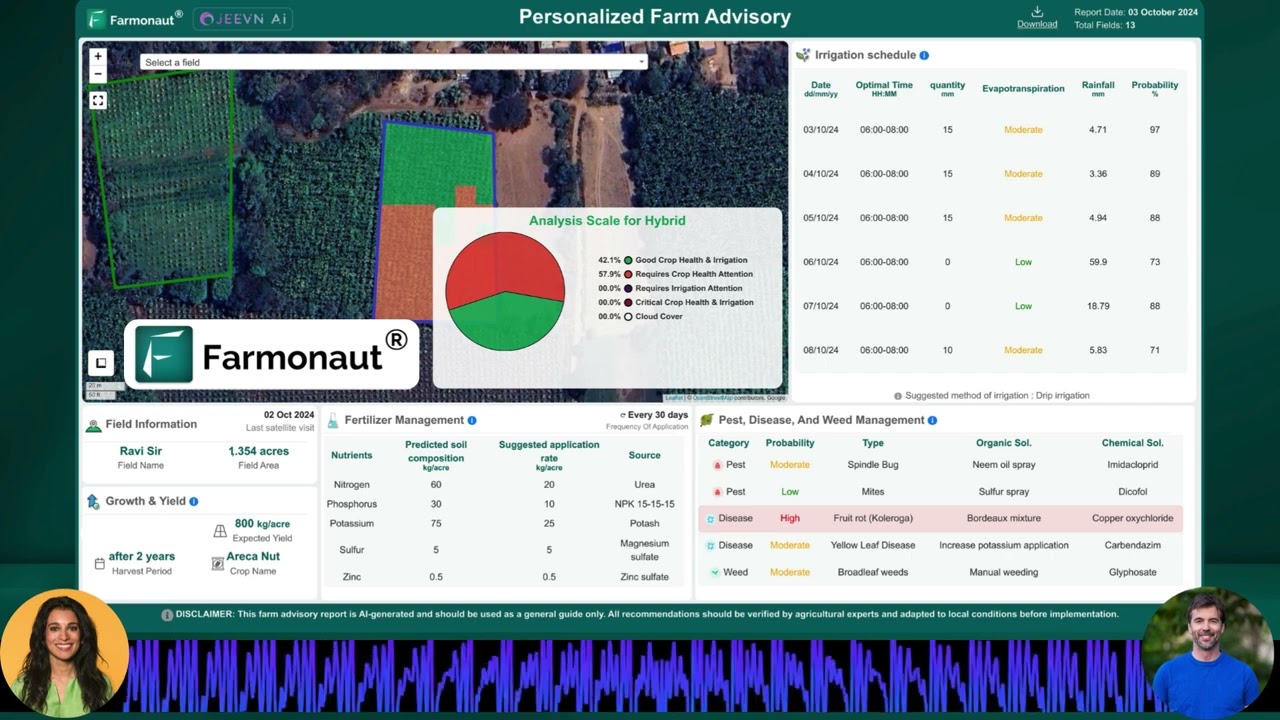
What ties these together is data infrastructure: satellite imagery, soil sensors, and now AI models that turn raw imagery into an irrigation or fertilizer recommendation a farmer can act on the same day. Platforms doing this include Farmonaut, which delivers satellite-driven insights and AI advisories through a web and mobile app: 

AI-Driven Precision Farming: The Adoption Numbers
The 27% precision-agriculture adoption figure from USDA ERS is a national average across all farm sizes and commodity types; adoption is not evenly spread, and ERS breaks it down further by farm size and region in its charts of note series. The underlying driver is straightforward: satellite imagery, drone footage, and IoT soil sensors now feed machine learning models that translate raw data into a plot-level recommendation, rather than a regional average.
These systems typically integrate:
- Satellite imagery that quantifies crop health, soil variability, and growth patterns at field scale.
- Drones capturing multispectral footage to flag early disease or nutrient stress.
- IoT soil sensors monitoring moisture and nutrient levels continuously.
- Machine learning models that correlate these inputs into irrigation, fertilizer, or pest-control recommendations.
On the yield side, IMARC Group’s AI-in-agriculture market research cites a potential 15–20% crop yield increase from AI-driven farm analytics as of 2025. That is a range from published market research, not a guarantee for any individual farm — actual results depend on baseline management practices, soil type, and how consistently the recommendations are followed.

For farms wanting to test this without a large upfront commitment, Farmonaut and comparable platforms offer API access rather than requiring a full farm-management software purchase: API Info | Developer Docs. US-specific innovation trends, including regional case studies, are covered separately here: agriculture in the United States: innovations and trends.
Irrigation Technology: USDA’s Latest Survey Data
Irrigation is the single largest infrastructure line item in US precision agriculture, and USDA NASS’s 2023 Irrigation and Water Management Survey is the most detailed public dataset available on it. As of that survey: 212,714 US farms operated irrigation systems, covering 53.1 million acres and applying 81 million acre-feet of water nationally. Groundwater pumped from on-farm wells supplied 54% of that irrigation water, with wells averaging 241 feet in depth.
The cost side of that survey is just as concrete. US farms spent $3 billion annually on irrigation equipment, facilities, and land improvements, and a further $3.3 billion on energy costs for pumping irrigation water, as of the 2023 survey year.
This survey is refiled roughly every five years as part of the Census of Agriculture cycle, with interim updates; the release cited here was published in October 2024 covering the 2023 crop year. For the current edition, go directly to USDA NASS’s Farm and Ranch Irrigation Survey guide page rather than relying on a cached figure, since acreage and spending shift with commodity prices, drought conditions, and well-permitting activity in western states.
Precision irrigation scheduling — using soil-moisture sensors and satellite evapotranspiration data instead of a fixed calendar — is one of the more measurable near-term ways to cut the $3.3 billion national pumping-energy bill, though USDA’s public data does not yet break out acre-feet saved per acre for sensor-driven versus gravity-fed systems specifically. If your operation wants that comparison for its own soil type and crop mix, the actual method is to run a paired-field trial for one season: track pumping hours and acre-feet applied on a sensor-scheduled block against your baseline calendar-scheduled block, since national averages will not reflect field-specific canal loss, tailwater runoff, or system distribution uniformity.
Drones and Automated Machinery in US Fields
The US agricultural drones market was valued at $1.78 billion in 2024, according to Market Research Future, with a projected 11.36% compound annual growth rate from 2025 through 2035. That CAGR implies steady rather than explosive near-term growth — useful context against headlines that frame drone adoption as an overnight shift.
Multispectral drone imagery is used mainly for two things on working farms: flagging nutrient deficiencies before they show up to the naked eye, and directing targeted pesticide or fungicide application to the specific rows or zones affected, rather than blanket-spraying a field.

Alongside drones, autonomous and semi-autonomous machinery — self-guided tractors, robotic weeders, vision-guided harvesters — is the other major automation category in current agriculture technology news. These systems combine machine vision with the same GPS and sensor infrastructure that supports precision irrigation, letting one operator manage equipment across a larger footprint than manual driving allows. Market Research Future’s report tracks the drone segment specifically rather than the broader autonomous-machinery category, so if you need equipment-level figures (tractor units shipped, robotic harvester adoption by crop), that is a separate report to pull from the same research firm’s agricultural technology coverage.

Forestry, Vertical Farming, and Land-Use Technology
Forestry technology news and vertical/indoor farming news often get grouped with row-crop agriculture in search results, but they run on a different data infrastructure — satellite-based land monitoring for forestry, controlled-environment sensor systems for vertical farming. The global vertical farming market reached $7.4 billion in revenue as of 2025, per IMARC Group. Investment into the sector has been more selective than the market-size figure alone suggests: indoor farming attracted $475 million in venture capital across 74 deals in 2024, according to AgFunder/Pitchbook data cited by IMARC Group.
That gap — a $7.4 billion market against $475 million in fresh 2024 venture funding — reflects a sector that has moved from venture-funded expansion toward operating on existing capital, following well-publicized indoor-farming closures in prior years. For forestry-specific technology, the closest satellite-monitoring analog to precision agriculture is the same multispectral and vegetation-index imagery used for crop health, applied instead to canopy cover, deforestation alerts, and biomass estimation — infrastructure Farmonaut’s satellite platform also supports for land-use monitoring.
Irrigation Cost Calculator
Use the national 2023 USDA NASS averages above as a benchmark against your own farm’s irrigated acreage and pumping setup.
Run your own numbers
Assumptions: the national average per-acre energy cost is derived by dividing USDA NASS’s reported $3.3 billion national irrigation pumping energy cost by 53.1 million irrigated acres (2023 survey). This calculator excludes equipment purchase and maintenance costs, well-drilling costs, and regional energy-price variation (electricity vs. diesel vs. natural gas pumping). It is a planning estimate, not a substitute for your own utility bills or a local extension office’s irrigation cost worksheet.
Supply Chain Intelligence and Traceability
Beyond the field, AI-driven analytics are used for crop yield estimation, demand forecasting, and traceability — tracking a product’s origin and certification status through the supply chain. This matters for food-safety compliance and for premium markets (organic, regenerative-certified) where buyers require documented origin.
Farmonaut’s traceability tools cover this specific use case: Product Traceability. For operations managing vehicle or equipment fleets alongside crop production, fleet-level tracking and usage optimization is a related but separate tool: Fleet Management.

Sustainability, Carbon, and Climate Resilience Tools
Carbon footprint tracking is the sustainability tool most frequently requested alongside precision irrigation and drone monitoring, since both irrigation pumping energy and diesel-powered field equipment are direct, measurable emissions sources. Farmonaut’s carbon footprinting tool applies to this specific need: Carbon Footprinting.
On soil carbon sequestration and farm-level carbon credit pricing specifically — a common forestry-and-agriculture crossover question — there is no verified US farm-level carbon credit pricing data in the sources behind this article, and pricing varies significantly by registry (Verra, Climate Action Reserve) and protocol. If you need current pricing, check the registry’s own public project database for recently issued credits in your region rather than relying on a headline average, since verified credit prices differ by methodology and buyer.


Technology Comparison Table
A side-by-side view of the technology categories covered above, with the sourced figure behind each and where it comes from.
| Technology Category | Sourced Figure | Period | Source |
|---|---|---|---|
| Precision agriculture adoption (US farms) | 27% of farms using precision practices | 2023 | USDA ERS |
| US precision agriculture market size | $7.5 billion | 2024 | GM Insights |
| US agricultural drones market size | $1.78 billion, 11.36% CAGR through 2035 | 2024–2035 | Market Research Future |
| US farms with irrigation systems | 212,714 farms, 53.1 million acres | 2023 | USDA NASS |
| US irrigation water applied | 81 million acre-feet | 2023 | USDA NASS |
| US irrigation pumping energy cost | $3.3 billion annually | 2023 | USDA NASS |
| Global vertical farming market | $7.4 billion revenue | 2025 | IMARC Group |
| Indoor farming venture capital | $475 million across 74 deals | 2024 | AgFunder/Pitchbook via IMARC Group |
| AI-driven yield increase potential | 15–20% from AI farm analytics | 2025 | IMARC Group |
Where Farmonaut Fits: Satellite and AI Tools
Farmonaut’s platform applies the same satellite and AI infrastructure described above to individual farms and fleets:
- Satellite-based monitoring: multispectral imaging for crop health, soil conditions, and vegetation stress at field and regional scale.
- Jeevn AI advisory system: irrigation, fertilizer, and pest-control guidance delivered through Android, iOS, and web apps.
- Traceability: origin and certification tracking through Product Traceability.
- Carbon tracking: emissions monitoring through Carbon Footprinting.
- Fleet management: equipment tracking through Fleet Management.
- Crop loan and insurance verification: satellite-based assessment through Crop Loan & Insurance.
- Large-scale farm administration: multi-plot management through Agro Admin App.
Access is available through the web app and native mobile apps:


How to Verify These Numbers Yourself
Every figure in this article carries a source and a period rather than a permanent claim, because each one is refiled on its own schedule. Use this checklist to confirm you’re looking at the current release before citing any of them elsewhere:
- Precision agriculture adoption: USDA ERS updates its charts of note periodically. Search “precision agriculture” at USDA ERS Charts of Note for the latest adoption breakdown by farm size.
- Irrigation acreage, water use, and costs: USDA NASS runs the Farm and Ranch Irrigation Survey as part of the Census of Agriculture cycle. Check USDA NASS’s Farm and Ranch Irrigation Survey guide for the newest release.
- Drone market size and growth rate: Market Research Future updates sector reports on a rolling basis. Check Market Research Future’s US agricultural drones report for the current baseline year and CAGR.
- Market size for precision agriculture, vertical farming, and AI in agriculture: these come from industry market-research reports (GM Insights, IMARC Group), which are republished on their own schedules — confirm the report’s stated baseline year before quoting a figure as current.
Bookmark this method rather than the numbers themselves: agriculture technology figures move on annual survey cycles (USDA) or rolling market-report updates (private research firms), not daily news cycles, so re-checking twice a year is usually sufficient to stay current. For broader US-specific innovation coverage, see agriculture in the United States: innovations and trends, and for climate-resilient farming practices, see smart climate agriculture: resilient practices.






Frequently Asked Questions
1. What percentage of US farms actually use precision agriculture?
27% of US farms use precision agriculture practices for crops or livestock, according to USDA ERS data for 2023. Adoption varies by farm size, with ERS charts of note breaking this down further — check the source directly for the current breakdown by farm size.
2. How big is the US agricultural drone market?
$1.78 billion as of 2024, per Market Research Future, with an 11.36% projected compound annual growth rate from 2025 through 2035. That is a market-size figure, not a per-farm adoption rate.
3. How many US farms use irrigation, and what does it cost?
212,714 US farms operated irrigation systems across 53.1 million acres as of USDA NASS’s 2023 survey, applying 81 million acre-feet of water. Farms spent $3 billion annually on irrigation equipment and $3.3 billion on pumping energy in that survey year.
4. Is forestry technology covered by the same data as agriculture technology?
No — forestry relies on satellite-based canopy and biomass monitoring rather than the farm-survey data (USDA NASS, ERS) that covers row-crop agriculture. The vegetation-index and multispectral imaging methods overlap, but the underlying datasets and agencies differ.
5. How does Farmonaut fit into these technology trends?
Farmonaut applies satellite imagery and AI advisory models — the same category of technology behind the 27% precision-agriculture adoption figure — to individual farms through its web app, mobile apps, and API, covering crop monitoring, irrigation guidance, traceability, carbon tracking, and fleet management.
6. Where can I access these tools?
Through Farmonaut’s web platform, the Android app, the iOS app, or directly via API.

 SFX
SFX BACF Africa
 Nivia
Nivia Doodlakine
 Exurbia Geospatial
 FieldZero
 Indico Company
 Kubota
 FFBS
FFBS Jontra
 Tucor
Tucor Hayleys Agriculture
