

Reviewed against USDA Economic Research Service organic production and precision agriculture data, USDA NASS Census of Agriculture cover crop figures, and Purdue University Center for Commercial Agriculture net-return series.
Try it: Run your own numbers →
Table of Contents
- What Is an Agriculture Model?
- Agriculture Model Components
- Types of Agriculture and Farming Models
- Comparison Table: Agriculture Models by Adoption & Return
- Calculator: Organic Conversion Net Return
- Where Farmonaut Fits Into These Models
- Benefits of Adopting an Agriculture Model
- Barriers to Adoption and How to Check Current Data
- Farmonaut Platform Access & Related Tools
- FAQ
- Conclusion
What Is an Agriculture Model? A Data-Backed Comparison
An agriculture model is a defined system of practices, technology, and inputs that a farm follows to produce crops — ranging from certified organic production and cover-cropped conventional systems to precision, sensor-driven operations. The term covers both the abstract (“what model of agriculture should I run?”) and the concrete: a specific farm using specific inputs, tracked by USDA against specific numbers. This is not a hypothetical. USDA’s Economic Research Service tracked 17,445 certified organic farms operating 4.89 million acres in the United States as of 2021, and 27% of US farms reported using at least one precision agriculture practice in 2023.
This guide compares the agriculture models US producers are actually running — organic, cover-cropped, precision, and climate-resilient — against the USDA and university data that measures their adoption, yield, and return. Where a national figure exists, we cite it with its date and source. Where it does not (regenerative agriculture’s price premium, for instance), we say so and give you the path to check it yourself.
Agriculture Model Components: What Actually Gets Measured
A model of agriculture is judged on four measurable components, each tracked by a US federal or land-grant source:
- Certification and practice standard — e.g., USDA National Organic Program certification, which the Economic Research Service tracks by acreage and farm count.
- Yield outcome — measured against a conventional baseline. Purdue University’s Center for Commercial Agriculture found organic corn yielded 26% less than conventional corn over the 2019-2023 period.
- Net financial return — the number that matters more than yield alone. The same Purdue dataset showed organic corn returning an additional $359 per acre and organic soybeans an additional $296 per acre versus conventional, over 2019-2023, despite the yield gap.
- Technology adoption rate — how many farms are actually running the model. USDA ERS found 70% of large-scale crop farms used guidance auto-steering systems in 2023, versus 27% of all US farms using any precision agriculture practice.
These four numbers — acreage, yield delta, net return delta, and adoption rate — are what separates a real agriculture model comparison from a marketing claim. Every model below is scored against them.
Types of Agriculture and Farming Models
Crop Growth & Yield Models
Crop growth and yield models simulate plant development against real-time inputs — satellite NDVI, soil moisture, and weather — to forecast output before harvest. These are the modeling layer underneath precision agriculture, the practice category USDA ERS measured at 27% national adoption in 2023. Within that population, adoption is uneven: guidance auto-steering alone reached 70% of large-scale crop farms in the same 2023 dataset, meaning the aggregate 27% figure is pulled down heavily by small and mid-size operations that have not adopted any sensor-based practice yet.
For a farm deciding whether to adopt a yield model, the practical question is not “does precision agriculture work” — the 70% figure among large operations answers that — but “does my farm’s scale justify the sensor and subscription cost.” USDA ERS republishes this adoption breakdown in its Charts of Note series annually, and the next Census of Agriculture, which underlies these figures, is scheduled for 2027; check the USDA ERS precision agriculture chart for the current adoption rate before budgeting for sensors.

Climate-Resilient Farming Models
Climate-resilient models layer weather and soil-conservation practices onto the base cropping system to reduce drought, flood, and heat exposure. Cover cropping is the most directly measured practice in this category: USDA’s 2022 Census of Agriculture recorded 17.99 million acres of US cropland planted to cover crops, equal to 4.7% of total US cropland. That is a five-fold increase in raw acreage terms over the prior decade’s baseline, but it also means more than 95% of US cropland still runs without a cover crop in rotation.
Soil conservation is the physical mechanism that makes a climate-resilient model work, and it applies well beyond row-crop farming — see Farmonaut’s guide to soil conservation methods for the seven techniques used across both agricultural and disturbed-land contexts. Regenerative agriculture, the broader USDA conservation-practice category that includes cover cropping alongside reduced tillage and diversified rotations, covered 40 million acres of US farmland under USDA-supported practices in fiscal year 2023, per the agency’s Soil and Water Resources Conservation Act reporting. FY2024 figures were expected in the second quarter of the following reporting cycle — check the American Farm Bureau Federation summary of USDA conservation data for the current acreage total.

Integrated Pest Management Models
Integrated pest management (IPM) models predict pest pressure from crop stage, weather, and historical outbreak data, so treatment is applied only where and when needed. There is no standalone USDA national adoption figure tracked for IPM as a distinct category the way organic certification or cover crops are counted — it is typically folded into the broader precision agriculture adoption figure (27% of US farms, USDA ERS 2023) when a farm’s IPM decisions are triggered by sensor or satellite data rather than a fixed calendar spray schedule.
That measurement gap is worth naming plainly: if you want a number for “how many farms use predictive pest models” specifically, it does not exist in a published federal dataset today. What you can measure directly on your own operation is chemical input cost per acre before and after adopting a predictive schedule, and cross-reference that against your region’s extension-service pest forecasting tools.

Economic & Market Agriculture Models
Economic and market models simulate crop portfolios against input cost, yield, and expected sale price to decide what to plant and when to sell. The clearest published US comparison here is Purdue University’s organic-versus-conventional net return series for 2019-2023: organic corn returned an additional $359 per acre and organic soybeans an additional $296 per acre compared with conventional production, even though organic corn yielded 26% less than conventional corn over the same period. Organic soybean gross revenue ran 2.18 times conventional soybean gross revenue in that dataset — the premium price more than compensating for the yield gap.
That is the economic model in miniature: yield loss is not the deciding variable, net return per acre is. A market model that only tracks bushels per acre would rank conventional corn ahead of organic corn; a model that tracks dollars per acre, including certified-organic price premiums, ranks it the other way.
Did you know?
Farmonaut’s crop loan and insurance solutions offer satellite-based verification, making financial access more secure, transparent, and accessible for farmers applying for loans and insurance. This advanced approach reduces fraud and optimizes lending for the agricultural sector.
Model Farms as Benchmarks
“Model agriculture” and “model farming” also describe a specific type of demonstration operation — a farm that combines several practices (organic or reduced-input production, cover cropping, precision monitoring) into one integrated system used as a teaching or policy benchmark. Land-grant extension programs and USDA pilot projects use these farms to show what stacking practices looks like in practice rather than in isolation: a farm running both cover crops on its full rotation and precision-guided input application simultaneously, rather than one practice at a time.
There is no single federal registry of “model farms” as a category — unlike organic certification or cover crop acreage, this is a qualitative designation used by extension services and demonstration programs rather than a counted USDA statistic. If you are looking for one to visit or benchmark against, your state land-grant university’s extension office is the correct starting point, not a national database.

Comparison Table: Agriculture Models by Adoption & Return
| Model | US Scale (Acreage/Farms) | Vintage | Yield vs. Conventional | Net Return vs. Conventional | Source |
|---|---|---|---|---|---|
| Certified Organic | 4.89M acres total / 3.6M acres cropland / 17,445 farms | 2021 | Corn: -26% | Corn: +$359/acre; Soybeans: +$296/acre | USDA ERS; Purdue Center for Commercial Agriculture |
| Cover-Cropped Cropland | 17.99M acres (4.7% of US cropland) | 2022 | Not separately published | Not separately published — varies by crop pairing and region | USDA NASS Census of Agriculture |
| USDA-Supported Regenerative Practices | 40M acres | FY2023 | Not separately published | No federal premium/return dataset exists | USDA Soil and Water Resources Conservation Act reports |
| Precision Agriculture (any practice) | 27% of all US farms | 2023 | Not separately published | Reduces input cost per acre; no national $/acre figure published | USDA ERS |
| Guidance Auto-Steering (large farms) | 70% of large-scale crop farms | 2023 | Not separately published | Not separately published | USDA ERS |
Read this table for what it does and does not say: organic is the only model with a published national net-return comparison. Cover cropping, regenerative practices, and precision agriculture all have solid adoption figures but no equivalent USDA per-acre return dataset — that is a genuine gap in public data, not an oversight in this article. If your operation needs a per-acre return figure for cover crops or precision equipment, you will need to build it from your own cost and yield records, or from your state extension service’s regional trial data.

Calculator: Organic Conversion Net Return
Use Purdue’s published 2019-2023 per-acre figures against your own acreage and crop split to estimate the net return difference of converting to organic corn and soybean production.
Run your own numbers
Assumptions: uses Purdue University Center for Commercial Agriculture’s 2019-2023 average net return advantage of $359/acre for organic corn and $296/acre for organic soybeans versus conventional. Excludes conversion-period transition costs, certification fees, and any premium volatility outside the 2019-2023 window — confirm current figures at Purdue’s enterprise net returns report before acting on this estimate.
Where Farmonaut Fits Into These Models
None of the models above run on paper anymore — they run on data feeds. Satellite-driven insights and AI-based analytics are the layer that makes crop growth models, climate-resilient practices, and IPM predictions possible at farm scale without a full agronomy team on staff. Farmonaut provides that layer through:
- Satellite-Based Monitoring: Multispectral imagery for NDVI, soil condition, and water-use tracking — the same category of input that underlies the precision agriculture practices USDA ERS measured at 27% national adoption in 2023.
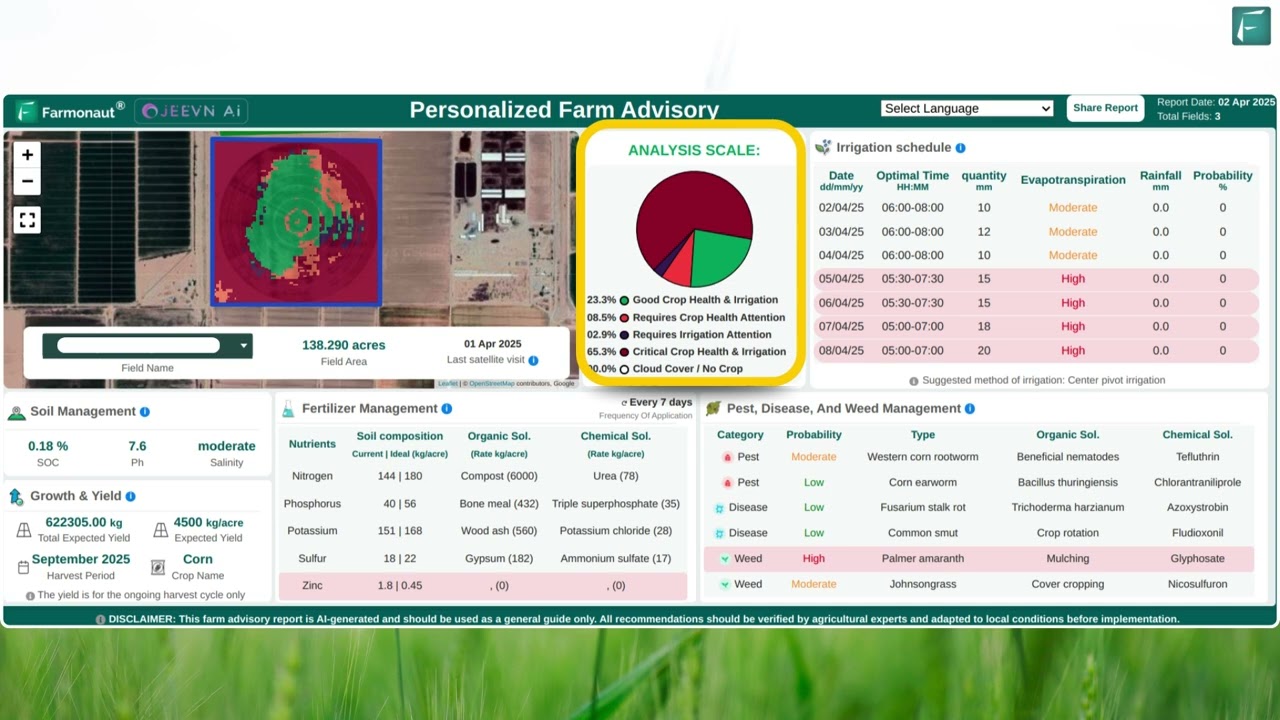
- Jeevn AI advisory system: Tailored insights and weather forecasts that support the crop-stage and weather inputs an IPM model needs for predictive, rather than calendar-based, pest treatment.
- Blockchain Traceability: Supply-chain transparency and authenticity, relevant to any model farm pursuing verified or premium-market positioning — the same mechanism that supports organic certification’s price premium.
- Environmental Impact Monitoring: Data on carbon footprinting for farms tracking regenerative or conservation-practice outcomes.

Farmonaut operates across web, Android, and iOS platforms, with API integration for developers building their own models on top of the same imagery and weather feeds (Farmonaut API | API Developer Docs).
Access the Farmonaut App to monitor your fields now:




For large-scale and administrative users: the Farmonaut Large Scale Farm Management platform provides tailored dashboards, monitoring, historical analytics, and scalable management for multi-field operations.
Benefits of Adopting an Agriculture Model
- Measurable financial return: Purdue’s data shows organic corn and soybean models returning $359/acre and $296/acre more than conventional over 2019-2023 — a benchmark you can compare your own crop budget against.
- Conservation at scale: 40 million acres under USDA-supported regenerative practices in FY2023 shows this is mainstream infrastructure, not a fringe practice.
- Input efficiency: 70% of large-scale US crop farms already run guidance auto-steering (USDA ERS, 2023), meaning the technology is proven at scale for input-cost reduction.
- Risk mitigation: Climate-resilient and IPM models reduce exposure to weather and pest shocks, even where a national dollar-value figure isn’t yet published.
- Transparency and traceability: Blockchain-based product traceability supports the premium pricing that makes models like certified organic financially viable.
- Access to financing: Satellite-verified loan and insurance tools reduce fraud risk for lenders and expand credit access for farmers adopting new models.
- Environmental compliance: Carbon footprinting tools help document conservation-practice outcomes for emerging sustainability standards.

Barriers to Adoption and How to Check Current Data
Even with strong adoption numbers in specific categories, most agriculture models face the same four barriers:
- Yield trade-offs: Organic corn’s 26% yield reduction (Purdue, 2019-2023) is real and must be underwritten by the price premium, not ignored.
- Data gaps: No federal dataset currently publishes a per-acre return figure for cover cropping or regenerative practices the way it does for certified organic — build your own trial plot comparison if this number matters for your decision.
- Scale threshold: Precision agriculture adoption is heavily skewed toward large operations (70% of large-scale farms vs. 27% of all farms, USDA ERS 2023), meaning smaller operations face a real cost-benefit question sensor vendors don’t always volunteer.
- Capital cost: IoT sensors, drones, and guidance systems require upfront investment before the input-efficiency gains materialize.
How to get a fresher number than this article’s: USDA ERS updates precision agriculture adoption in its Charts of Note series and refreshes organic production data on its own schedule at the USDA ERS Organic Production data product page. Cover crop acreage is a Census of Agriculture figure, recalculated every five years, with the next census due in 2027. Regenerative acreage under USDA conservation programs is reported annually in the agency’s Soil and Water Resources Conservation Act reports.
Farmonaut Platform Access & Related Tools
-
Field Monitoring at Scale:
Discover our large scale farm management platform for end-to-end, multi-field monitoring and data aggregation. -
Fleet Management:
Optimize logistics and resource allocation with our fleet management solution, designed for agricultural, mining, and infrastructure vehicle tracking. -
Crop Plantation & Forest Advisory:
Receive AI-generated recommendations with our dedicated agriculture and forestry crop plantation advisory. -
Traceability, Sustainability, and Compliance:
Build trust in your agri-supply chain with product traceability and track your carbon footprint to ensure sustainable practices.
Start leveraging advanced agriculture models on your farm today:
For custom integration and API access visit: Farmonaut API | API Developer Docs
FAQ: Agriculture Models







Conclusion
The agriculture models with the strongest published US data — certified organic (4.89 million acres, 17,445 farms, 2021) and precision agriculture (27% adoption, 70% among large farms, 2023) — are also the ones with the clearest financial case: organic’s $359/acre corn premium and $296/acre soybean premium against a documented 26% yield cost, and precision’s proven scale advantage among large operations. Cover cropping (17.99 million acres, 4.7% of cropland, 2022) and regenerative practices (40 million acres, FY2023) show strong and growing adoption but lack an equivalent published return figure — that gap is real, and the fix is your own trial-plot record-keeping until USDA closes it.
Pick the model that matches your operation’s scale and risk tolerance, verify the current figures against the USDA and Purdue sources linked throughout this guide before budgeting, and layer in satellite monitoring to close the data gap national statistics can’t fill for your specific fields.

 Farms Easy
 Rouge VC
 Yutz Automation
 AgroGreen Dynamics
 AgroRisk
 Oath Inc
 Reddane Farming
 Esri North East Africa
 Cresol
 Atur Kuliner
 MDCV UK
 Zerella Group
 Etech Consulting Madagascar
 Vestlandsforsking
 Delicio
 WB Dev
 Sama Premium
 Prochecker
 Tres Valles
 LACOS Geoinformation
 Magrifly
 LatConnect 60
 Blickwinkel
