

Farm Planning Software: Reviews, Data & Free Options
Reviewed September 2026 against USDA Economic Research Service and iMarc Group market data.
Try it: Run your own numbers →
Farm planning software is a digital system for scheduling field operations, allocating inputs, and tracking costs across a season — and the honest answer on ROI is that USDA has never published a yield-lift figure tied to software adoption itself. What USDA has measured is the underlying precision-agriculture technology this software runs on: 27% of US farms used precision ag technologies in 2023, and on farms over roughly 2,000 acres, adoption of yield monitors and auto-steer guidance is more than double the rate on small farms. This agriculture planning software guide sets out what the data actually says, where free tools fit, how Farmonaut compares as an AgCommander alternative, and a calculator to size your own numbers.





What Is Farm Planning Software?
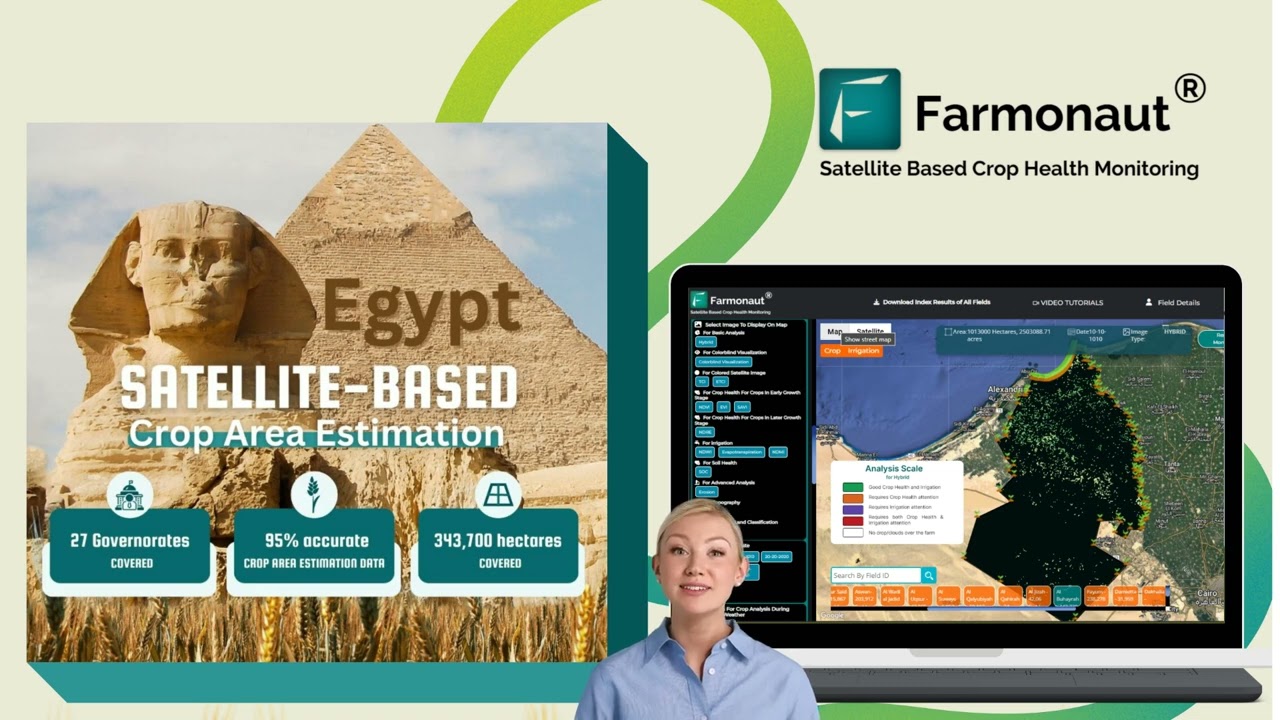
Farm planning software is the operational layer that sits between raw field data — satellite imagery, soil tests, yield monitors — and the decisions a grower makes about planting dates, input rates, irrigation timing, and crew scheduling. A basic farm plan software tool logs fields and tasks in a spreadsheet-like interface. A full agriculture planning software platform adds real-time crop planning and management tools, satellite-based crop health monitoring, automated task scheduling, and financial tracking in one place.
The category splits into three practical tiers: (1) free or freemium record-keeping tools aimed at small acreage, (2) mid-market farm management software for yield optimization with satellite or sensor inputs, and (3) enterprise platforms bundling fleet, labor, and compliance management for operations running thousands of acres. Which tier fits depends less on farm size than on how much of your input-cost variability is driven by timing and zone-level decisions versus flat per-acre costs.
US Adoption Data: Who’s Actually Using This
The clearest signal on how much precision technology — the foundation most farm planning software is built on — has actually spread across US agriculture comes from USDA’s Agricultural Resource Management Survey (ARMS) and Economic Research Service (ERS) publications:
- 27% of US farms reported using at least one precision agriculture technology in the 2023 ARMS survey, per USDA ERS.
- 68% of large-scale US crop farms (the ERS’s top acreage bracket) used yield monitors and soil maps in 2023, versus a small fraction of farms under a few hundred acres.
- 70% of large-scale crop farms used auto-steer guidance systems in 2023.
- By crop, auto-steer adoption in 2016 reached 58% of corn acreage, 72.9% of sorghum acreage, and 64.5% of cotton acreage.
- Variable-rate technology (VRT) — the input-rate-by-zone feature most planning software is built to control — was used on 37.4% of corn acreage in 2016 and 25.3% of soybean acreage in 2018.
- The farm-size gap is stark on yield mapping specifically: corn farms above 1,725 acres used yield maps at a 50% rate in the 2010–2012 ARMS window, compared with 7% for corn farms under 200 acres.
Source: USDA Economic Research Service, Charts of Note; USDA ERS precision agriculture adoption report. These are the most recent nationally representative adoption figures ERS has published for the technologies underlying farm planning platforms — ARMS surveys specific commodities on a rotating multi-year schedule, so check the ERS Charts of Note page directly for any update past the 2023 survey wave before citing a newer number.
Market Size and What It Means for Buyers
The US farm management software market was valued at $766.3 million in 2025 and is projected by iMarc Group to reach $1,860.1 million by 2034. Separately, iMarc sizes the narrower US precision farming software segment — tools built specifically around GPS, imagery, and variable-rate control — at $470.31 million in 2025. Cloud-based deployment already accounts for 72% of the market, which matters for buyers because it means most competitive platforms now update field maps and task lists on mobile without a local server.
Source: iMarc Group, United States Farm Management Software Market. iMarc and comparable market-research firms typically revise these forecasts on an annual February–March publication cycle; if you’re citing this market size more than a year out, pull the current edition from their site rather than reusing the 2025 baseline above.
Feature & ROI Comparison Table
Here’s what the published ROI evidence actually supports, mapped against the features that drive it. Note that none of these percentages come from a controlled yield study — USDA does not isolate yield gains by software adoption status, so treat the “impact” column as cost and time evidence, not a yield promise.
| Feature | What It Does | Documented Impact | Source |
|---|---|---|---|
| Automated task/labor scheduling | Assigns and tracks planting, spraying, irrigation, and harvest tasks | 15–20% reduction in labor costs | Market research synthesis, pickapp.farm ROI report |
| Farm CRM / admin dashboard | Centralizes contacts, records, and reporting for a farm office | ~5 hours/week saved in admin time per manager | Planfix industry case studies |
| Input-rate optimization | Matches fertilizer/seed rates to field zones | $58,000 annual input savings, 540-hectare orchard case | Farmbrite case study |
| Cloud/mobile access | Field data synced across devices without local servers | 72% of US farm management software market share | iMarc Group, 2025 |
| Satellite crop monitoring | NDVI, soil moisture, and stress detection without a field visit | Adoption not separately tracked by USDA; see Gaps note below | — |
On that last row: no public USDA or industry dataset isolates yield or cost impact specifically for satellite-based crop monitoring apart from the broader precision-ag adoption figures above. If a vendor quotes you a yield percentage tied to their monitoring feature alone, ask for their source — it’s very likely a case study, not an independent study.
Free Farm Planning Software vs. Paid Platforms
Searches for free farm planning software are common, and the honest picture is this: no public dataset separates freemium uptake from paid licenses in this market — that split isn’t tracked by USDA or the market-research firms cited above. What can be said concretely:
- Free tiers exist across most major platforms and Farmonaut’s own web app, typically capped by acreage, number of fields, or feature depth (no satellite advisory, no API access).
- Paid tiers earn their cost mainly through the labor-cost and admin-time reductions in the table above — 15–20% labor savings and roughly 5 hours/week of admin time back per manager, per the sources cited.
- The market is moving toward cloud/mobile-first free entry points: with 72% of the market already cloud-based (iMarc, 2025), most vendors now use a free mobile tier as the funnel into paid feature unlocks rather than offering a permanently free desktop product.
If free-tier feature limits matter to your decision, the only reliable way to compare them is to open each vendor’s current pricing page directly, since caps change without a public revision log.
AgCommander Alternative: Where Farmonaut Fits
People searching for an AgCommander alternative are typically comparing fleet/equipment-dispatch-oriented farm software against platforms with a stronger remote-sensing or financial layer. There’s no public data on AgCommander’s market share or customer base — that’s proprietary company information not published in USDA, iMarc, or any source in our research base, so we won’t invent a comparison number here.
What can be compared directly is feature scope. Where dispatch-focused platforms center on equipment routing and job assignment, Farmonaut centers on satellite-based field intelligence feeding into planning: NDVI crop health, resource allocation, and fleet management for logistics, plus carbon footprinting and blockchain traceability that dispatch-only tools generally don’t offer. If your primary pain point is equipment scheduling, weigh that against your need for remote crop monitoring — the two categories overlap but aren’t identical.
Agriculture Software Reviews: Platforms Compared
For readers searching agriculture software reviews, here’s an honest rundown of what each platform is actually built for — not a ranked “best” list, since public review sources don’t provide comparable methodology across all of them:
- Farmbrite: All-in-one farm management software for task control, financial tracking, and direct sales integration. Visit Farmbrite.
- Granular: Focused on optimizing financial performance and input allocation across large operations. Learn about Granular.
- Micro-Farm Planner: Tailored for vegetable growers, with mobile-first production and crop planning software task planning. Explore Micro-Farm Planner.
- FarmERP: Integrates satellite imagery and drones for crop health tracking. Find out more.
- Agrivi / Cropin: Objective-driven agricultural software solutions offering field-to-financial data integration. See Agrivi or Cropin’s farm planning module.
- Farmonaut: Satellite-based monitoring, AI-powered advisory, blockchain traceability, and scalable management for every farm type from open-field to vertical operations.
When you read any third-party “best of” list, check its publication date and methodology — most, including the ones linked above, are periodically refreshed by their publishers, so treat rankings as directional rather than authoritative for your specific operation.
Dispatch, Rostering & Fleet Planning Tools
Two related but distinct searches — agriculture dispatch planning tools and rostering agriculture software — point to a specific need: coordinating labor and equipment across multiple fields or sites, often on a daily or weekly cycle. This is a different problem from crop-zone input planning, and it’s worth separating clearly:
- Dispatch planning assigns machinery and crews to fields based on task priority, weather windows, and travel distance. Farmonaut’s Large Scale Farm Management App and Fleet Management module cover this for multi-site operations.
- Rostering is the labor-shift layer underneath dispatch — who works which days and which fields. Farm management platforms typically fold this into the same admin dashboard used for task scheduling, rather than offering it as a standalone module; the labor-cost reduction range cited earlier (15–20%) is the best available proxy for what this category delivers, since no source in our research base separately quantifies rostering versus dispatch savings.
If your main gap is roster/shift coordination rather than field-level agronomy, prioritize the admin and task-management review criteria in the checklist below over satellite feature depth.
ROI Calculator: Estimate Your Labor & Input Savings
Plug in your own farm’s numbers below to see a range grounded in the labor-cost and admin-time figures cited above — this is an estimate range, not a guarantee, since actual results depend on your current workflow’s inefficiency.
Run your own numbers
Assumptions: labor savings of 15–20% (pickapp.farm ROI synthesis) applied to your current annual labor cost; admin time savings capped at 5 hours/week (Planfix case study benchmark) valued at your stated hourly rate. Excludes input-cost savings (see the $58,000/540-hectare Farmbrite case above), equipment costs, and software subscription price, which varies by vendor and tier.
Farmonaut's Precision Technology Stack
Farmonaut's platform layers several tools that map directly onto the adoption categories USDA tracks — satellite-based monitoring in place of ground scouting, and automated resource planning in place of manual scheduling:
- Satellite-Based Crop Health Monitoring: Multispectral imaging for NDVI and soil moisture tracking, the same category of technology USDA measures at 68% adoption among large-scale crop farms for yield-mapping tools.
- Jeevn AI Advisory: Combines weather forecasts and remote sensing into crop management strategies, addressing the same predictive-planning gap that drives VRT adoption (37.4% of corn acreage in 2016, per USDA ERS).
- Blockchain Traceability: Supply-chain transparency via Farmonaut's Traceability Solution.
- Fleet & Resource Management: Equipment routing and logistics via Fleet Management.
- Carbon Footprinting: GHG tracking tied to farm operations via Carbon Footprinting.
- Crop Loan & Insurance Verification: Satellite-based acreage and crop-health proof for lenders via Crop Loan and Insurance.
For background on the broader technology category these tools sit inside, see Farmonaut's overview of smart farming technology and the deeper dive on farm data analytics.



API, Apps & Integrations
For farm planning tools that need to plug into an existing system rather than run standalone:
-
Farmonaut Web, Android & iOS Apps: Real-time monitoring, analytics, and advisory.
Open the web app
(Android version)
(iOS version) - API for Developers: Satellite imagery, weather, and crop-health data via Farmonaut API (Developer Docs).
- Fleet Management Integration: For multi-site operations, via Fleet Management.
Farmonaut Subscription Plans
Farmonaut offers tiered pricing so you can match plan features — including a free entry tier — to your operation's size:
Buyer's Checklist: How to Evaluate Any Platform
This is the durable part of this guide — the market size and adoption numbers above will be revised annually, but this evaluation method doesn't expire. Before choosing between an agriculture planner, a full farm planning solution, or a free tool, check each candidate against these five criteria:
- Does it separate free-tier limits clearly? Look for explicit acreage, field-count, or feature caps on the vendor's current pricing page — not a sales rep's verbal summary.
- Can it show a labor or admin-time benchmark? Ask the vendor for their own case-study numbers; compare against the 15–20% labor-cost and ~5 hours/week admin benchmarks cited above as a sanity check, not a guarantee.
- Does it match your farm's acreage bracket? USDA's own adoption data shows large farms (2,000+ acres) adopt yield mapping and auto-steer at roughly 7–10x the rate of farms under 200 acres — so ask specifically how the tool performs at your scale, not the vendor's largest reference customer's scale.
- Is data exportable? Confirm you can pull your own field boundaries, yield history, and cost records out in a standard format (CSV/KML/shapefile) before you commit.
- Does the vendor publish a security and hosting policy? With 72% of the market cloud-based (iMarc, 2025), confirm where your data is stored and who can access it.
For crop plantation or forest advisory needs specifically, including satellite-based insights: Farmonaut Advisory.
Frequently Asked Questions
- 1. What is farm planning software?
- A digital platform for scheduling field tasks, allocating resources, tracking finances, and monitoring crop health — ranging from free spreadsheet-style tools to full satellite-integrated platforms.
- 2. Is there truly free farm planning software?
- Yes — most major platforms, including Farmonaut, offer a free tier, usually capped by acreage or feature depth. No public dataset tracks how many US farms use free versus paid tiers specifically, so compare current pricing pages directly rather than relying on a market-share figure.
- 3. How much does farm planning software actually save?
- Published evidence points to 15–20% reductions in labor costs and about 5 hours/week of admin time recovered per manager (pickapp.farm and Planfix, respectively), plus case-specific input savings such as the $58,000/year figure from a 540-hectare orchard using Farmbrite. No public study isolates a yield-percentage gain from software use alone.
- 4. What's a good AgCommander alternative?
- It depends whether your priority is equipment dispatch or crop-level planning. Farmonaut is a strong fit if you want satellite-based field monitoring, AI advisory, and traceability bundled with fleet management; a dispatch-first tool may fit better if equipment routing is your only pain point.
- 5. Does farm planning software help with loan and insurance access?
- Yes — satellite-based verification (like Farmonaut's) can document acreage and crop health for lenders and insurers, which can speed approvals, though approval timelines are set by individual lenders, not the software vendor.
- 6. What devices are supported?
- Farmonaut's apps run on web, Android, and iOS.




Further reading:
Conclusion
The data supports a specific, non-hyped case for farm planning software: a US market growing from $766.3 million toward a projected $1,860.1 million by 2034 (iMarc Group), built on top of precision technologies that 27% of US farms have adopted as of the 2023 ARMS survey — concentrated heavily among larger operations. The documented savings are labor and admin-time reductions of 15–20% and roughly 5 hours per week, not the vague yield-doubling claims that circulate in marketing copy. Use the checklist above on any platform you evaluate, whether that's a free tool, a dispatch-focused AgCommander alternative, or a full satellite-integrated system like Farmonaut.
Start with Farmonaut's web and mobile app or the API for developer integrations.

 Aerospect
 Delicio
 Payagri
 WB Dev
 Sama Premium
 Prochecker
 Tres Valles
 LACOS Geoinformation
 Pulsar Supernova
 Magrifly
 LatConnect 60
 WebsEdge
 Blickwinkel
 Agricultural Credit Policy Council
 Marei Nursery
 eKGIS
eKGIS Mostas Tech
 Andex
Andex FCF India
 Unifrutti Gulf
 Deluxe Conseil
