

Crop insurance · Claims and imagery guide
Satellite Imagery in Crop Insurance: Claims and Rules
Satellite maps can show a flood within hours or days and a drought over a few weeks. In US crop insurance, imagery sets some index payments, feeds crop maps and fraud checks, and supports, but does not replace, the loss adjuster.
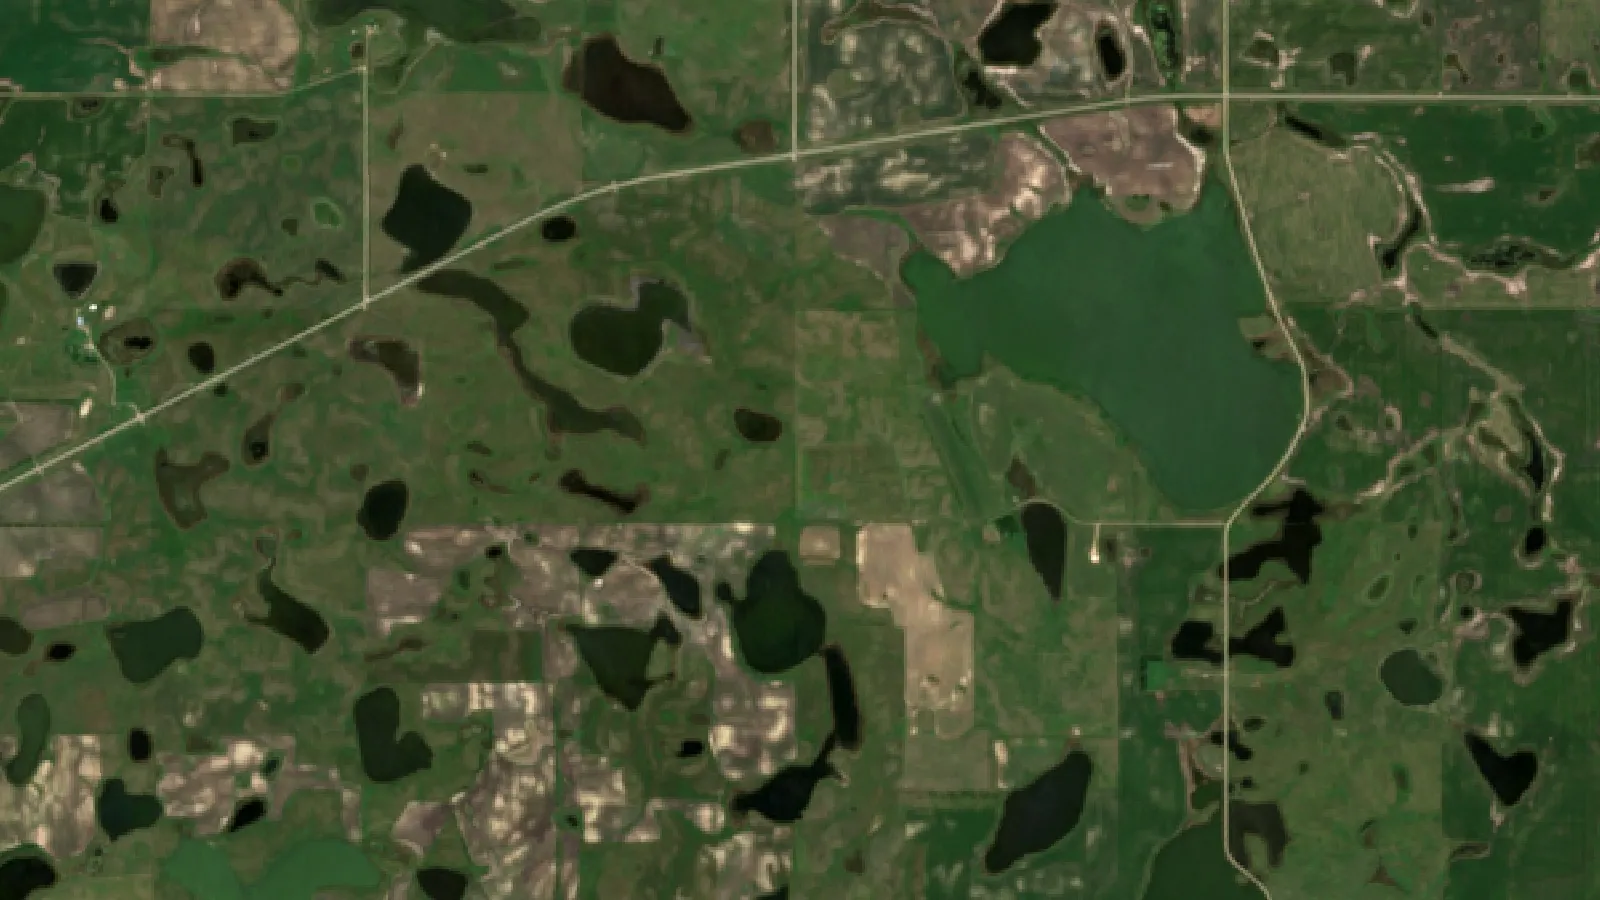
Key takeaways
- US federal crop insurance paid about $19.0 billion in indemnities for the 2023 crop year and $20.0 billion for 2022 (RMA Summary of Business).
- The PRF Rainfall Index pays on NOAA gridded rainfall for 0.25-degree grids; no claim or field visit is needed (USDA RMA).
- RMA has used Landsat imagery and data mining in compliance investigations since at least 2005.
- Copernicus Rapid Mapping delivers flood and fire extent maps within hours or days; Sentinel-1 radar sees through cloud.
- For individual policies the adjuster still decides the claim, and required representative samples must stay in the field.
In this article
- How satellite imagery fits into crop insurance
- How big is US crop insurance?
- Index insurance: payments set by data, not field visits
- Area plans and satellite crop maps
- Satellites in fraud and compliance checks
- How imagery supports a claim with an adjuster
- How quickly can satellite data map a flood or drought?
- Image sources compared: satellite, plane and drone
- Seven ways imagery is changing crop insurance
- What it means for farmers and insurers
- Limits and risks of satellite loss checks
- Try it: how a rainfall index payment is calculated
- How to prepare your farm records
- Questions to ask your agent about imagery
Satellite data can give insurers a regional picture of crop damage within hours or days of a flood, and within weeks for a drought. The Copernicus Emergency Management Service says its Rapid Mapping maps are delivered within hours or days of a disaster. In the United States, the federal crop insurance program paid about $19.0 billion in indemnities for the 2023 crop year, according to the RMA Summary of Business report, so the speed and accuracy of loss checks matter to farmers and to taxpayers.
This guide explains how satellite and aerial imagery is used in crop insurance today: in index policies that pay without a field visit, in area plans, in fraud checks, and as supporting evidence when an adjuster looks at a claim. It covers the rules that still apply on the ground, the limits of imagery, and what a farmer can do to keep good records. It also includes a calculator that shows how a rainfall index payment is worked out.
How satellite imagery fits into crop insurance
Crop insurance pays a farmer when yield, revenue or a weather index falls below a guaranteed level. Someone has to measure that loss. For decades, the main tool has been a loss adjuster who walks the field, counts plants, weighs samples and reads harvest records. Imagery from satellites, planes and drones now helps at several steps, but in the United States it supports the adjuster rather than replacing the policy rules.
There are four main uses:
- Index policies: the payment is set by a weather or vegetation index for an area, not by what happened on one farm. No claim visit is needed.
- Area plans: payment is based on the yield or revenue of a whole county or zone, which official surveys and satellite crop maps help estimate.
- Program checks: the insurer or the agency compares claims with imagery to spot fields where the story does not match the crop seen from space.
- Claim support: images taken before and after a storm, flood or drought help show when damage happened and how large the affected area was.
The sections below take each use in turn and say what the official sources show.
How big is US crop insurance?
The Federal Crop Insurance Program is run by the USDA Risk Management Agency (RMA). Private companies, called approved insurance providers, sell and service the policies, while RMA sets premium rates, underwriting rules and loss adjustment standards, as the Congressional Research Service primer on federal crop insurance explains. The government also pays part of each farmer’s premium.
Chart
Net acres insured in the US program
Million acres, selected crop years, combined business
The RMA Summary of Business for 2014 to 2023 shows how the program has grown. Net insured acres rose from about 294 million in 2014 to about 539 million in 2023. Liability, the total amount of coverage, rose from about $110 billion to about $208 billion over the same years. Pasture and forage index plans, which cover large areas of grazing land, are one part of the insured total.
Indemnities, the money paid out for losses, swing with the weather. They were about $3.9 billion in 2016, a mild year, and about $20.0 billion in 2022. Each of those billions comes from a claim that someone had to check, and satellite data is one way to check many claims at once.
The loss ratio, indemnities divided by total premium, shows how much the program paid out compared with what was charged. A ratio of 1.0 means payouts equalled premium. It was 1.04 in both 2019 and 2022, and 0.68 in 2021.
Chart
US crop insurance indemnities by crop year
Billion US dollars, combined business, all plans, 2014 to 2023
Index insurance: payments set by data, not field visits
The clearest case of remote data deciding a payout is index insurance. Here the policy pays when a measured index for an area falls below a trigger, whatever happened on the individual farm.
Chart
Loss ratio of US crop insurance
Indemnities divided by total premium, crop years 2019 to 2023
Pasture, Rangeland, Forage Rainfall Index (US)
The USDA Pasture, Rangeland, Forage (PRF) Rainfall Index plan uses a grid system. RMA’s program summary says each grid covers an area equal to 0.25 degrees of latitude by 0.25 degrees of longitude. The rainfall for each grid comes from the NOAA Climate Prediction Center, which interpolates daily rain gauge data to the grid. RMA notes that this value cannot be traced to a single point, so it may not match the rain in your own gauge.
Ranchers choose at least two of eleven two-month index intervals, such as April and May or June and July, when rain matters most for their forage. They also choose a coverage level. A payment is earned when the final grid index falls below the expected grid index multiplied by the coverage level, called the trigger grid index. The RMA PRF frequently asked questions page says producers do not need to submit a loss claim or notify their agents; RMA calculates any loss and the insurance company processes it.
This plan uses rain data, not pictures of the grass. But it shows the model that satellite indices follow: a public data source, a fixed grid, a trigger and an automatic payout.
Satellite yield insurance for pasture (Canada)
In Alberta, the provincial crop insurer AFSC ran Satellite Yield Insurance for dryland pasture. Its 2022 insuring agreement says the program used satellite measurements of light absorbed and reflected by the pasture vegetation to estimate pasture growth. Growth and the extent of loss within a township were treated as the same for each insured producer, and the agreement defines a township-based Normalized Difference Vegetation Index (NDVI) for this purpose.
AFSC stopped offering Satellite Yield Insurance from 2023, citing technical problems getting satellite data, and moved those producers to its Moisture Deficiency Insurance. It is still a useful example of a vegetation index driving a payment.
Strengths and weak points of index cover
Index policies are fast and cheap to run, because no one has to visit each field. They are hard to cheat, because the farmer cannot change the index. The main weak point is basis risk: the grid or township can stay above the trigger while your own land suffers, or the reverse. RMA states plainly that if your ranch received surplus rain but the grid was below average, you could still receive a payment, and the other way round. Before buying index cover, compare your own yields or grazing days with the historical index for your grid.
Area plans and satellite crop maps
Area plans, such as county-level yield or revenue cover, pay on the result for a whole area. They rely on official statistics rather than individual harvest records. Satellite maps help those statistics in the background.
The clearest US example is the USDA National Agricultural Statistics Service (NASS) Cropland Data Layer. NASS describes it as an annual raster, crop-specific land cover layer produced using satellite imagery and extensive ground reference data. From 2024 the layer has a spatial resolution of 10 meters, up from 30 meters for 2008 to 2023, and it uses Landsat 8 and 9 and Sentinel-2 images collected through the growing season.
A map like this shows what was planted where, county by county. It does not give yield, and NASS notes that no farmer-reported data can be derived from it. For insurance, it helps with questions such as how many acres of a crop were in a flooded county, or whether a field reported as soybeans looked like soybeans from space.
Satellites in fraud and compliance checks
RMA has used satellite images to check claims for about two decades. A 2005 RMA compliance release reported that the agency used Landsat 5 and 7 data to support investigations of fraud, false claims and false statements. It also trained compliance investigators to acquire Landsat imagery from the USDA Image Archive and make preliminary decisions, either to approve a claim or forward it to a remote sensing expert.
The same release described a data warehouse built with a university partner to search crop insurance records for atypical patterns, and a yearly spot check list. Producers on the list were told their fields would get a growing season inspection by the Farm Service Agency. RMA reported that producers named on the 2004 spot check list claimed $222 million in 2003 but $151 million in 2004 after they were notified.
For an honest farmer, this matters in two ways. A claim that matches the imagery is easier to support. A claim that does not match, for example a field reported as planted that shows bare soil all summer, can lead to questions. Your own records of planting dates, field boundaries and damage are the best protection.
How imagery supports a claim with an adjuster
For individual yield and revenue policies, the loss adjuster still decides the claim using the policy and RMA’s loss adjustment standards. Imagery is supporting evidence. It can help in several ways:
- Timing: images before and after an event show when the crop changed, which helps link the loss to an insured cause of loss.
- Extent: a vegetation map shows which parts of a field were hit and which were not, so the adjuster can plan where to sample.
- Prevented planting: repeated images through the planting window can show standing water or bare, wet soil.
- Replant and late planting: images can show stand loss and when a new crop emerged.
Imagery does not remove the need for field evidence. The common crop insurance policy defines a representative sample as portions of the insured crop that must remain in the field for examination by the loss adjuster when making a crop appraisal. If your policy requires these strips, leave them in place until the adjuster has seen them or released them, whatever your imagery shows.
Check your own policy, the Crop Provisions for your crop and your notice deadlines with your agent. This article is general information, not legal or insurance advice.
▶ How NDVI maps from satellites show crop stress across a large farm before it is visible on foot. · 4:09
How quickly can satellite data map a flood or drought?
The speed depends on the satellite, the weather and the type of event.
Floods. Clouds often cover a flood when it happens, which blinds optical cameras. Radar can see through cloud. ESA says each Sentinel-1 satellite carries a radar instrument that gives an all-weather, day-and-night supply of imagery. When an authorised user activates the Copernicus Emergency Management Service, its Rapid Mapping team maps the extent of the event, such as the flooded area, with results provided within hours or days. These public maps give insurers and agencies a first regional picture.
Drought. Drought builds slowly, so the useful signal is a change in plant vigour over several weeks. Optical satellites such as Sentinel-2 track this through indices like NDVI. ESA lists a 5-day revisit time and 10 m resolution for the Sentinel-2 constellation. In practice, cloud cover lowers the number of clear views, so a reliable drought picture builds over two or more cloud-free passes, compared against the same weeks in earlier seasons.
Hail and wind. Hail damage can show up as a sudden drop in NDVI in strips or patches a few days after the storm, once the crop has had time to show stress. The adjuster still has to separate hail from other causes.

▶ Why clouds block ordinary satellite photos and how radar imagery sees through them. · 2:37
Image sources compared: satellite, plane and drone
Insurers and farmers can draw on several kinds of imagery. Each has a place.
| Source | Detail on the ground | How often | Best use in insurance |
|---|---|---|---|
| Sentinel-2 (ESA) | 10 m pixels | 5-day revisit (ESA) | Crop vigour over a season, drought, before and after views |
| Sentinel-1 radar (ESA) | Varies by mode | All-weather, day and night | Floods under cloud, standing water |
| Landsat 8 and 9 (NASA/USGS) | 30 m pixels for most bands | Regular repeat passes | Long archive for history and fraud checks |
| Commercial high-resolution satellites | Sub-meter to a few meters | On request | Close look at one field or building |
| Planes | Centimeters | Flown after an event | Large disaster areas |
| Drones | Centimeters | When flown | Single field claims, plant counts |
Public satellite data such as Sentinel and Landsat costs nothing to download, which is why it underpins index research and large-scale checks. Drones give much more detail but cover far less ground per hour, so they suit single claims.
Seven ways imagery is changing crop insurance
The original version of this page listed seven advances. Here they are with what the public sources support.
1. Index triggers from public data
Rainfall and vegetation indices set payments for pasture in the US and, until 2022, in Alberta. Payments are automatic once the index is known.
2. Crop type maps for area statistics
The Cropland Data Layer gives a yearly 10 m crop map of the lower 48 states, built from Landsat and Sentinel-2.
3. Compliance checks
RMA has used Landsat images and data mining to focus investigations on atypical claims since at least 2005.
4. Radar for floods
Sentinel-1 radar works through cloud and at night, which suits flood mapping.
5. Rapid disaster maps
Copernicus Rapid Mapping provides event extent maps within hours or days of an activation, freely viewable except for sensitive activations.
6. Field-level vegetation maps
Ten-metre Sentinel-2 maps show which parts of a field are under stress, which helps adjusters and farmers decide where to look.
7. Season-long records
A stored series of images for each field builds a history of planting, growth and damage that a farmer can share when needed.
What it means for farmers and insurers
For farmers: imagery can make claims faster and fairer when the record is clear. It also means the field’s history is visible. Keep accurate acreage reports, planting dates and notes on damage. Save dated photos from the ground as well as satellite views.
For insurers: imagery helps triage after a disaster, sending adjusters first to the worst-hit fields. It supports pricing by showing long-run patterns of crop vigour. It lowers the cost of checking claims in remote areas.
For both: imagery shows change in the crop, not the cause. A brown patch could be drought, disease, pests, poor drainage or a missed spray pass. Insured causes of loss are set by the policy, so field evidence and expert judgement remain part of every individual claim.
Limits and risks of satellite loss checks
- Cloud gaps: optical images miss days with cloud, sometimes for weeks in wet seasons.
- Mixed pixels: a 10 m or 30 m pixel on the edge of a small field mixes crop with roads, trees or the next field.
- Basis risk: index policies pay on the grid or township, not your farm.
- Cause of loss: imagery shows stress, but not whether it came from an insured cause.
- Evidence rules: images used in a dispute need clear dates, sources and processing steps.
Try it: how a rainfall index payment is calculated
Index insurance is easier to judge once you see the numbers. The calculator below follows the trigger logic described in RMA’s PRF program summary in a simplified form. Enter your own acres, protection per acre, premium, coverage level and the final grid index for an interval.
Try the numbers for your own farm below.
Calculator
What would a rainfall index pay for one interval?
Enter your own acres, protection, premium, coverage and final grid index.
- Trigger grid index: 90
- Payment share of protection: 5.6 %
- Index payment: $1,111
- Premium paid: $1,200
Example values only, not a quote or a forecast. Simplified from the trigger logic in USDA RMA’s RI-PRF program summary: the trigger grid index is the expected index (100) times your coverage level, and the payment share is the shortfall of the final index below the trigger, divided by the trigger. Real policies use county base values, productivity factors and interval weights, and the premium shown is your share after subsidy. Ask your crop insurance agent for an actual quote.
How to prepare your farm records
- Map each field boundary once and keep the same map for insurance, cost tracking and monitoring.
- Record planting dates, varieties and seeding rates for each field.
- After any storm, flood or drought spell, note the date and take dated photos on the ground.
- Keep a season-long series of satellite vegetation maps for each field, so you can show conditions before and after an event.
- Tell your agent about damage within the time your policy requires, and do not destroy the crop or required sample areas until the adjuster agrees.
- For index cover, compare your own history with the historical index for your grid before choosing intervals and coverage.
Field monitoring tools such as the Farmonaut Satellite + AI Farm Monitoring System show Sentinel-2 vegetation maps for fields you draw on a map, which can help keep this season-long record.
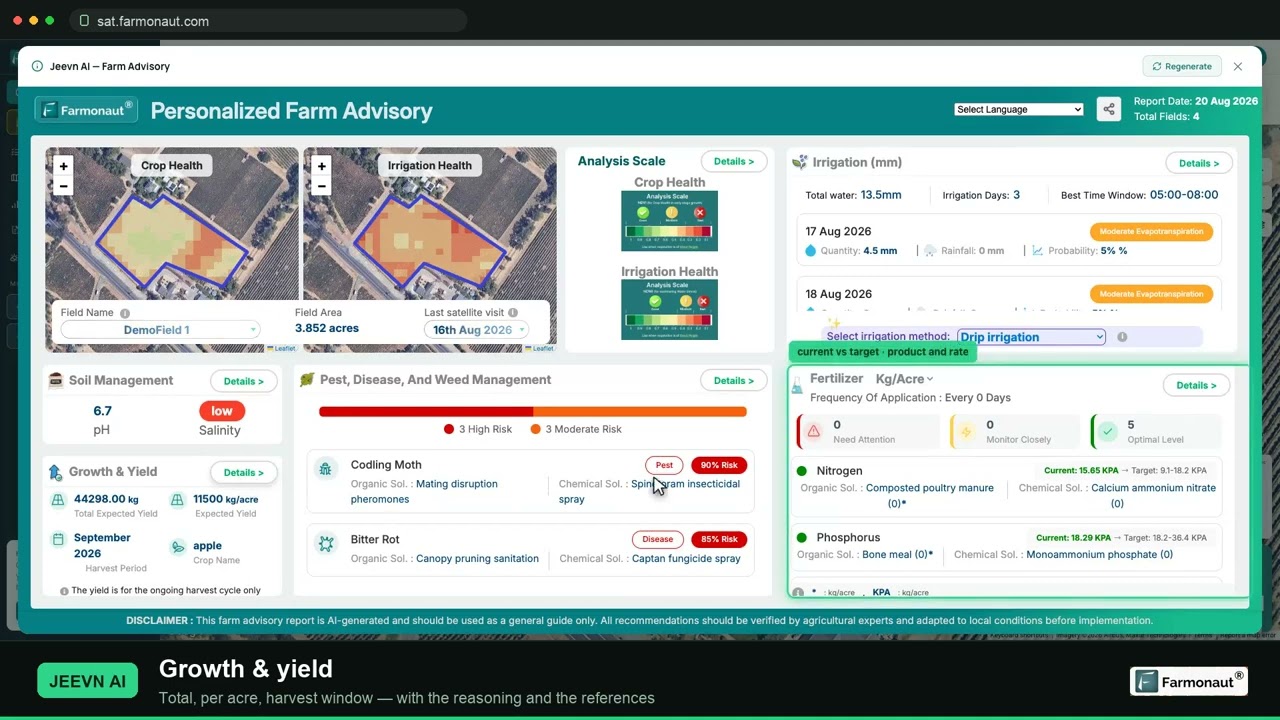
▶ A full walkthrough of satellite crop monitoring: reading NDVI maps and pulling a field report. · 19:36
Questions to ask your agent about imagery
Insurers differ in how they use imagery, and rules differ by plan and country. These questions help you understand where you stand before a loss happens.
- Is my policy an individual yield or revenue policy, an area plan or an index plan? The answer decides whether a field visit or a data index sets the payment.
- For an index plan, which grid or area am I in, which data source sets the index, and when is the final index published?
- After damage, how soon must I report it, and which parts of the crop must I leave in the field?
- Will the adjuster look at satellite or drone images, and can I add my own dated maps and photos to the file?
- If imagery and my harvest records disagree, which one does the policy treat as the record?
Outside the United States the same questions apply. Canadian provinces run their own AgriInsurance programs, and in the UK, Europe, Australia and New Zealand crop cover is mostly sold by private insurers with their own claim rules. Ask for the claim procedure in writing.
Index plan or individual cover: a quick comparison
| Question | Index plan (such as PRF) | Individual yield or revenue policy |
|---|---|---|
| What sets the payment? | Index for the grid or area | Your own yield or revenue against your guarantee |
| Field visit needed? | No | Yes, by a loss adjuster |
| Main risk | Basis risk | Slower claims, record disputes |
| Role of imagery | Can be the index itself | Supporting evidence |
FAQ
How quickly after a flood or drought can satellite data show likely crop losses?
For floods, Copernicus Rapid Mapping provides event extent maps within hours or days of an activation, and radar satellites see through cloud. For drought, a clear picture builds over several weeks of optical passes compared with earlier seasons.
Does USDA crop insurance use satellite imagery?
Yes, in several ways. RMA has used Landsat imagery in compliance investigations since at least 2005, NASS builds its yearly Cropland Data Layer from Landsat and Sentinel-2, and the PRF plan uses gridded NOAA rainfall data. Individual claims are still decided by a loss adjuster under the policy.
Can a satellite image replace a loss adjuster?
Not for individual yield or revenue policies. Images help show timing and extent, but the adjuster applies the policy rules, takes samples and confirms the cause of loss. Index policies are different: they pay on the index alone.
What is basis risk in index crop insurance?
It is the gap between the index for your grid or area and what happened on your own farm. You can have a loss and no payment, or a payment and no loss.
Does my rain gauge count for the PRF Rainfall Index?
No. RMA uses NOAA Climate Prediction Center interpolated rainfall for the grid, which may not match the rain at any single point on your ranch.
Can I use my own satellite maps to support a claim?
You can share dated maps and photos with your agent and adjuster as supporting records. Whether and how they are used depends on your insurer and the policy, so ask your agent before relying on them.
Related pages on our site: crop loan and insurance verification, large-scale farm management app, satellite data API, satellite and weather API documentation, carbon footprinting, product traceability and the Farmonaut app.
Farmonaut crop monitoring
Keep a satellite record of every field
Draw your fields once and Farmonaut shows Sentinel-2 vegetation maps for them through the season, on web, Android or iOS.




Keep reading
Sources
- USDA RMA, Summary of Business report for 2014 thru 2023: pubfs-rma.fpac.usda.gov
- USDA RMA, Rainfall Index Pasture, Rangeland, Forage program summary (2024): rma.usda.gov
- USDA RMA, Pasture, Rangeland, Forage frequently asked questions: rma.usda.gov
- USDA RMA, RMA makes progress against insurance program fraud and abuse (December 2005): legacy.rma.usda.gov
- AFSC, 2022 Satellite Yield Insuring Agreement: afsc.ca
- ESA, Sentinel-2 mission overview: esa.int
- ESA, Sentinel-1 mission overview: esa.int
- USDA NASS, Cropland Data Layer metadata and FAQs: nass.usda.gov
- Copernicus Emergency Management Service, Rapid Mapping: about the service: mapping.emergency.copernicus.eu
- 7 CFR 457.8, Common Crop Insurance Policy (Cornell LII): law.cornell.edu
- Congressional Research Service, Federal Crop Insurance: A Primer: everycrsreport.com
- AFSC, Satellite Yield Insurance program cancellation Q&As: afsc.ca
- USGS, Landsat 9: usgs.gov
Discussion
Questions, corrections or field experience? Share them below. First-time comments are reviewed before they appear, and your email is never published.
No comments yet. Be the first to add a question or your experience.

 Zerella Group
 Agroes
 Etech Consulting Madagascar
 Vestlandsforsking
 Agritein
 Delicio
 WB Dev
 Sama Premium
 Prochecker
 Tres Valles
 LACOS Geoinformation
 Magrifly
 LatConnect 60
 WebsEdge
 Blickwinkel
 Agricultural Credit Policy Council
 Marei Nursery
 eKGIS
 Mostas Tech
 Andex

 Exploration consultancy · South Africa · Gold
 Licence holder · Niger · Gold
 Licence holder · Nigeria · Gold + lithium










