

Wyoming · Farm data guide
Wyoming Agriculture: Top Products, Crops and County Data
Cattle and calves earned US$1.08 billion of Wyoming’s US$1.60 billion in farm sales in 2022 (USDA census). Hay is the largest crop, at 1.93 million tons in 2025, and five counties made about 41% of sales.
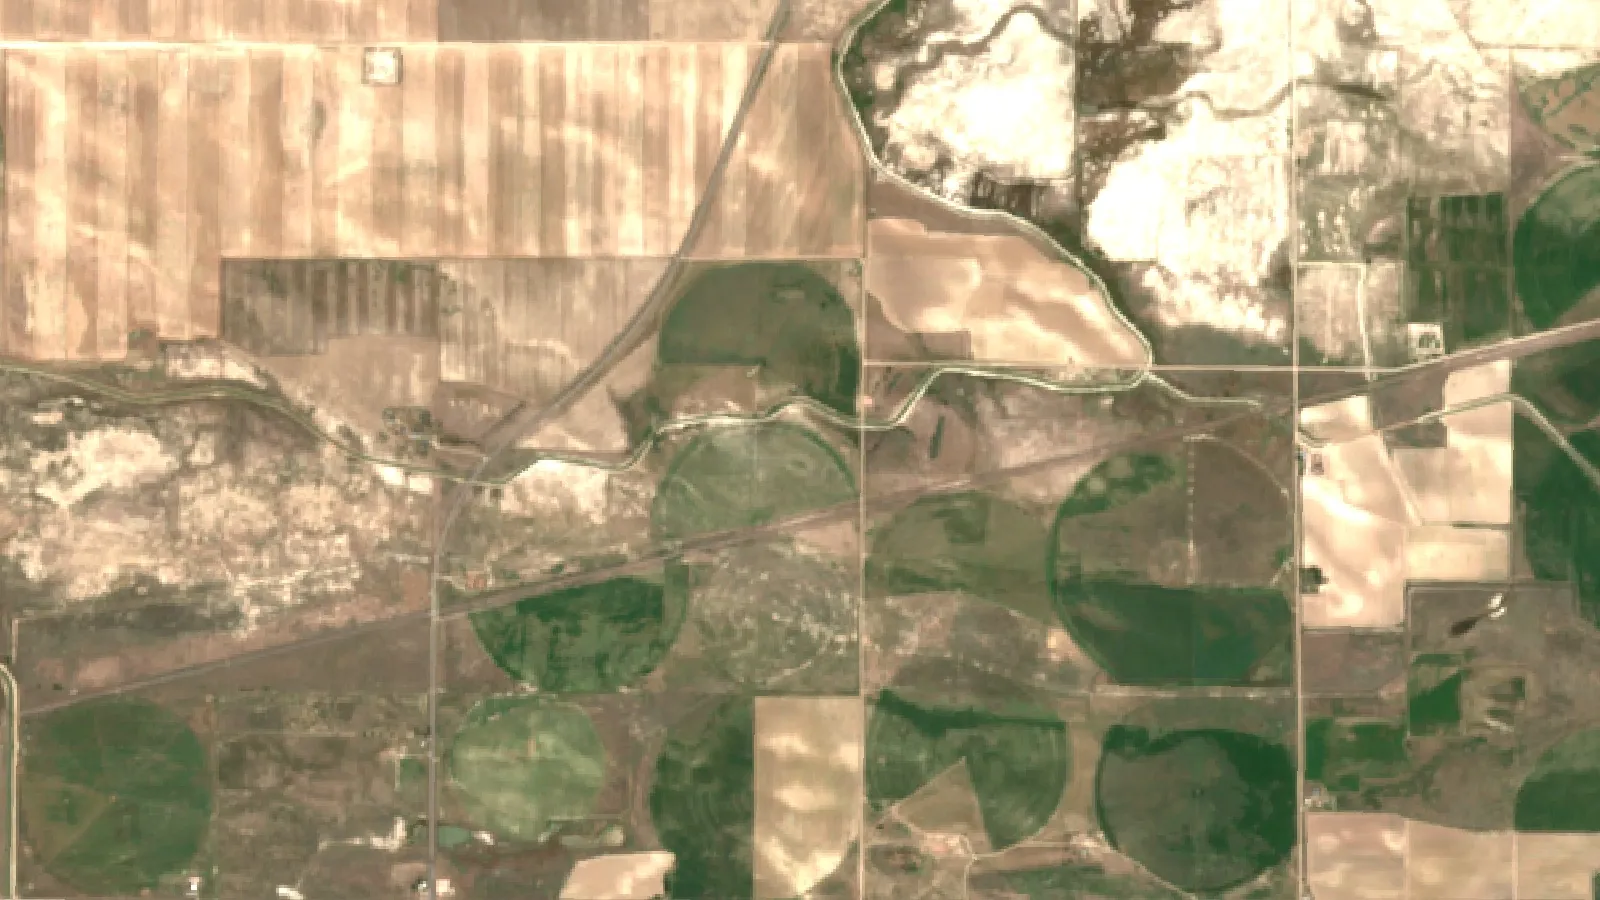
Key takeaways
- Livestock made up 78% of Wyoming farm sales in 2022, and crops 22% (USDA census).
- Cattle fell to 1.16 million head on 1 January 2026, from 1.32 million in January 2020 (NASS).
- Hay led crops in 2025: 950,000 acres, 1.93 million tons, US$291 million (NASS).
- Goshen County sold the most in 2022, at US$204.6 million, or 13% of the state total.
- Wyoming ranked 1st for average farm size and tied for 1st in wool in 2023 (NASS).
In this article
- Wyoming agriculture at a glance
- Main Wyoming agriculture products
- What crops are grown in Wyoming, and where the money is
- What Wyoming farm land costs to rent
- Water, drought and irrigation pressure
- Grazing and rangeland care
- Rural development priorities in Wyoming
- Challenges facing Wyoming agriculture
- How we checked the numbers
- FAQ
Wyoming agriculture sold US$1.6 billion of products in 2022, and livestock made up 78% of that, according to the USDA 2022 Census of Agriculture profile. Among livestock, cattle and calves lead, followed at a distance by hogs and sheep. Hay is the largest crop, ahead of corn and sugarbeets.
This guide lists the main products with dated federal numbers, shows which counties earn the most and explains the water, weather and market pressures producers face. It also has a calculator for testing the margin on irrigated hay.
Wyoming agriculture at a glance
Wyoming has few farms by national standards but very large ones. The 2023 rankings in the NASS Wyoming bulletin put the state 39th for number of farms, 11th for land in farms and 1st for average farm size. The table uses the newest published figure for each item, so check the date beside it.
| Measure | Figure | Date and basis |
|---|---|---|
| Farms and ranches | 10,500 | NASS survey estimate, 2025 |
| Land in farms | 28.8 million acres | NASS survey estimate, 2025 |
| Average farm | 2,743 acres | NASS survey estimate, 2025 |
| Products sold | US$1.60 billion | Census of Agriculture, 2022 |
| Net cash farm income | US$299 million | Census of Agriculture, 2022 |
| Pastureland | 25.6 million acres | Census of Agriculture, 2022 |
| Cropland | 2.3 million acres | Census of Agriculture, 2022 |
Land use explains the product mix. Pastureland covers about 89% of Wyoming farmland and cropland about 8%. Most of the state grows grass for animals, and much of its cropland grows feed for those same animals.
The average also hides a wide spread. In the 2022 census, 36% of farms sold less than US$2,500 of products, while 24% sold US$100,000 or more. Farms of 1,000 acres or more were 28% of the total, and farms under 50 acres were about 30%. Family farms made up 93%.
Main Wyoming agriculture products
The list below ranks product groups by 2022 census sales, then adds the newer survey inventory or output. Other agriculture products exist in smaller volumes, including milk, honey and vegetables.
| Product | 2022 census sales | Latest output or inventory |
|---|---|---|
| Cattle and calves | US$1,078 million | 1.16 million head, 1 Jan 2026 |
| Hay and other crops | US$184 million | 1.93 million tons of hay, 2025 |
| Grains, beans, peas | US$153 million | Barley, corn, wheat and dry beans |
| Hogs and pigs | US$52 million | 96,000 head, 2023 ranking table |
| Sheep, goats, wool | US$44 million | 280,000 sheep, 1 Jan 2026 |
| Milk from cows | US$31 million | 9,000 milk cows, 1 Jan 2026 |
Cattle and calves
Cattle and calves brought in US$1.08 billion in 2022, about two-thirds of all farm sales and 18th among US states. The 2025 state agriculture overview counts 1.16 million cattle on 1 January 2026, including 621,000 beef cows. The herd has shrunk from 1.32 million in January 2020, a drop of about 12%, and beef cows have fallen from 724,000 over the same period.
Best known for: cow-calf ranching on large areas of pasture. Goshen County held the largest county herd in the January 2024 estimates, with 110,000 head, followed by Carbon with 96,000 and Fremont with 87,000.
Sheep, lambs and wool
Sheep count for far less money than cattle, but this is where Wyoming stands out nationally. In 2023 it ranked 4th for sheep and lambs, 2nd for lamb crop and tied for 1st with California in wool production, at 2.3 million pounds. Numbers are falling, though: 360,000 head in January 2017, 320,000 in January 2024 and 280,000 in January 2026.
Best known for: range flocks. Converse County had the largest published county flock in January 2024, at 51,000 head, followed by Uinta at 32,500 and Washakie at 30,000.
Hay and alfalfa
Hay is the crop that holds the livestock system together. In 2025, producers harvested 950,000 acres for 1.93 million tons, worth US$291 million. Alfalfa supplied 1.25 million tons of that, about 65%, at an average of 2.5 tons per acre. Other hay averaged 1.5 tons per acre.
That 2025 harvest was well below 2023, when 1.09 million acres gave 2.55 million tons worth US$517 million at US$204 per ton. The 2025 average price was US$158 per ton for all hay and US$167 for alfalfa. These are marketing-year averages, not auction or dealer prices.
Corn, barley and wheat
Grain grown in Wyoming is modest in national terms. In 2025, corn for grain yielded 145 bushels per acre on 54,000 acres, for a value of US$37.5 million. A further 23,000 acres went to silage, which also feeds animals.
Barley is the stronger national player, ranking 5th among states in 2023. In 2025, growers harvested 45,000 of 71,000 planted acres, at 112 bushels per acre and US$5.83 per bushel. Winter wheat covered 89,000 harvested acres at 30 bushels per acre, worth US$12.1 million.
Sugarbeets and dry beans
Sugarbeets are a small but high-tonnage crop. Growers harvested 30,800 acres in 2025 and produced 995,000 tons at 32.3 tons per acre. The state ranked 7th for sugarbeets in 2023. The overview gives no 2025 sugarbeet value, and the last value in the bulletin is US$36.6 million for 2022.
Dry beans are smaller again. Wyoming ranked 9th in 2023 with 299,000 hundredweight, and 7th for pinto beans. The state also has a Wyoming Bean Commission, listed on the Wyoming Department of Agriculture site.
Crops grown in smaller amounts
Hemp, lentils and peas do not appear in the NASS state overview crop table, so treat acreage claims for them with care. Vegetables, melons and potatoes brought in US$7.5 million in 2022, and nursery and greenhouse products US$12.7 million. Organic farms and direct sales exist as well, and the census profile is the place to check counts for those.
Chart
Wyoming all-hay price, 2014 to 2023
US$ per ton, marketing-year average
What crops are grown in Wyoming, and where the money is
By harvested acres in the 2022 census, the top crops were forage (1.06 million acres), wheat for grain (102,000), barley (61,000), corn for grain (58,000) and corn for silage (30,000). So the short answer to “what crops are grown in Wyoming” is hay first, with grains well behind.
Chart
Top Wyoming counties by farm product sales, 2022
US$ million, market value of products sold
Hay also leads by value, as the 2025 chart shows, but the order then changes: corn earned more than barley or wheat. Sales are also uneven across the map. The five top counties in the USDA county profiles made about 41% of state sales in 2022: Goshen, Laramie, Platte, Fremont and Big Horn.
Goshen County alone sold US$204.6 million, or 13% of the state total. Its average farm of 1,707 acres is smaller than the state average, and 241,931 acres of it are cropland. By contrast, Carbon County has the most land in farms, at 2.87 million acres, but sold US$77.5 million.
Chart
Value of selected Wyoming crops, 2025
US$ million; sugarbeet value not published in this table
What Wyoming farm land costs to rent
Cash rent shows how much more renters pay for irrigated ground than for dry ground. In the 2023 NASS county estimates, the state average was US$86.50 per acre for irrigated cropland, US$20 for non-irrigated cropland and US$5.90 for pasture. Rents differ widely by county and some counties have no published figure for a given year.
Chart
Irrigated cropland cash rent, selected counties
US$ per acre, six of the ten counties with both years published, plus the state
Use these as starting points only. A real lease depends on water rights, the reliability of supply, fencing, access and who pays for what. Get local and legal advice before signing one.
Try the numbers for your own farm below.
Calculator
What is your margin on irrigated hay?
Enter your own acres, yield, price, costs and rent.
- Margin per acre, US$: $1
- Break-even price, US$/ton: $167
Example values only, not a benchmark or a forecast. The defaults sit near break-even on purpose. Yield and price start from the 2025 Wyoming alfalfa averages and rent from the 2023 state irrigated average (USDA NASS); the cost is a round example. Use your own figures and get professional advice before making financial decisions.
Water, drought and irrigation pressure
Water sets the limit on crop output. Water rights are supervised by the Wyoming State Engineer’s Office under the prior appropriation system, so the date and terms of a right can matter as much as the soil. Check your rights with that office before changing use or adding acres.
Dry spells remain a live risk. The Drought.gov Wyoming page, read on 5 November 2026, ranked January to September as the 16th driest such period since 1895, with 9.63 inches of precipitation, 3.07 inches below normal. It also estimated about 461,800 residents living in areas of drought.
Practical steps for irrigated land:
- Match water to crop need with soil moisture readings and weather forecasts, rather than a fixed calendar.
- Check for uneven pivots and leaks early in the season.
- Decide in advance which fields lose water first if supply runs short.
- Ask about project help. The Wyoming Water Development Commission publishes project application details and an emergency water projects program.

▶ How soil and water together shape what a farm can produce. · 9:40
Grazing and rangeland care
With 25.6 million acres of pasture, range condition matters more here than almost any crop decision. The main levers are stocking rate, season of use, rest and water placement. A stocking rate that works in a wet year can damage grass in a dry one, so write down a destocking trigger before you need it.
The University of Wyoming Extension runs programs across the 23 counties and the Wind River Reservation. It is a good first contact for agriculture and natural resource questions. Conservation tools such as reduced tillage, cover crops and crop rotation suit some fields, but results vary by rainfall and elevation, so test them on a small area first.
Where satellite monitoring fits
Large, scattered holdings are hard to check on the ground. Satellite vegetation maps can show which fields or pastures are changing faster than the rest, so you know where to drive first. The Farmonaut Satellite + AI Farm Monitoring System is one such tool. A satellite shows the change, not its cause, so a field visit still has to confirm whether it is water, grazing, pests or something else.

▶ Six plain steps to start precision agriculture without buying a robot. · 4:18
Rural development priorities in Wyoming
People also search for how Wyoming measures rural development and which regions are most active. The state’s economic development agency is the Wyoming Business Council, whose draft mission, set out after a May 2026 board meeting, is to lead economic growth and support communities in charting their own paths. Its community work covers regional directors, Business Ready Community funding, Community Development Block Grants and broadband.
Priorities you can see in public programs:
- Broadband. The Business Council’s broadband office works on where service is and is not available, using the federal benchmark of 100 Mbps down and 20 Mbps up. In the 2022 census, 84% of farms had internet access.
- Water. The Water Development Commission handles project applications and emergency water projects.
- Community capacity. Regional directors link towns to state resources.
- The next generation of producers. Of 20,192 producers in 2022, 8,504 were aged 65 or older and 1,833 were under 35.
Regions. We did not find a public ranking of regions by development activity, but farm sales show where agricultural income concentrates. The southeast leads, through Goshen, Laramie and Platte counties, with Fremont and Big Horn next. Teton, Sweetwater and Hot Springs had the smallest sales in 2022.
Measuring success. Useful yardsticks for farm communities are the number of farms, net cash income, the share of farms with internet and producer age. All four appear in each census profile. The profile also gives the change since 2017 for farm numbers and net cash income, but not for internet access or producer age. Statewide, the record is mixed: farms fell 12% while net cash farm income rose 12%. Government payments rose 293% to US$118.8 million, which also lifted income in that period.
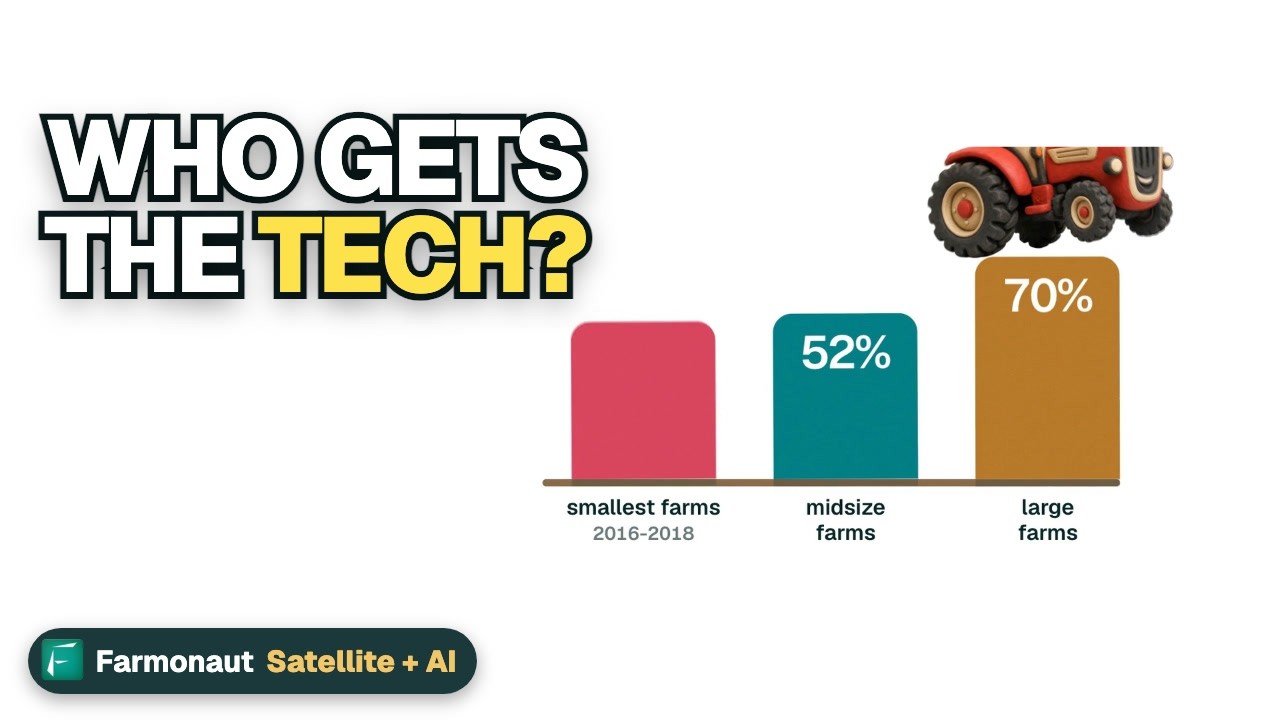
▶ What farm technology means for money, jobs and internet in rural towns. · 3:50
Challenges facing Wyoming agriculture
- Smaller herds and flocks. Cattle and sheep numbers have both fallen since 2020, as the figures above show.
- Thin margins. In 2022, farm production expenses of US$1.53 billion took up most of the US$1.60 billion in product sales. Expenses rose 15% from 2017, against 9% for sales.
- Weather and water. Dry years cut forage and raise feed needs at the same time.
- Distance. Long hauls to buyers and input suppliers add cost for remote operations.
- Succession. About 42% of producers were 65 or older in 2022.
Agritourism and direct sales can add income for some ranches, through ranch stays, tours and local food sales. Treat them as a separate business with their own insurance, permits and labor needs. Check county and state rules first.
How we checked the numbers
We used three federal series and show the year and basis beside each figure. The Census of Agriculture aims to count every farm every five years, most recently for 2022. The NASS annual overview gives survey estimates for 2025 crops and January 2026 inventories. The NASS annual bulletin gives ten-year crop tables, county herd counts and rankings up to its 2024 edition. Census and survey figures differ in method, so small gaps between them are normal.
The 2024 bulletin, using USDA Economic Research Service data, also reports US$2.43 billion of value added by the farm sector and US$1.91 billion of cash receipts. Its text dates them to 2023, while its tables list them under 2022. Those are different measures from census sales and should not be compared directly.
Related pages on our site: carbon footprint tracking, product traceability, farm fleet management, crop loan and insurance checks, large farm administration, satellite data API, API developer documents and web and mobile apps.
FAQ
What is Wyoming’s top agricultural product?
Cattle and calves. They brought in US$1.08 billion of the US$1.60 billion in products sold in 2022, according to the census.
What crops are grown in Wyoming?
Mainly hay, especially alfalfa, followed by corn, barley, winter wheat, sugarbeets and dry beans. Hay covered 950,000 acres in 2025.
How many farms are in Wyoming?
NASS estimates 10,500 farms and ranches on 28.8 million acres in 2025. The 2022 census counted 10,544, down 12% from 2017.
Which Wyoming county sells the most farm products?
Goshen County, with US$204.6 million in 2022, or 13% of state sales. Laramie County was second at US$162.7 million.
Does Wyoming lead the nation in anything farm-related?
In the 2023 rankings it had the largest average farm size among states and tied with California for first in wool production.
Where can I get local help?
Start with your county University of Wyoming Extension office for production questions, and the State Engineer’s Office for water rights.
Farmonaut crop monitoring
See your own fields from space
Check how your fields and pastures are changing across the season with satellite maps.




Keep reading


Sources
- USDA NASS, 2025 State Agriculture Overview for Wyoming: nass.usda.gov
- USDA NASS, Wyoming Annual Bulletin 2024: nass.usda.gov
- USDA NASS, 2022 Census of Agriculture, Wyoming state profile: nass.usda.gov
- USDA NASS, 2022 Census of Agriculture, Goshen County profile: nass.usda.gov
- USDA NASS, 2022 State and County Profiles, Wyoming: nass.usda.gov
- USDA NASS, Wyoming Field Office: nass.usda.gov
- NIDIS, Drought.gov Wyoming page (read 5 November 2026): drought.gov
- Wyoming State Engineer’s Office: seo.wyo.gov
- Wyoming Water Development Commission: wwdc.state.wy.us
- University of Wyoming Extension: uwyo.edu
- Wyoming Business Council, About (2026): wyomingbusiness.org
- Wyoming Business Council, Communities: wyomingbusiness.org
- Wyoming Business Council, Broadband: wyomingbusiness.org
- Wyoming Department of Agriculture: agriculture.wy.gov
Discussion
Questions, corrections or field experience? Share them below. First-time comments are reviewed before they appear, and your email is never published.
No comments yet. Be the first to add a question or your experience.

 Red August Group
 Farm Inc
 JJM Farms
 WeMe Global
 Pixxel
 Agrotoken
 Blue BearX
 Insignito
 Croptimum
 DnCubed
 Field Capacity
 Indosistim Teknologi
 Liquify Digital
 CU Foods
 BeyondTech Global
 Rouge VC
 AgroGreen Dynamics
 AgroRisk
 Oath Inc
 Reddane Farming

 Licence holder · Niger · Gold
 Client · Tanzania · Gold
 Client · Somalia · Gold










