

Reviewed August 2026 against World Bank Development Indicators, FAO FAOSTAT, and USDA NASS/ERS.
Try it: Run your own numbers →
Land Use in India vs. the US: Where the Acres Go
India puts 60.06% of its total land area into agriculture, per the World Bank’s 2023 figure (indicator AG.LND.AGRI.ZS) — the highest share of any large economy, and the reason “what is the majority of land used for in India” has one answer: farming. Of that, 51.75% of India’s land is arable (row-crop land, per AG.LND.ARBL.ZS, 2023), while pasture accounts for a much smaller 3.5% (AG.LND.PERM.ZS, 2018). For comparison, the United States dedicates 39% of its land base to farming — 880.1 million acres, per the USDA’s 2022 Census of Agriculture — split closer to evenly between cropland and grazing land. This piece lays out both distributions side by side, with the exact sourcing to check either number when it updates.



Table of Contents
- What Percentage of Land Is Used for Agriculture
- How Land Use Is Classified: Arable, Pasture, and Other Types
- India’s Land Distribution in Detail
- US Farmland: How Much and Where
- Global Cropland and Pasture for Context
- Comparison Table: India vs. US vs. World
- Calculator: Convert Your Farm’s Share of a Region’s Land
- How These Numbers Are Changing — and How to Refresh Them
- Monitoring Farmland with Satellite Data
- FAQ: Land Use and Agricultural Land Share
- Try it: Run your own numbers
What Percentage of Land Is Used for Agriculture
“Land area used for agriculture” is tracked most consistently by the World Bank’s Development Indicators, which pull from FAO country reporting. For India, agricultural land — the sum of arable land, permanent crops, and permanent pasture — stood at 60.06% of total land area in 2023 (World Bank, AG.LND.AGRI.ZS). That is the figure behind the claim that agriculture is “the majority of land used” in India: any share above 50% is a majority, and India clears that by 10 points.
Split that 60.06% into its parts and arable land (land under temporary crops, temporary meadows, market gardens, and land temporarily fallow) makes up 51.75% of India’s total land area in the same 2023 release (AG.LND.ARBL.ZS). Permanent pasture — grassland used for grazing, not plowed — is a much smaller 3.5% (2018, AG.LND.PERM.ZS), and the remainder of the 60.06% is permanent-crop land (orchards, plantations). In absolute terms, FAO’s FAOSTAT database puts India’s total cropland at 168 million hectares for 2022 — among the largest cropland footprints of any country, arable land distribution in India runs overwhelmingly toward crops rather than grazing, which is the opposite of the US pattern below.
For readers comparing this to their own country or region, the same World Bank indicator (AG.LND.AGRI.ZS) reports agricultural land share for every country the Bank tracks — swap the country code in the URL or use the site’s country selector to pull a different one.
How Land Use Is Classified: Arable, Pasture, and Other Types
Before comparing countries, it helps to know what each term actually measures, since “arable land,” “cropland,” and “agricultural land” are not interchangeable — a distinction covered in more depth in Farmonaut’s land use classification guide:
- Agricultural land — the broadest category: arable land + permanent crops + permanent pasture combined. This is what “60.06%” refers to for India.
- Arable land — land under temporary crops (cereals, oilseeds, vegetables) or temporarily fallow, excluding permanent crops and pasture. India: 51.75% of total land (2023, World Bank).
- Cropland — FAOSTAT’s term, roughly equivalent to arable land plus permanent crops. India: 168 million hectares (2022, FAOSTAT); US: 390 million acres (2017, USDA ERS).
- Permanent pasture — grassland used for grazing livestock, not rotated into crops. India: 3.5% of total land (2018, World Bank); US: 659 million acres of grassland pasture and range (2017, USDA ERS).
- Permanent crops — orchards, vineyards, plantation crops (tea, coffee, rubber) that occupy land for multiple years without replanting each season.
This is also why “arable land of India” (51.75%) and “land area used for agriculture” (60.06%) are two different, both-correct answers depending on which query you’re actually asking.

India’s Land Distribution in Detail
India’s land use breaks into three tiers once you move past the headline 60.06% agricultural share. Arable land (51.75%) dominates, concentrated on cereal and pulse rotations across the country’s major river plains. Permanent pasture (3.5%) is comparatively thin — India’s livestock sector leans more on crop residues and smallholder stall-feeding than on open rangeland, which is why pasture’s share is so much lower than in land-abundant economies. The remaining agricultural-land share (roughly 4.8 points, filling the gap between 60.06% total and the 51.75% + 3.5% arable-and-pasture subtotal) is permanent-crop land: orchards, tea and coffee estates, and plantation crops that aren’t replanted annually.
Non-agricultural land — the other roughly 40% of India’s area — covers forest, urban and built-up land, and land that’s barren or otherwise unclassified. The World Bank’s agricultural-land series doesn’t break out forest or urban shares itself; those come from separate FAO land-cover layers and India’s own forest-survey reporting, which sit outside the World Bank/FAO indicators used as the evidence base here. If you need a state-by-state or category-by-category breakdown for India specifically, that level of granularity isn’t in the World Bank’s national aggregate — it requires India’s agricultural ministry databases directly.
On “land distribution in India” as a search: the distribution is skewed toward cropping, not grazing — 51.75 points of arable land against 3.5 points of pasture, roughly a 15-to-1 ratio. That ratio is itself a useful comparison point against a country like the US, where cropland and pasture are much closer in size (below).

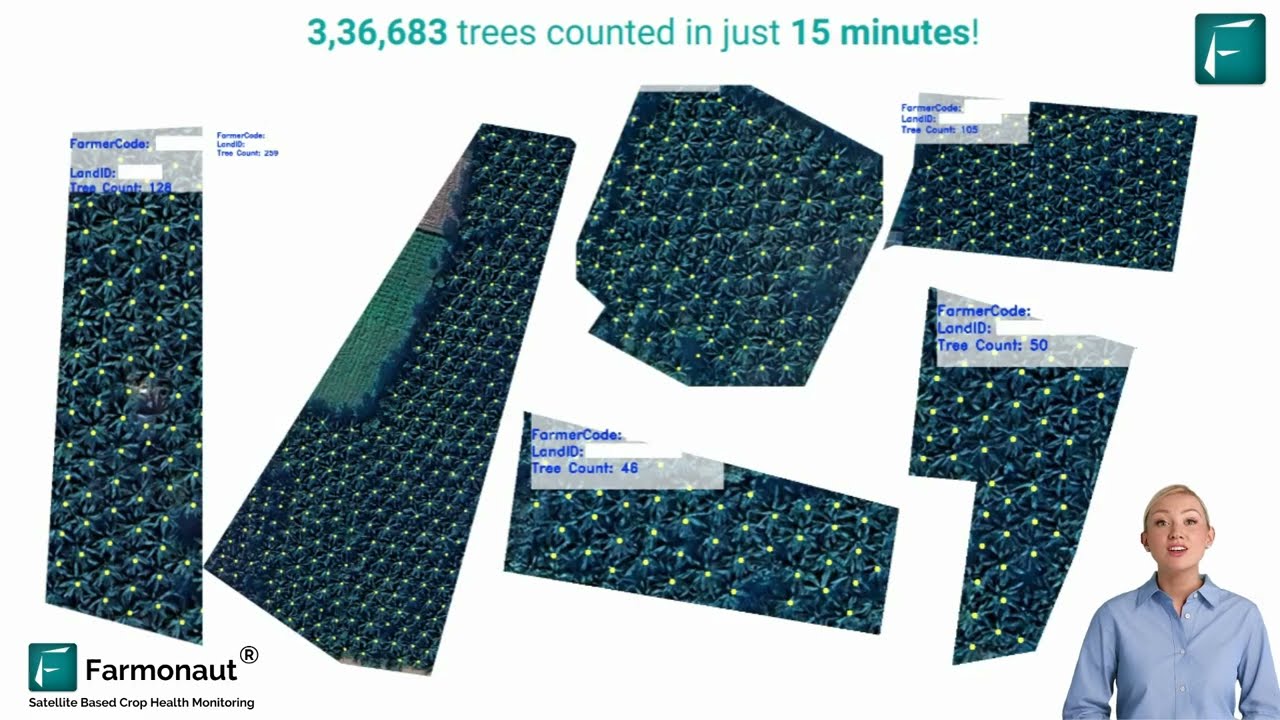
National averages like 51.75% arable land don’t tell an individual grower what’s happening on their own fields. Farmonaut’s large-scale farm management platform uses satellite vegetation indices to monitor which parcels are actively cropped, fallow, or degraded — parcel-level data that no national statistic can substitute for.
US Farmland: How Much and Where
The United States reports its land use through the USDA rather than the World Bank’s FAO-fed series, and the two agencies frame the numbers a little differently. The USDA’s 2022 Census of Agriculture puts total US farmland at 880.1 million acres, or 39% of the country’s total land area — a figure collected every five years directly from farm operators (next full census: 2027). That 880.1 million acres splits, per USDA Economic Research Service’s 2017 land-use survey, into roughly 390 million acres of cropland and 659 million acres of grassland pasture and rangeland (the two figures overlap somewhat with the Census total because they’re drawn from a different survey year and methodology).
That cropland-to-pasture ratio — about 0.6 acres of cropland for every acre of pasture — is close to the inverse of India’s pattern, where arable land outweighs pasture roughly 15 to 1. The US has vastly more grazing land relative to its cropland because of the sheer scale of Western rangeland, while India’s pasture share stayed thin as livestock production shifted toward crop-residue feeding on already-cultivated land.
The US agricultural land base has also been shrinking over time: USDA ERS’s 2017 survey notes agricultural land fell to 53% of the total US land base, down from 59% in 1959 — nearly six percentage points lost over roughly six decades, mostly to urban expansion and forest reversion. That decline is the US parallel to the “urbanization and land use change” pressure described for India elsewhere on this page — a similar underlying dynamic (cropland and pasture converting to urban and built-up use), acknowledged here rather than covered in a page that isn’t Farmonaut’s assigned target for it. That dynamic is explored in more general terms in Farmonaut’s piece on agricultural expansion, deforestation, and urban growth.
Distinguishing active cropland from grazing land and from land at risk of degradation is a remote-sensing problem as much as a policy one. Farmonaut’s forest and land-cover monitoring tools and its work on land degradation detection apply the same satellite methods to track where farmland, rangeland, and degraded land actually sit on the ground, independent of self-reported survey boundaries.
Global Cropland and Pasture for Context
Set against the rest of the world, both India’s and the US’s shares are well above the global norm. FAO’s FAOSTAT database puts total global agricultural land (cropland plus pasture combined) at 4,788 million hectares in 2021, made up of 1,580 million hectares of cropland and 3,208 million hectares of permanent meadows and pasture — globally, pasture outweighs cropland roughly 2 to 1, the opposite of India’s ratio and closer to (though still more pasture-heavy than) the US pattern.
India’s 168 million hectares of cropland (FAOSTAT, 2022) is a little over a tenth of the world’s 1,580 million-hectare cropland total (2021) — a large absolute share for one country, consistent with India ranking among the largest cropland footprints globally even though its land area is a fraction of the US or Brazil’s.
Comparison Table: India vs. US vs. World
| Metric | India | United States | World |
|---|---|---|---|
| Agricultural land, % of total land area | 60.06% (2023) | 39% (2022) | — |
| Arable/cropland, % of total land area | 51.75% (2023) | ~17% (390M of ~2,271M acres total land, 2017) | — |
| Permanent pasture, % of total land area | 3.5% (2018) | ~29% (659M acres, 2017) | — |
| Total cropland (absolute) | 168 million hectares (2022) | 390 million acres (2017) | 1,580 million hectares (2021) |
| Total pasture/grazing land (absolute) | — | 659 million acres (2017) | 3,208 million hectares (2021) |
| Total farmland (absolute) | — | 880.1 million acres (2022) | 4,788 million hectares (2021) |
| Primary source | World Bank AG.LND.AGRI.ZS | USDA NASS Census of Agriculture | FAO FAOSTAT |
Note on the US arable-land percentage above: USDA reports cropland and pasture in absolute acres, not as a share of total US land area, so the percentages shown for the US row are calculated by dividing the USDA ERS 2017 cropland and pasture figures by the total US land area implied by the 39% farmland share (880.1 million acres = 39% of total, so total ≈ 2,257 million acres); treat these as approximations built from two USDA releases rather than a single reported percentage.
Calculator: Convert Your Farm’s Share of a Region’s Land
Use the figures above to see how a specific farm or parcel compares against a country’s average agricultural-land share — enter the parcel size and pick a reference country to see what fraction of that country’s farmland (or, in acres/hectares, of a hypothetical equivalent-sized country) it would represent.
Assumes 1 hectare = 2.47105 acres. India and world reference figures are cropland only (not total agricultural land, which also includes pasture); the US reference figure is total farmland (cropland plus pasture and other farm acreage), so the three comparisons are not measuring identical categories — treat the output as an order-of-magnitude reference, not an exact equivalence.
How These Numbers Are Changing — and How to Refresh Them
None of the figures above are static, and the article is only as useful as its refresh path. Here’s where each series comes from and how often it moves:
- World Bank agricultural-land indicators (AG.LND.AGRI.ZS, AG.LND.ARBL.ZS, AG.LND.PERM.ZS) update annually, typically in March–April, following the release of underlying UN FAO data. Check the India agricultural-land indicator page directly for the current year’s release, or swap the country code in that URL for any other country.
- USDA NASS Census of Agriculture runs on a five-year cycle — the last full census covered 2022, and the next is scheduled for 2027. Between censuses, USDA NASS publishes interim acreage estimates annually via its QuickStats database (quickstats.nass.usda.gov).
- FAO FAOSTAT cropland and pasture figures update annually for most countries, typically released in March–April, at fao.org/faostat.
On the gaps: a state-by-state breakdown of India’s land use, and India’s organic-agriculture acreage specifically, are not available at the granularity this article’s sources provide — the World Bank and FAOSTAT report national aggregates only, and sub-national detail would require going directly to India’s agricultural ministry databases, which fall outside the US-audience sourcing used here. Similarly, conservation-reserve and protected-area land use in India sits with environmental-ministry data outside the FAO/World Bank indicators cited above — if you need that figure, it won’t be found in the sources this article draws from.
The durable takeaway, independent of any single year’s number: check whether a “land use” statistic is reporting agricultural land (arable + permanent crops + pasture combined), arable/cropland alone, or pasture alone before comparing it across countries or across time — a lot of apparent discrepancies between sources are just that mismatch, not a real change in land use.
Optimizing logistics across large or dispersed farmland is easier with Farmonaut’s fleet management platform, which streamlines vehicle use for agricultural supply chains — cutting operating costs and emissions regardless of how a given country’s land is classified.

Monitoring Farmland with Satellite Data
National land-use statistics tell you the aggregate picture; they don’t tell an individual operation which of its own acres are performing, degraded, or misclassified. Farmonaut applies satellite monitoring at the parcel level across the same categories discussed above — cropland, pasture condition, and land at risk of degradation:
- Satellite-Based Crop Health Monitoring: NDVI and related vegetation indices flag stress on cropland before yield loss becomes visible on the ground.
- Water and Irrigation Management: relevant to both US cropland (390 million acres, 2017 USDA ERS) and India’s arable land (51.75% of total area, 2023 World Bank), where irrigation efficiency directly affects how much land stays in active cultivation — see Farmonaut’s guide to water scarcity solutions.
- Blockchain Traceability: tracks farm produce from field to buyer, useful for verifying which land a given crop actually came from (learn more).
- Fleet & Resource Management: reduces logistics costs and emissions across large or scattered land holdings.
- Carbon Footprinting: measures emissions tied to land use and management decisions via Farmonaut’s carbon footprinting tool.
- Crop Loan and Insurance Support: satellite verification of land condition supports lending decisions through Farmonaut Crop Loan and Insurance.
- API Access: integrate satellite and weather intelligence directly into research or farm-management tools via the Farmonaut API (Developer Docs).
These tools sit alongside the broader shift toward data-driven land management described in Farmonaut’s precision agriculture trends coverage and its overview of the agricultural cycle — both relevant regardless of whether the land in question sits in an arable-heavy country like India or a pasture-heavy one like the US.
FAQ: Land Use and Agricultural Land Share
-
1. What percentage of India’s land is used for agriculture?
60.06% of India’s total land area is agricultural land, per the World Bank’s 2023 figure (AG.LND.AGRI.ZS) — the majority use of land in India by a wide margin. -
2. What percentage of land in India is arable specifically?
51.75%, per the World Bank’s 2023 arable-land indicator (AG.LND.ARBL.ZS) — this excludes permanent-crop and pasture land, which make up the remaining share of the 60.06% agricultural-land total. -
3. What is the majority of land in India used for?
Agriculture — specifically arable cropland. Arable land alone (51.75%) already exceeds 50% of India’s total land area; add permanent crops and pasture and the agricultural total reaches 60.06%. -
4. How does India’s agricultural land share compare to the US?
India: 60.06% (World Bank, 2023). United States: 39%, or 880.1 million acres (USDA NASS Census of Agriculture, 2022). India’s share is roughly 21 percentage points higher. -
5. What is India’s total cropland area in absolute terms?
168 million hectares, per FAO FAOSTAT’s 2022 data — about a tenth of the world’s 1,580 million-hectare cropland total (FAOSTAT, 2021). -
6. How much of India’s land is pasture versus cropland?
Pasture is a small share at 3.5% (World Bank, 2018) against 51.75% arable land (2023) — roughly a 15-to-1 ratio favoring cropland, the reverse of the US pattern. -
7. Where can I get an updated figure once these are out of date?
For India and other countries: the World Bank’s AG.LND.AGRI.ZS and AG.LND.ARBL.ZS indicators, updated annually each March–April. For the US: USDA NASS QuickStats for interim years, and the full Census of Agriculture every five years (next: 2027). For global totals: FAO FAOSTAT, updated annually.
Further reading:
Bottom Line on Land Use in India and the US
India’s land use is agriculture-dominated in a way few large economies match: 60.06% of its total land area is agricultural, and more than five-sixths of that is arable cropland rather than pasture. The US, at 39% farmland, splits its agricultural land much more evenly between the 390 million acres of cropland and 659 million acres of pasture and rangeland reported by USDA ERS for 2017 — and that US share has itself fallen from 59% in 1959 to 53% of the total land base by 2017, per the same USDA ERS survey. Both trends are worth re-checking against their primary sources on the schedule described above rather than assumed to hold indefinitely.
Discussion
Questions, corrections or field experience? Share them below. First-time comments are reviewed before they appear, and your email is never published.
No comments yet. Be the first to add a question or your experience.

 Cresol
 Atur Kuliner
 GlobalQuant
 MDCV UK
 Zerella Group
 Etech Consulting Madagascar
 Vestlandsforsking
 Agritein
 Delicio
 WB Dev
 Sama Premium
 Prochecker
 Tres Valles
 LACOS Geoinformation
 Magrifly
 LatConnect 60
 Blickwinkel
 Agricultural Credit Policy Council
 Marei Nursery
 eKGIS
eKGIS Mostas Tech
 Exploration consultancy · South Africa · Gold
 Licence holder · Niger · Gold
 Licence holder · Nigeria · Gold + lithium










