

Silver stocks · Ranked list
7 Best Silver Mining Stocks Ranked by Output
Fresnillo, Pan American Silver and Coeur Mining led the listed primary silver producers by 2025 output (World Silver Survey 2026). This list ranks seven by ounces, then adds Q3 output, costs and smaller names.
Key takeaways
- Top three by 2025 silver: Fresnillo 47.6 Moz, Pan American 22.8 Moz, Coeur 17.9 Moz (World Silver Survey 2026).
- Silver was $52 an ounce on November 4, 2026 (Fortune), far below the January high above $121 (Silver Institute).
- Average primary-mine cost was $12.21 an ounce in 2025 against a $40.03 average price (World Silver Survey 2026).
- Only 26% of 2025 silver came from primary silver mines, so many big producers are not pure plays.
- Q3 2026 reports show Fresnillo, First Majestic and Coeur lower on the year, Endeavour and Santacruz higher.
In this article
- Best Silver Mining Stocks Ranked by Output
- Latest Quarterly Silver Output by Company
- Silver Stock Prices, Costs and Which Companies Are Profitable
- Silver Companies That Are Big but Not Pure Plays
- Smaller Silver Mining Stocks and Other Names People Search For
- Silver Mining Stocks vs Bullion and Silver ETFs
- How to Compare Silver Stocks Before You Decide
- Why Silver Prices Move: Industrial Demand vs. Investment Demand
- Global Silver Market Scale: Production, Price, Reserves
- The Largest Silver Mines Behind These Stocks
- Silver Streaming and Royalty Companies
- Common Mistakes When Reading Best Silver Stocks Lists
- What Could Change This Ranking
- Satellite Data and Silver Mining Due Diligence
By 2025 silver output, the best silver mining stocks to study first are Fresnillo plc (47.6 million ounces), Pan American Silver (22.8) and Coeur Mining (17.9), followed by Hecla Mining, First Majestic Silver, Buenaventura and Endeavour Silver. The figures come from the World Silver Survey 2026 and company reports. “Best” here means largest verified output among the seven listed primary silver producers the survey reviews. It is a starting list for research, not a recommendation.
The price matters as much as the ranking. Silver traded at $52 an ounce at 7 a.m. Eastern on November 4, 2026, per Fortune, down from about $60.76 a month earlier and far below the all-time high above $121 set on January 29, 2026, per the Silver Institute. Below you will find the ranked list, third-quarter output for six of the seven, costs, the smaller names people search for, and a calculator that shows how a price fall hits a miner’s margin.
Best Silver Mining Stocks Ranked by Output
How we chose: the Silver Institute’s survey (prepared by Metals Focus) reviews seven listed primary silver producers as a peer group: Buenaventura, Coeur, Endeavour, Fresnillo, First Majestic, Hecla and Pan American. We rank those seven by 2025 silver output. The metric is ounces, not share performance, valuation or analyst opinion. A company can rank high here and still be a poor fit for you, because output says nothing about the price you pay for the shares.
Chart
Silver output of the seven primary producers
Million troy ounces, 2024 and 2025
| Rank | Company and ticker | 2025 silver (Moz) | Change on 2024 | Main mining countries |
|---|---|---|---|---|
| 1 | Fresnillo plc (LSE: FRES) | 47.6 | -12% | Mexico |
| 2 | Pan American Silver (NYSE, TSX: PAAS) | 22.8 | +8% | Mexico, Peru, Bolivia, Argentina, Chile, Brazil, Canada |
| 3 | Coeur Mining (NYSE: CDE) | 17.9 | +57% | US, Mexico, Canada |
| 4 | Hecla Mining (NYSE: HL) | 17.0 | +5% | US, Canada |
| 5 | First Majestic Silver (NYSE, TSX: AG) | 15.4 | +84% | Mexico |
| 6 | Buenaventura (NYSE: BVN) | 15.0 | +2% | Peru |
| 7 | Endeavour Silver (NYSE: EXK; TSX: EDR) | 6.5 | +45% | Mexico, Peru |
Moz means million troy ounces. Output for ranks 1 to 6 is from the survey company table; Fresnillo’s figure excludes the Silverstream contract. Endeavour’s is from its 2025 production release (6,486,661 ounces).
1. Fresnillo plc: the largest primary producer, with falling output
Best for: readers who want the largest primary silver miner. The company calls itself the world’s largest primary silver producer, and all eight of its operating mines are in Mexico, per the World Silver Survey. Strength: scale, plus large gold output. Weakness: one country, and lower grades (grade is the metal content per tonne of ore). Third-quarter 2026 attributable silver was about 10.3 million ounces, down 12% on the year, and 2026 guidance is 42.0 to 46.5 million ounces. See also our list of the largest primary silver producers.
2. Pan American Silver: the widest spread of mines
Best for: readers who want silver across many countries. Pan American took over MAG Silver on September 4, 2025, adding a 44% stake in Juanicipio, which Fresnillo operates. Strength: no single-country dependence, and a large gold business. Weakness: more moving parts. Third-quarter 2026 attributable silver was 6.07 million ounces, below its quarterly outlook on mine sequencing at Juanicipio and Cerro Moro, and it expects the low end of its 25 to 27 million ounce guidance. Silver-segment all-in sustaining cost, explained below, was $11.21 an ounce. Our earlier look at silver miners stock and ETF performance gives more background.
3. Coeur Mining: silver plus a lot of gold
Best for: readers comfortable with a mixed-metal producer. Coeur bought SilverCrest, owner of Las Chispas, in February 2025 and closed its New Gold takeover on March 20, 2026, adding Rainy River and New Afton in Canada. Strength: growth and metal mix. Weakness: silver is a minority of sales, at 27% of third-quarter 2026 revenue. Silver output that quarter was 4.2 million ounces, down 12% on lower Palmarejo grades.
4. Hecla Mining: the US-focused name
Best for: readers who want mainly North American mines. Hecla runs Greens Creek in Alaska, Lucky Friday in Idaho and Keno Hill in Yukon. The USGS names Alaska as the leading US silver-producing state. Weakness: few mines, so one mine’s problem shows quickly. Third-quarter 2026 silver was 4.2 million ounces, with Greens Creek above 1.9 million and a record 963,000 at Keno Hill; 2026 guidance is 15.3 to 16.1 million. Read more on the Lucky Friday mine and on Alaska mining companies.
5. First Majestic Silver: Mexico, with a recent labour stoppage
Best for: readers who want high silver weighting in one country. The 2025 jump came from buying Gatos Silver in January 2025, which holds 70% of Cerro Los Gatos. If you searched for Gatos Silver, that company no longer trades on its own. Weakness: Mexican concentration. Third-quarter 2026 silver was 3.4 million ounces, reaching 72% of its revised guidance midpoint after a labour dispute at San Dimas.
6. Buenaventura: Peru, with base metals alongside
Best for: readers who want Peruvian exposure. Its largest silver mine in the survey’s top-30 list is Uchucchacua-Yumpag, at 11.1 million ounces in 2025. Fresnillo and Buenaventura were the two largest payers of shareholder returns in the peer group in 2025, per the survey. Weakness: single-country dependence.
7. Endeavour Silver: the smallest here, and growing
Best for: readers who want a smaller producer. Terronera in Mexico reached commercial production on October 1, 2025, and Kolpa in Peru is newer in the portfolio. Third-quarter 2026 silver was 2,096,545 ounces, up 19% on the year and slightly below plan. Weakness: new mines still settling in, and less scale to absorb a poor quarter.
Latest Quarterly Silver Output by Company
Annual rankings lag. The chart in this section shows the most recent quarter these companies have reported, which is the fastest way to see whether a miner is tracking its guidance. Several of the largest names are running below last year: Fresnillo and First Majestic both reported lower silver, and Coeur reported a drop on lower grades, while Endeavour and Santacruz grew.
Chart
Silver output in Q3 2026, selected producers
Million troy ounces, as reported by each company
Compare guidance as well as output. Fresnillo’s nine-month total of 32.4 million ounces sits on track for its range. First Majestic at 72% of its midpoint after three quarters has less room. Reports use different bases, such as attributable ounces (the company’s own share of a mine) versus 100% of a mine, so check the footnotes before comparing.
Silver Stock Prices, Costs and Which Companies Are Profitable
All-in sustaining cost (AISC) is the usual cost yardstick: the cost of producing an ounce, plus the spending needed to keep a mine running, usually after deducting income from other metals. In 2025 the average AISC at primary silver mines was $12.21 an ounce against an average price of $40.03, leaving a margin of about $27.81. The survey estimates that 99% of primary silver production was profitable in 2025.
Chart
Primary silver mine AISC by region
US$ per ounce, 2025, by-product basis
Read that average with care. The survey credits much of the low figure to by-product income from record gold prices. A silver miner’s reported cost can therefore fall because gold rose, and rise again if gold falls. Company figures also differ: Pan American’s $11.21 and SSR Mining’s $25.64 at Puna are per silver or payable ounce, while First Majestic reported $25.68 for the second quarter per silver-equivalent ounce. These are not like-for-like numbers.
The money followed in 2025. Combined revenue across the seven peers rose 48% to $15.1 billion, per the World Silver Survey, and dividends reached $0.97 billion. But realised prices are already lower: Coeur’s average silver price fell to $62.22 in the third quarter of 2026 from $71.18 in the second, and the November 4 spot price was lower again. For a live silver stock price, use the exchange or your broker; for metal, use Kitco or CNBC. We do not print share prices because they would be stale within hours.
Silver Companies That Are Big but Not Pure Plays
Some of the world’s largest silver producers are not silver companies. Non-primary mines supplied 74% of 2025 output, because primary silver mines fell to a new low of 26% of supply. These miners get silver as a by-product of copper, gold, lead or zinc. Their shares follow those metals, so owning them is a weak way to follow silver. That is why they sit outside our ranking. The chart in this section shows a selection from the survey’s top-20 company table, including Southern Copper (NYSE: SCCO), Newmont (NYSE: NEM), KGHM (Warsaw: KGH), Glencore (LSE: GLEN), BHP (ASX, LSE: BHP) and Boliden (Stockholm: BOL). Polymetal, at 28.0 million ounces, is a Russian unit owned by Mangazeya (survey note).
Chart
Selected by-product silver producers
Million troy ounces, 2025
Smaller Silver Mining Stocks and Other Names People Search For
Smaller names can move far more than large producers in both directions, and their disclosure is thinner. These are not ranked: they either fall below the peer group or mix metals. Figures carry their own dates.
| Company | Listing | Stage | Latest figure |
|---|---|---|---|
| SSR Mining | Nasdaq, TSX: SSRM | Producer, mostly gold | Puna: 1.70 Moz silver, Q3 2026 |
| Silvercorp Metals | NYSE American, TSX: SVM | Producer, China | 1.5 Moz silver, quarter to March 2026 |
| Santacruz Silver Mining | TSXV: SCZ; Nasdaq: SCZM | Producer, Bolivia and Mexico | 1.50 Moz silver, Q3 2026 |
| Americas Gold and Silver | NYSE American: USAS; TSX: USA | Producer, US and Mexico | 2.65 Moz silver, 2025 |
| IMPACT Silver | TSXV: IPT | Small producer, Mexico | 635,778 oz silver, 2025 |
| Silver X Mining | TSXV: AGX | Small producer, Peru | Record revenue of C$13.4 million, Q1 2026 |
| Silver North Resources | TSXV: SNAG | Explorer, Yukon | Drilling at Haldane, August 2026 |
| Silver Mines Limited | ASX: SVL | Developer, Australia | Bowdens feasibility study near completion, July 2026 |
Two points need care. Silver Mines’ Bowdens project is not producing, and a New South Wales court voided its earlier planning approval; the application is being redetermined. And two names from older lists are gone: Pan American bought MAG Silver in 2025, while Great Panther Mining sold its Mexican mines and was delisted in 2022. For earlier-stage names, see silver exploration companies. Readers who want the ground itself can compare silver mines for sale.
Silver Mining Stocks vs Bullion and Silver ETFs
A share carries things metal does not: mine failures, strikes, taxes, permits and management decisions. It can also pay a dividend and grow output. Because costs are partly fixed, a miner’s margin moves by a larger percentage than the metal price, up or down. The calculator in this section shows that effect on your own numbers.
A miners ETF spreads single-company risk. The Global X Silver Miners ETF (SIL) listed a 0.65% expense ratio as of July 2026, per Pensions & Investments. It still holds miners, so it does not track the silver price directly. A bullion-backed fund or physical metal does track the price, with storage or fund costs and none of the mining risk.
Calculator
What does a silver price fall do to a miner’s margin?
Enter a company’s figures from its latest report.
- Margin after the fall (US$ million): 200.0
- Fall in margin for your price fall (%): 33.3
Example values only, not a benchmark or a forecast. Silver price is an input: example, use today’s price. Assumes cost stays fixed and ignores other metals, tax and hedging.
How to Compare Silver Stocks Before You Decide
- Confirm silver’s share of revenue in the latest report. Coeur’s 27% tells a different story from a primary producer’s.
- Compare AISC with today’s spot price, and check the cost basis: per silver ounce or per silver-equivalent ounce.
- Check output against guidance for the year to date.
- Read country risk mine by mine, including labour and permit issues.
- Check mine life from reserves. Reserves are the part of a deposit shown to be economic to mine; primary silver mine reserves fell slightly in 2025, per the Silver Institute.
- Value it. P/NAV compares market value with the estimated net asset value of the mines. A P/NAV for a feasibility-stage miner depends heavily on the assumed price and discount rate, so compare the assumptions, not just the ratio.
- For juniors, read cash, debt, share dilution and the technical report on the project.
Analyst targets on small silver miners often disagree because each analyst assumes a different silver price, restart date and financing. Treat any single target as one set of assumptions. We do not publish price targets or forecasts on this page.
▶ What AI tools in mining do, and who builds them · 3:52
Why Silver Prices Move: Industrial Demand vs. Investment Demand
Silver has two demand pools. Industry uses it for its conductivity, in electronics and solar cells; investors buy bars, coins and funds. USGS estimates that US use in 2025 was 25% electrical and electronics and 15% photovoltaics, with 18% in net physical investment and 14% in coins and medals. Those shares are for the US only.
Chart
Average silver price by year
US$ per troy ounce, London price
Supply has fallen short for five years. The survey puts the 2025 deficit at 40.3 million ounces and projects another deficit in 2026 of 46.3 million ounces. Still, the price has fallen hard since January, which shows that a deficit does not set the price from month to month. Investor flows can swamp it.
Global Silver Market Scale: Production, Price, Reserves
World mine output was 846.6 million ounces (26,331 tonnes) in 2025, up 3%. Mexico led with 172.9 million ounces, followed by Peru at 130.6 and China at 112.8, together about 49% of the total. USGS estimates 26,000 tonnes of output and 610,000 tonnes of world reserves, and US mine output of about 1,100 tonnes worth $1.4 billion. Simple division gives about 23 years of reserves at 2025 output, though new discoveries and price changes alter that figure.
The Largest Silver Mines Behind These Stocks
Shares are claims on specific mines. These are selected large mines owned by the producers and smaller companies above, from the Silver Institute mine list for 2025. Figures are for the whole mine, not each owner’s share. Our guides to the largest silver mines and silver regions in Mexico go further.
| Mine | Country | Owner | 2025 silver (Moz) |
|---|---|---|---|
| Juanicipio | Mexico | Fresnillo 56%, Pan American 44% | 17.6 |
| Saucito | Mexico | Fresnillo | 14.3 |
| Fresnillo | Mexico | Fresnillo | 11.8 |
| Uchucchacua-Yumpag | Peru | Buenaventura | 11.1 |
| Puna | Argentina | SSR Mining | 9.8 |
| Greens Creek | United States | Hecla | 8.7 |
| Cerro Los Gatos | Mexico | First Majestic 70%, Dowa 30% | 8.4 |
Silver Streaming and Royalty Companies
A streaming company pays a miner upfront and in return buys part of the future metal at a low fixed price. A royalty is a share of a mine’s revenue, often called an NSR (net smelter return) royalty. Neither company runs the mine, so it avoids most direct cost inflation, but it still depends on the operator’s output and on the metal price. Wheaton Precious Metals (NYSE, TSX, LSE: WPM) is one such company; it reported 1.6 million ounces of attributable silver from Antamina in the fourth quarter of 2025. It is outside our ranking because it does not operate mines. Check that a fund’s top holdings match what you expect before treating it as pure silver miners.
Common Mistakes When Reading Best Silver Stocks Lists
- Counting companies that no longer trade. Great Panther, MAG Silver and Gatos Silver still appear on older lists. Check the listing before anything else.
- Treating silver-equivalent ounces as silver. Silver-equivalent output converts gold, lead and zinc into silver at set ratios. Endeavour’s third-quarter 2026 total of 3.6 million silver-equivalent ounces includes 2.1 million ounces of actual silver.
- Comparing 100% mine output with company share. Juanicipio’s 17.6 million ounces belongs to two owners, and Cerro Los Gatos’ 8.4 million ounces is shared with Dowa.
- Reading a developer like a producer. A developer has no mine revenue. Its value rests on permits, financing and a study that may change.
- Using an old price. Silver moved from above $121 to about $52 in about nine months, so any margin figure needs a date beside it.
- Assuming a deficit means a rising price. Five deficit years did not stop the fall since January.
Licence owners and business owners can read these lists another way. Producers with falling grades and shrinking reserves may look for new ground, so company reserve trends can hint at which buyers or partners are active. That is a reason to ask, not a promise of a deal.
What Could Change This Ranking
- Fresnillo’s decline. At its guidance range it stays first, but the gap to the next producer depends on grades at Juanicipio and Saucito.
- Takeovers. Three of the seven changed sharply through deals in 2025 and 2026, so last year’s rank can mislead.
- By-product prices. Falling gold would raise reported silver costs even with no change at the mine.
- Labour and permits. San Dimas showed that 12 days of disruption can cut a quarter’s output.
Satellite Data and Silver Mining Due Diligence
Investors and owners can use satellite imagery to check what a report describes, such as pit growth, tailings and access roads, and to screen early-stage ground before fieldwork. It does not replace drilling. Farmonaut offers satellite mineral screening; its other pages cover carbon footprinting, product traceability, fleet management, loan and insurance verification, large-area land management and API developer docs.
▶ Remote sensing for mining in plain words · 2:01
Frequently asked questions
What are the best silver stocks to buy now?
No single stock is best for everyone, and this page gives no advice to buy. By 2025 output, the largest listed primary producers in the survey’s peer group are Fresnillo, Pan American Silver, Coeur Mining, Hecla, First Majestic, Buenaventura and Endeavour, per the Silver Institute and Endeavour.
What are the top 10 silver mining companies?
Counting all miners, the survey’s largest include Fresnillo, KGHM, Polymetal, Newmont, Southern Copper, Pan American, Glencore and Codelco. Most of these produce silver as a by-product. Our ranking keeps to the seven primary producers the survey reviews.
Which is the best silver company to invest in for pure silver exposure?
Check silver’s share of revenue. Fresnillo, First Majestic and Endeavour are often read as silver-weighted, yet all report gold or base metals too. Mixed producers such as Coeur earned 27% of third-quarter 2026 revenue from silver.
What is the silver price today?
Silver was $52 an ounce at 7 a.m. Eastern on November 4, 2026, per Fortune. It moves all day, so use a live quote before acting.
Which silver stock is based in the US?
Hecla Mining and Coeur Mining are US companies listed on the NYSE. Hecla’s mines are in the US and Canada, while Coeur also mines in Mexico and Canada.
What happened to Gatos Silver?
First Majestic completed its purchase in January 2025. Exposure to Cerro Los Gatos now comes through First Majestic, which holds 70%.
Why do analyst price targets disagree on small silver miners?
Each target rests on its own silver price, costs, timing and financing assumptions. Small companies with one mine or project are very sensitive to those inputs. Compare the assumptions, and read the filing.
What is a normal P/NAV for feasibility-stage silver miners?
There is no fixed norm. P/NAV depends on the assumed silver price, the discount rate and project risk, so a ratio is only comparable when those match. Developers usually have more risk than producers because the mine is not built.
Is a silver miner or a silver ETF lower risk?
A diversified ETF reduces single-company risk, but it still holds miners. A bullion-backed product avoids mine risk and keeps price risk. None of them removes the risk of a falling silver price.
Do silver miners pay dividends?
Some do. The seven peers paid $0.97 billion in 2025, per the World Silver Survey. Coeur also announced a first dividend policy in early 2026. Payouts can change with prices.
Where is most silver mined?
Mexico, Peru and China produced about 49% of 2025 mine output, per the Silver Institute.
This page is for information only. It is not investment advice. Rankings show output, not expected returns.
Farmonaut mining
Screen a silver project area from space
Investors and owners can request a quote for satellite exploration screening of a licence area before committing to fieldwork.
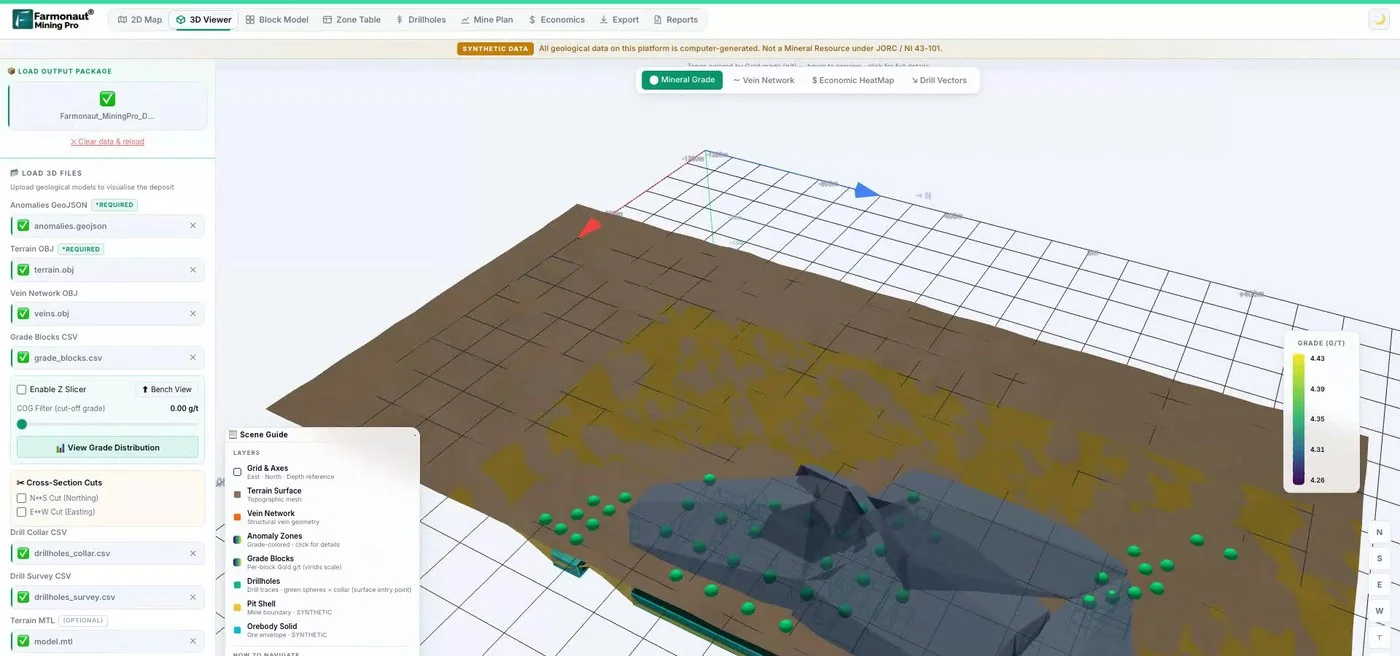
Mining Pro sample view, synthetic data
Keep reading
Sources
- Silver Institute / Metals Focus, World Silver Survey 2026: silverinstitute.org
- USGS, Mineral Commodity Summaries 2026: Silver: pubs.usgs.gov
- Fortune, Current price of silver, November 4, 2026: fortune.com
- Pan American Silver, Q3 2026 results (SEC Form 6-K): sec.gov
- Coeur Mining, Q3 2026 results (SEC Form 8-K): sec.gov
- Fresnillo plc, 3Q26 production report: investegate.co.uk
- First Majestic, Q3 2026 production results: finviz.com
- Hecla Mining, Q3 2026 results (SEC Form 8-K): sec.gov
- Endeavour Silver, Q3 2026 production: finviz.com
- Endeavour Silver, 2025 production release: edrsilver.com
- Santacruz Silver, Q3 2026 production (SEC Form 6-K): sec.gov
- SSR Mining, Q3 2026 results (SEC Form 8-K): sec.gov
- Americas Gold and Silver, 2025 production: americas-gold.com
- IMPACT Silver, 2025 results: impactsilver.com
- Mining Reporters, Silver X Q1 2026: miningreporters.com
- Stockwatch, Silver North Resources, August 2026: wwww.stockwatch.com
- Silver Mines Limited, ASX update, July 2026: bulletin.webull.com
- Mudgee Guardian, Bowdens court decision: mudgeeguardian.com.au
- Pensions & Investments, SIL fund data: etf.pionline.com
- Pan American Silver, MAG Silver acquisition: panamericansilver.com
- Coeur, SilverCrest acquisition: coeur.com
- First Majestic, Gatos Silver acquisition: newsfilecorp.com
- Wheaton Precious Metals, 2025 results: finviz.com
- Silvercorp, fiscal 2026 production: finviz.com
- Kitco, silver chart: kitco.com
- CNBC, silver futures quote: cnbc.com
Discussion
Questions, corrections or field experience? Share them below. First-time comments are reviewed before they appear, and your email is never published.
No comments yet. Be the first to add a question or your experience.

 VRV Global Pte Ltd
 Omsri International FZE
 G.I.T.T.
 Jaunita Erss Ltd
 Almosi SARL
 SRK Consulting
 Berks Gold Limited
 Mwerezi Minerals Company Limited
 Mining SARL
 SenGold Invest SAS
 Sean Mining Limited
 NTS Group (Pty) Ltd
 Mine4Africa
 Lithspo Minerals Limited
 Tintina Mining Group

 Licence holder · Nigeria · Gold + lithium










