

Reviewed August 2026 against USDA/Virginia Tech Global Agricultural Productivity Initiative, Nature Scientific Reports, and UK Defra.
Agriculture data management is the systematic collection, storage, integration, and analysis of farm-level data — soil, weather, machinery, and satellite feeds — combined into a single decision layer so that irrigation, fertilizer, and labor get applied where they actually help. It is not a single tool. It is the practice of connecting the sensors and satellites you already have access to with a system that turns their readings into a scheduling or spending decision. The rest of this article shows what that looks like in measured outcomes, not marketing language: 12% of US farms currently use soil moisture sensors for irrigation timing, water savings from decision-support systems have been measured at 14–50% depending on delivery method, and Europe’s precision-farming market is projected to reach €6.3 billion by 2032.
Table of Contents
- What Agriculture Data Management Actually Means
- The Adoption Numbers: Who’s Actually Using This
- Data Collection: Sensors, Weather Stations, and Fleet Telemetry
- Precision Mapping: GPS and Geospatial Data
- Satellite Imagery and Drone Data
- Data Processing and Farm Data Integration
- Predictive Analytics: What the Water-Savings Studies Actually Show
- Automated Application and Fleet Data
- Blockchain, AI, and Traceability
- Comparison Table: Method, Measured Result, Source
- Irrigation Water-Savings Calculator
- Where the Public Data Runs Out — and How to Fill the Gap Yourself
- A Working Checklist for Setting Up Data Management on Your Own Operation
- Farmonaut’s Role in This Chain
- Subscription & API Access
- Frequently Asked Questions
- Conclusion
- Try it: Estimated results
What Agriculture Data Management Actually Means
Strip away the vendor language and data management in agriculture reduces to five steps repeated every season: collect (sensors, satellites, machinery logs), store (a database or cloud platform that can hold time-series data), integrate (merge formats so a soil reading and a satellite pixel refer to the same field location), analyze (turn readings into a threshold or forecast), and apply (irrigation, fertilizer, or labor gets scheduled from that output). Skip the integration step and you get five separate spreadsheets nobody opens after week two — that is the single most common failure mode reported by extension services and technology adoption studies alike.
The measurable case for doing this properly rests on a small number of independent studies, not a single vendor claim. A 2025 Nature Scientific Reports study of a participatory irrigation decision-support rollout in the Lake Urmia Basin measured 41% water savings with drip irrigation decision support and 14% water savings with sprinkler-based decision support versus uncontrolled scheduling — two different delivery methods, two different results, both from the same trial.1 A separate USDA-coordinated Virginia Tech field programme measured a 25% average yield improvement from smart irrigation systems and a 20% fertilizer cost reduction from variable-rate application on the US farms it tracked.2
The Adoption Numbers: Who’s Actually Using This
Only 12% of US farms currently use soil moisture sensors to schedule irrigation, according to the USDA/Virginia Tech Global Agricultural Productivity Initiative’s partner-reported field data.2 That is the clearest published adoption figure for the US market at field level, and it explains the gap between what the technology can do and what most operations are actually doing: the tools that produce 25–50% water and yield improvements are sitting unused on 88% of American farms.
In the UK, Defra’s ADOPT Fund committed £2.3 million in December 2025 specifically to run 30 farms through trials of precision machinery, IoT sensors, and digital farm-management tools under the Rural Innovation Programme.3 That is a trial cohort, not a national adoption survey — Defra’s own Farmer Opinion Tracker, the closest thing to a UK-wide digital-adoption baseline, was last updated in October 2022 and has not been refreshed since, so there is currently no recent published percentage for UK-wide digital farm tool adoption. If you need that figure for a specific report, the correct move is to check Defra’s statistics page directly rather than rely on a number that is now several years stale.
On market size rather than adoption rate, Europe’s precision-farming market is projected to reach €6.3 billion by 2032, based on aggregated 2024–2032 forecasts.4 Market size and adoption rate are not the same statistic — a market can grow because a small number of large operations spend more, while the share of individual farms actually using the tools stays flat. Treat the €6.3 billion figure as a spending trajectory, not evidence that most European farms have adopted data management. No France- or EU-28-specific adoption percentage broken out by farm count has been published in the sources checked for this article; Eurostat’s agricultural input cost surveys and France’s INSEE release relevant national figures around Q2 each year, so that is where to look for an update.
Data Collection: Sensors, Weather Stations, and Fleet Telemetry
Everything downstream depends on what gets measured in the field. Three categories of hardware do almost all of the work:
Key Data Collection Tools & Technologies
- Soil Moisture Monitoring Sensors: Embedded across a field, these track soil moisture, nutrient content, and micro-climate variation, feeding the irrigation and fertilizer timing decisions covered in the sections below. Only 12% of US farms have these deployed for irrigation scheduling today, which is the single largest headroom opportunity in this list.2
- Weather Stations & Environmental Sensors: Field-level temperature, humidity, rainfall, and wind speed readings that let a farm anticipate frost, disease pressure, and spray-window closures before they arrive rather than after.
- Smart Equipment and Fleet Data: Sensors built into planters, sprayers, and harvesters capture machinery performance, planting density, and pass-by-pass field coverage as the equipment operates.
Collected in isolation, none of these three data streams changes an outcome — a soil moisture reading that never reaches an irrigation controller is just a number on a screen. The productivity gains cited throughout this article all come from studies where the sensor data was piped into a decision system, not from sensor deployment alone.
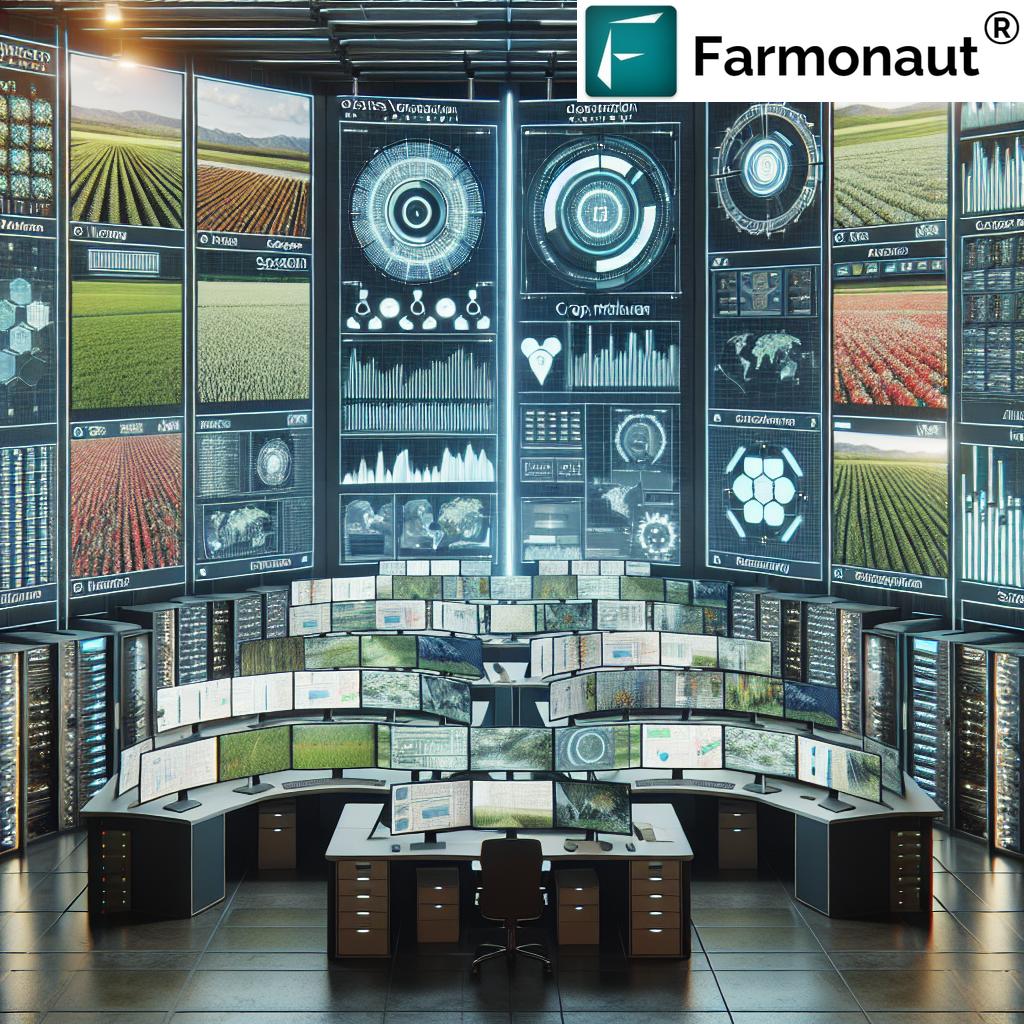
Where Satellite Data Fits
Farmonaut’s platform pairs soil moisture-style monitoring with satellite imaging to give both smallholders and large operations the same underlying data stream without requiring an in-field sensor network on every acre — relevant given how few farms currently have physical sensors installed.
Precision Mapping: GPS and Geospatial Data
GPS and geospatial mapping solve a different problem than sensors do: they tell you where in a field a condition applies, not just that it applies. This is what makes variable-rate application possible — the 20% fertilizer cost reduction from variable-rate technology cited above depends entirely on knowing which zones of a crop field need more or less input.2
- Global Positioning System (GPS): Enables exact location tracking and zone mapping within a field, so treatments target specific coordinates instead of the whole area.
- Geospatial Mapping: Maps built from GPS and sensor data reveal soil variability, crop health differences, and yield boundaries at the sub-field level.
The practical effect: a US corn operation using GPS-guided variable-rate fertilizer application spends less per acre on nitrogen while maintaining yield across the field’s weaker zones, rather than applying a flat rate everywhere and overpaying on the better-draining ground.

Satellite Imagery and Drone Data
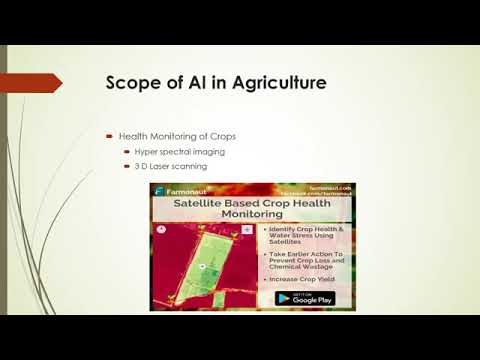
High-resolution satellite imagery for agriculture, combined with unmanned aerial vehicle (UAV) and drone passes, gives a field-wide view that no ground sensor network can match for coverage. Multi-spectral imagery identifies:
- Crop health status via NDVI and related vegetation indices
- Growth pattern anomalies across a field
- Pest infestation zones and water-stress areas
- Soil texture or structural changes between growing seasons
Farmonaut uses multispectral satellite images to monitor crop and soil parameters remotely, replacing manual field scouting with a systematic, repeatable data feed. This matters most for the farms without ground sensors — the 88% not yet using soil moisture sensors still get a usable proxy signal from satellite NDVI trends, even without hardware in the ground.
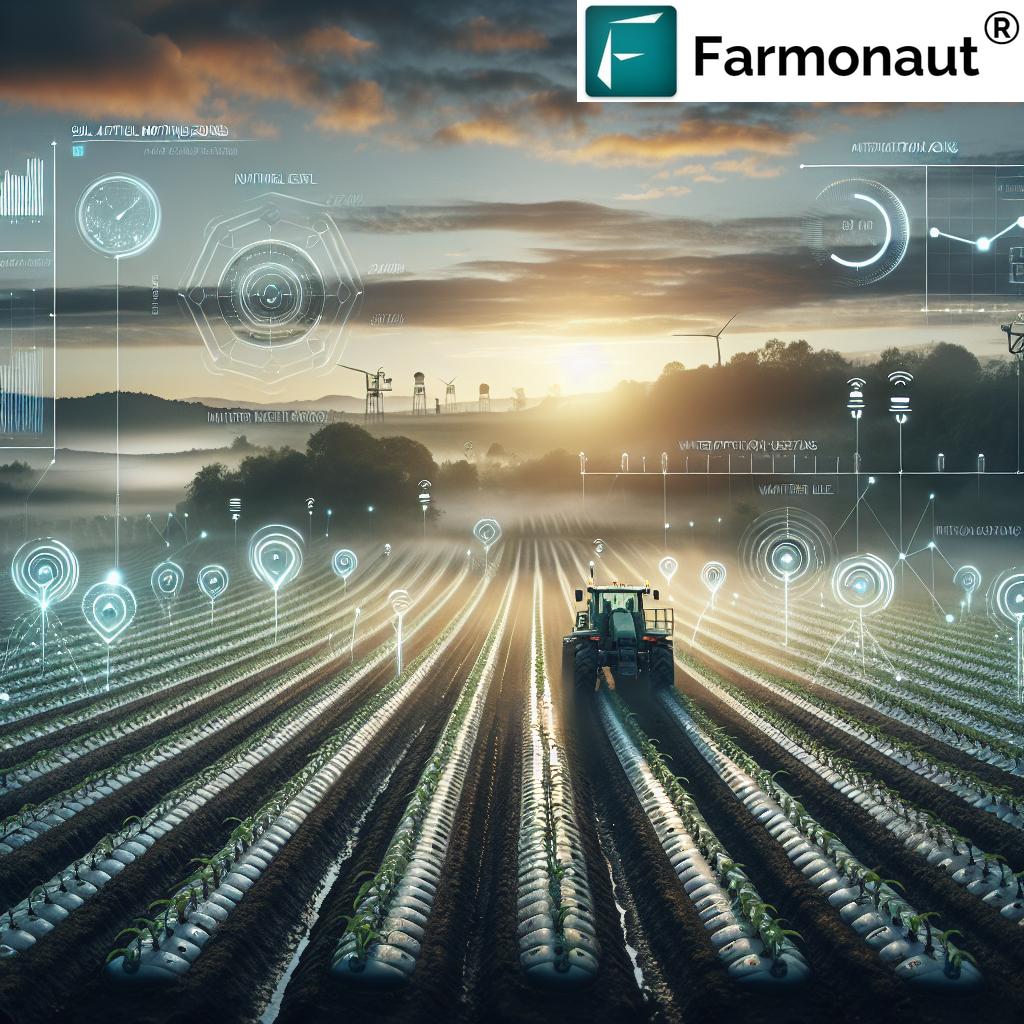
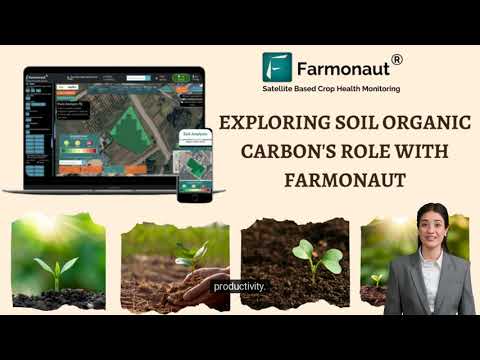
Farmonaut’s carbon footprint tracking uses this same satellite and AI data stream to help agribusinesses monitor environmental impact — a component of socially responsible agriculture programmes that increasingly require this kind of documentation for buyer or regulatory compliance.
Data Processing and Farm Data Integration
Collection generates volume; integration is what makes the volume usable. Two steps determine whether a farm’s data actually drives decisions or just accumulates:
Data Cleansing and Integration
- Data Cleansing: Removes sensor errors, duplicate readings, and out-of-range values before they corrupt an irrigation or fertilizer model’s output.
- Farm Data Integration: Combines sensor outputs, satellite imagery, and machinery logs into one dashboard so a soil reading and a satellite pixel reference the same physical location and date.
Edge Computing for Real-Time Alerts
Processing data closer to its source — edge or fog computing — cuts the delay between a sensor reading an anomaly and a farm manager seeing an alert, compared with routing everything through a centralized cloud platform first. For an irrigation trigger or a pest outbreak, that delay difference is the gap between catching a problem in its first day and catching it a week later.
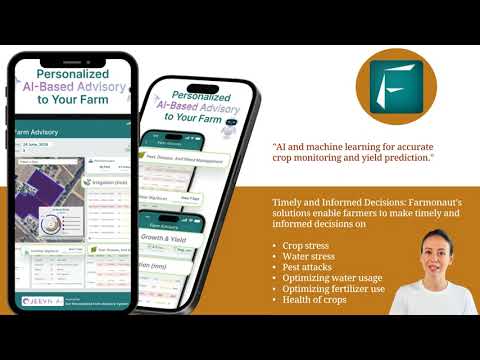
For farm-to-report data flows, Farmonaut’s API integrates satellite and weather data directly into existing farm management systems, and developers can work from the API developer docs to build custom integrations rather than relying on a single vendor dashboard.
Predictive Analytics: What the Water-Savings Studies Actually Show
“Predictive analytics” gets used loosely; the actual mechanism is straightforward. Historical and real-time data (weather, soil, past yields) feed a model that outputs a forecast — a yield estimate, an irrigation trigger, or a disease-risk score — early enough that a farm can act on it instead of reacting after the fact.
The clearest published numbers on this come from irrigation, where outcomes are easiest to measure against a control. The 2025 Nature Scientific Reports Lake Urmia Basin study found 41% water savings from drip irrigation decision-support systems and 14% water savings from sprinkler-based decision support against uncontrolled scheduling in the same trial.1 Separately, an NCBI-indexed peer-reviewed agricultural engineering study measured a 35% yield increase with IoT-based irrigation compared with traditional scheduling.5 A separate synthesis of 2024–2025 irrigation case studies puts real-time IoT-based scheduling water savings as high as 50% in the best-performing deployments.
Three different numbers — 41%, 14%, 35%, 50% — from different study designs and delivery methods is not inconsistency; it is the honest range. Drip systems paired with decision support save more water than sprinkler systems paired with the same decision support, because drip already wastes less to begin with, so the decision layer has less slack to recover. Read any single percentage in a vendor pitch with that in mind, and ask which irrigation method and which control group produced it.
Automated Application and Fleet Data
Automation converts a data-driven decision into a physical action without a human re-entering the numbers by hand. Three machine categories carry this out:
- Seeders and Planters: Use soil sensor and topographic data to vary seeding density across a field automatically.
- Automated Sprayers & Spreaders: Use GPS and real-time sensing to cut overlap and apply inputs only where a field’s data indicates a need — the mechanism behind the 20% fertilizer cost reduction figure cited earlier.2
- Harvesters and Yield Mapping: Record yield data pass-by-pass through a field, showing which zones under- or over-performed for the next season’s input plan.
Farmonaut’s dashboard supports real-time fleet management, tracking vehicle usage and coverage so operations can identify idle equipment time and coverage gaps directly from the data rather than from a manager’s memory of the day.
Blockchain, AI, and Traceability
The furthest end of the data-management chain is what happens to farm data after harvest — proving where a crop came from and how it was grown. Two mechanisms handle this:
- AI for Multi-Source Analysis: AI systems combine satellite, sensor, and weather feeds to surface patterns a single data stream would miss. Farmonaut’s Jeevn AI advisory system works this way, generating recommendations from satellite and environmental data together rather than either source alone.
- Blockchain-Based Traceability: Records each stage of a crop’s path from planting to sale, giving buyers and regulators an auditable record rather than a paper trail that can be lost or altered.
Farmonaut’s blockchain-based traceability solutions apply this record-keeping model to support transparent supply chains for export-facing operations that need to document origin and handling to a buyer or certifier.
Comparison Table: Method, Measured Result, Source
| Method | Measured Result | Study / Region | Source |
|---|---|---|---|
| Drip irrigation decision-support system | 41% water savings vs. uncontrolled scheduling | Lake Urmia Basin, 2025 | Nature Scientific Reports |
| Sprinkler irrigation decision-support system | 14% water savings vs. uncontrolled scheduling | Lake Urmia Basin, 2025 | Nature Scientific Reports |
| IoT-based irrigation vs. traditional scheduling | 35% yield increase | Peer-reviewed field case study | NCBI / PMC8235149 |
| Real-time IoT irrigation scheduling | Up to 50% water savings | 2024–2025 case study synthesis | Arable irrigation research synthesis |
| Soil moisture sensor adoption | 12% of US farms | Current, US | USDA / Virginia Tech GAP Initiative |
| Variable-rate fertilizer application | 20% cost reduction | US farms, demonstrated | USDA / Virginia Tech GAP Initiative |
| Smart irrigation systems, average yield gain | 25% | 2023–2025, US | USDA / Virginia Tech GAP Initiative |
| Europe precision-farming market size | €6.3 billion projected | By 2032 | Reports & Reports |
| UK Defra ADOPT Fund farm tech trials | £2.3 million across 30 farms | December 2025 | UK Defra Rural Innovation Programme |
Notice what is missing from this table on purpose: a per-acre income figure and an EU/France-specific adoption percentage. Neither has been published in a source checked for this article — see the gaps section below for exactly where to look for them yourself.
Irrigation Water-Savings Calculator
This calculator applies the drip and sprinkler water-savings percentages measured in the Lake Urmia Basin study above to your own field size and water cost, so you can see what a decision-support system would be worth on your specific operation rather than a generic average.
Estimated results:
Assumptions: applies the exact drip (41%) and sprinkler (14%) water-savings percentages measured in the Lake Urmia Basin decision-support study to your entered water use and local cost per 1,000 gallons. It does not account for crop type, climate zone, soil water-holding capacity, equipment installation cost, or regional water-rights restrictions — use it to size the opportunity, not to budget a specific project.
Where the Public Data Runs Out — and How to Fill the Gap Yourself
Five figures that would strengthen this article further are not currently available in published sources, and it is more useful to name them than to guess:
- France/EU-28 farm-level adoption rate for data management software: market size (€6.3 billion by 2032) is published, but the share of individual farms actually using these tools is not broken out by country. Check Eurostat’s annual agricultural input cost survey and France’s INSEE agricultural statistics, both of which typically update around Q2 each year.
- US farm income impact in dollars per acre: yield and water-savings percentages are documented above, but a direct income-per-acre or income-per-farm figure was not found in the sources checked. The USDA Agricultural Resource Management Survey (ARMS) is the most likely source — it runs on a roughly two-year release cycle, with the next full dataset expected around August 2027.
- Average software subscription cost: no US or EU average pricing for farm data management platforms was found in publicly accessible sources; the figures that exist are behind market-research paywalls. Request a quote directly from vendors for a comparable figure.
- Multi-year adoption trend (2020–2026): only single-year snapshots (12% US soil sensor adoption; €6.3 billion EU market by 2032) are available; a historical adoption curve was not found. USDA ARMS historical releases are the most likely source for a US trend line once published.
- UK farm-level digital adoption baseline: Defra’s ADOPT Fund trial cohort (30 farms, £2.3 million, December 2025) is documented, but a current UK-wide baseline adoption percentage is not — Defra’s Farmer Opinion Tracker, the closest prior source, was last updated in October 2022. Check Defra’s statistics page for a more recent release before citing a UK-wide figure.
If your own report needs one of these five numbers, that is the specific agency and survey to check — not a rounded estimate carried over from a different market.
A Working Checklist for Setting Up Data Management on Your Own Operation
This is the part of the article that does not go stale: the sequence below works regardless of which year’s adoption percentage or market-size figure is current when you read it.
- Inventory what you already generate. Most farms already produce machinery logs, weather records, and at least some satellite-visible field history before buying anything new.
- Pick one decision to improve first. Irrigation timing has the best-documented payoff range in this article (14–50% water savings) — start there rather than trying to instrument everything at once.
- Match the sensor to the irrigation method. The Lake Urmia data shows drip systems paired with decision support outperform sprinkler systems paired with the same software (41% vs. 14%) — know which method you’re running before you budget for the software layer.
- Insist on one integration point. A soil reading, a satellite pixel, and a machinery log entry all need to resolve to the same field location and date, or the “insights” are just three disconnected charts.
- Re-check your baseline every season. Publish-cycle data (USDA ARMS, Eurostat, Defra) updates on a fixed schedule, not continuously — note the vintage of every number you’re relying on and its next scheduled refresh, as flagged throughout this article.
- Verify before you scale. Run the improved method on a subset of fields for one season, measure against a control the way the Nature Scientific Reports study did, before committing the whole operation.
Farmonaut’s Role in This Chain
Farmonaut provides the satellite-based layer of this chain rather than the physical sensor hardware, which makes it relevant specifically for the 88% of US farms and the majority of European and UK operations not yet running ground-based soil moisture sensors. Core services include:
- Real-time Crop Health Monitoring: Multispectral satellite images for vegetation and soil analysis
- Jeevn AI Advisory System: Personalized crop management recommendations from satellite and environmental data
- Blockchain-Based Traceability: Transparent supply chains for food and agricultural export industries
- Fleet & Resource Management: Logistics optimization for planting, harvesting, and input delivery
- Carbon Footprinting: Environmental tracking to support sustainability reporting
Who Uses This Kind of System
- Individual Farmers: Data-driven decision tools delivered through mobile apps
- Agribusinesses: Large-scale plantation management and organizational dashboards
- Governments & NGOs: Remote crop assessment, yield estimation, and distribution planning
- Financial Institutions: Satellite-based farm verification for crop loan & insurance
- Corporate Clients: Traceability solutions for supply chain transparency
Access Farmonaut from Anywhere



Subscription & API Access
Farmonaut runs on a subscription pricing model for farmers, cooperatives, agribusinesses, and governments, with feature and data-frequency tiers to match operation size.
To extend Farmonaut’s satellite and weather data into an existing farm management system, integrate with the Farmonaut API — see the API documentation for technical details.
Frequently Asked Questions
-
What is agriculture data management?
The systematic collection, storage, integration, analysis, and application of farm data — sensor, satellite, weather, and machinery — to drive irrigation, fertilizer, and operational decisions rather than leaving them to habit or guesswork. -
What percentage of farms currently use this kind of system?
In the US, 12% of farms use soil moisture sensors for irrigation scheduling, per USDA/Virginia Tech Global Agricultural Productivity Initiative data. A comparable adoption percentage for France, the EU-28, or the UK has not been published in the sources checked for this article — see the gaps section above for where to look. -
How much water can irrigation decision-support software actually save?
A 2025 Nature Scientific Reports study measured 41% savings with drip irrigation decision support and 14% with sprinkler-based decision support against uncontrolled scheduling. Separate case-study synthesis puts real-time IoT scheduling savings as high as 50% in the best-performing deployments. -
Does variable-rate application actually reduce costs, or is that a marketing claim?
USDA/Virginia Tech field data shows a 20% fertilizer cost reduction from variable-rate application technology on US farms — a demonstrated result, not a projection. -
How big is the market for this technology in Europe?
Aggregated market research projects Europe’s precision-farming market to reach €6.3 billion by 2032. That figure describes market spending, not the share of farms that have adopted the technology. -
What makes Farmonaut different from a ground-sensor network?
Farmonaut delivers satellite-based crop and soil monitoring plus AI advisory and blockchain traceability through web, Android, and iOS apps and an API — useful specifically for operations that have not yet installed physical soil sensors. -
Where can I find more recent figures than the ones in this article?
USDA ARMS (roughly two-year cycle, next full release around August 2027), Eurostat and France’s INSEE (annual, typically mid-year), and UK Defra’s statistics page (irregular; the last farmer digital-adoption tracker update was October 2022) are the primary sources this article draws from — check them directly for the current figure.
Further reading:
Conclusion
The measured numbers, not the marketing framing, are the case for agriculture data management: 12% US soil-sensor adoption leaves most of the water and yield gains documented here — 14–50% water savings, up to 35% yield increases, 20% fertilizer cost reductions — still on the table for the majority of farms. Europe’s €6.3 billion projected market and the UK’s £2.3 million ADOPT Fund trial cohort show the investment is accelerating even where the adoption percentage itself is not yet published.
The checklist in this article — inventory, pick one decision, match sensor to method, integrate to one location key, re-verify your baseline each season — does not expire when next year’s adoption survey comes out; only the percentages do. Platforms like Farmonaut lower the entry cost for the satellite side of that chain, letting an operation start before it has budgeted for ground sensors at all.

 AgroStar
 Native Seeds
 Andex
Andex FCF India
 Unifrutti Gulf
 Deluxe Conseil
 TVS Electronics
 BW Pipelines
 WICO
WICO Gen Chayat
 Chimera Innovation
 SkyHarvest
 Polaris Digitech
 Teledarbas
 Wild Oak Farm
