

Farm technology · Management guide
Agriculture Technology Management: Costs, Data, Staff
Managing farm technology means choosing, paying for, running and reviewing each tool. USDA NASS found 22% of US farms used precision agriculture in 2025, down from 27% in 2023. Costs, data ownership, connection and staff decide the result.
Key takeaways
- 22% of US farms used precision agriculture practices in 2025, against 27% in 2023 (USDA NASS, August 2025).
- Guidance replacement averaged $20,165 on 2018 soybean farms and $25,168 on 2019 cotton farms. Yearly fees are extra (USDA ERS, 2023).
- 85% of US farms had internet access in 2025, and about 47% of all farms used broadband (55% of those with access; USDA NASS, our calculation).
- Read the data contract: farmers should own their data and be able to export it (Ag Data Transparent principles, 2024).
- Test one tool on one field for a season, name one owner for it, and compare with an untouched strip.
In this article
- What agriculture technology management means
- How many farms use farm technology today
- Where the connection is the weak link
- Match the tool to the job before you buy
- What technology really costs a farm
- Check the payback before you buy
- Who owns your farm data
- Repair, service and support
- Staff and skills
- A 90-day rollout plan
- How to run each technology after you buy it
- How to tell if a tool worked
- Questions to ask a seller
- Mistakes that waste the money
Agriculture technology management is the job of choosing, paying for, running and reviewing the digital tools on a farm. In the US, 22% of farms used precision agriculture practices in 2025, down from 27% in 2023 (USDA NASS, August 2025), so owning a tool and getting value from it are different things. This guide covers the four parts that decide the result: which tool for which job, what it really costs, who owns the data, and who runs it.
It also has a payback calculator you can fill in with your own numbers, charts from USDA surveys, and a 90-day rollout plan. It is written for farm owners, managers and agtech teams in the US, Canada, Europe and Australia.
What agriculture technology management means
Buying a machine or an app is a single event. Managing it is a cycle with four jobs.
- Choose: match a tool to one clear problem, such as overlap in the field, uneven fertilizer use or late pest scouting.
- Fund: count the purchase price, yearly fees, repairs and training, not only the sticker price.
- Run: decide who collects the data, who reads it and who acts on it.
- Review: after a season, compare the result with the cost and keep, change or drop the tool.
The US Government Accountability Office lists three recurring problems: up-front costs, worries about data sharing and ownership, and a lack of standards so that different tools work together (GAO-24-105962, January 2024). Those three are management problems more than technology problems, and they shape the sections below.
How many farms use farm technology today
USDA’s National Agricultural Statistics Service asks farms every two years. In 2025 it found that 22% of US farms used precision agriculture practices to manage crops or livestock, against 27% in 2023. NASS counts every farm with $1,000 or more of agricultural sales, including small ones. ERS found that adoption rises with farm size, so large row-crop farms are likely higher.
The chart shows the change for the main row-crop states and two others. Among the states shown, the falls ranged from 7 points (North Dakota) to 16 points (California), and the table does not say why. Texas went the other way.
Chart
Farms using precision agriculture, selected states
% of farms, USDA NASS Technology Use survey; selected states plus US

▶ Smart agriculture explained: from pest control to GIS and remote sensing. · 14:45
Where the connection is the weak link
Most tools need a signal. The same NASS survey found that 85% of US farms had internet access in 2025. Of those, 55% used broadband and 74% used a cellular data plan, which works out to about 47% and 63% of all farms (our calculation from the NASS table). If your fields have patchy coverage, favour tools that store data on the device and sync later, and ask any seller what happens offline.
Canada shows a different picture. In its 2021 Census of Agriculture, Statistics Canada reported that use of automated guidance steering rose 28.2% and GIS mapping 58.6% between 2015 and 2020. Those are growth rates in use, not shares of farms.
Chart
What US farms have to get online and compute
% of all US farms, 2025; broadband and cellular are our calculation from NASS shares of farms with internet access (55% and 74% of 85%)
Match the tool to the job before you buy
Start with the problem, then pick the tool. The table lists seven technologies covered in this guide and the evidence we found for each. “Evidence” means a public, dated source; where we found none for a claim, the table says so rather than quoting a percentage.
| Tool | Job it does | What the evidence shows |
|---|---|---|
| GPS guidance | Cuts overlap and skips | Used on well over 50% of corn, cotton, rice, sorghum, soybean and winter wheat acres (USDA ERS, 2023) |
| Yield maps, VRT | Shows variation, varies inputs | 5% to 25% of winter wheat, cotton, sorghum and rice acres (USDA ERS, 2023) |
| Satellite imagery | Spots field variation early | Texas A&M is testing drone and satellite tools with 11 cotton producers (AgriLife, 2026) |
| Soil and weather sensors | Guides irrigation timing | No single public figure for savings; test on one field |
| AI analytics | Turns data into advice | GAO notes few tools exist to turn farm data into decisions (2024) |
| Drones | Scouting and spraying | Rules and costs vary by country; check local aviation law |
| Vertical farming | Indoor crop production | Different business from field farming; see our related page |
The USDA Economic Research Service reports that automated guidance is now used on well over 50% of planted acres of corn, cotton, rice, sorghum, soybeans and winter wheat, while yield maps, soil maps and variable rate technology cover only 5% to 25% of winter wheat, cotton, sorghum and rice acres (EIB-248, February 2023; ARMS data to 2019). Guidance is easy to use: the machine steers and the benefit shows up as fewer passes. Mapping tools need someone to read the map and change what the machine does. That is the step to plan for.
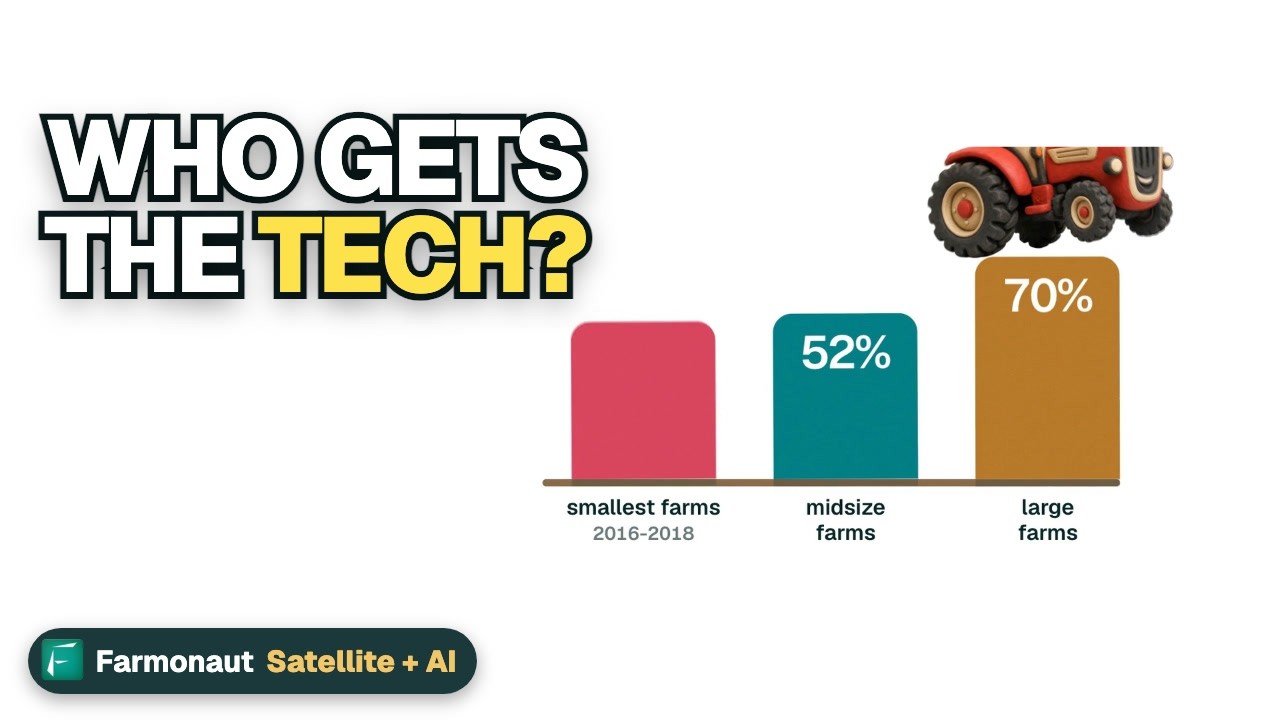
Scale matters too. The same report found that at least half of relatively large row-crop farms use yield maps, soil maps, VRT or guidance, while less than 25% of the smallest farms do, except for cotton. Small farms can still gain, but they should expect to pay for each tool across fewer acres.
Pick one problem, one field, one season
Test a new tool on a single field or machine. Write down the result you expect before you start, for example “fewer overlapped passes” or “irrigation one day later”. Without a stated goal you cannot tell at the end whether it worked.
▶ Seven green farming technologies ranked in a short explainer. · 2:24
What technology really costs a farm
ERS used the USDA farm survey to price precision tools. The costs are averages from 2018 soybean and 2019 cotton operations, so today’s prices will differ. Add the yearly fees to the purchase price when you compare quotes.
Chart
Average cost of precision tools
US$ per operation; replacement cost, premium or yearly fee
Replacing a guidance system cost $20,165 on soybean farms in 2018 and $25,168 on cotton farms in 2019, and yield monitors cost $8,051 and $13,775. Yearly subscription fees added about $1,000 to $1,800 for yield monitors and about $1,154 for guidance on soybean farms. The report notes that fees are usually the “gain codes” that switch on a machine’s features.
What might you get back? Iowa State measured two central Iowa farms without precision tools in 2011. Across more than 2,500 acres, overlap averaged 3.3% at planting and 7% in spring tillage, and the researchers put the tillage saving at about $1 an acre (Iowa State, 2012 prices). Overlap is the part guidance removes. The size of the gain is a measured number for a place and a year, not a promise for your farm.
Results also depend on the setup. A USDA Agricultural Research Service study of pasture scenarios found that tractor guidance was estimated to raise production by 2.7% to 6.5% (with high uncertainty) but also raised fuel use in that model, and it estimated that about a 5% yield gain would be needed to make guidance pay off environmentally (Ashworth and others, 2022).
Check the payback before you buy
Use the calculator to turn a quote into a yearly cost and a break-even saving per acre. Then ask whether a saving of that size is believable on your own fields.
Try the numbers for your own farm below.
Calculator
What must a tool save per acre to pay for itself?
Enter your own quote and acres. Results update as you type.
- Yearly cost of the tool: $4,000
- Break-even saving per acre: 4.00
- Expected yearly saving: $4,000
Example values only, not a benchmark or a forecast; use your own quote and today’s prices. Equipment cost is spread evenly over its life; fixed in the formula.
Who owns your farm data
Every tool produces data: yield, soil, machine, weather and field boundaries. Before you sign, read what the provider may do with it. The Ag Data Transparent principles, first set in 2014 with the American Farm Bureau Federation and updated in 2024, say that farmers should own data from their operations and should be able to retrieve it for use on other platforms. They also ask providers to use simple contracts and to explain what happens to your data when you stop using the service.
- Who owns it? The contract should say the farm does.
- Can you export it? Ask for a sample file in a common format before you pay.
- Who else sees it? The principles ask providers to name partners and affiliates.
- What happens at the end? Ask how and when your data is deleted.
- Is it backed up? Keep a yearly copy of key records yourself.
Data tools also produce a lot of images and maps that nobody reads. Pick the one or two numbers that drive a decision, such as a vegetation index map before a fertilizer pass, and ignore the rest.
Repair, service and support
A tool that is down during planting costs more than its fee. In July 2026 the Federal Trade Commission settled with John Deere in a case filed in January 2025; the settlement requires Deere to make diagnostic and repair tools available to equipment owners and independent shops, with the order awaiting court approval (Farm Policy News, University of Illinois, July 2026). Even so, ask every seller about local service, response time and software update terms before you buy.
Staff and skills
Technology changes the work more than it removes it. In the ERS sample of corn fields in 10 Midwestern states, labour hours per acre were 50% lower for users of yield and soil maps, 49% lower for guidance users and 41% lower for VRT users than for non-users. ERS notes, for VRT, that larger farms also adopt other labour-saving practices, so the tool alone may not explain the gap.
Chart
Fewer labour hours per acre for adopters
% lower than non-adopters, corn, 10 Midwestern states (2010 and 2016 ARMS samples)
The people side is not only the farmer. A University of Illinois farmdoc daily analysis reports that about 36,830 farm equipment mechanics and service technicians worked in the US in 2023 and that industry sources report a shortage of qualified technicians (Kalva and Janzen, January 2026). States with more precision agriculture tend to have more technicians per farm and higher technician pay, though the link is weak.
Many farms also hire help. ERS found that adopters hired nutrient advice, soil sampling and pest scouting on a larger share of acres than non-adopters, for example 13.67% against 2.59% for nutrient recommendations on 2016 corn. Hiring costs for 2016 corn were $6.71 an acre for adopters and $5.31 for non-adopters.
Plan for training time in your budget. Name one person per tool who knows how it works, and write a one-page checklist for the rest of the crew.
▶ Technology in agriculture and what it does to rural towns: jobs, money and internet. · 3:50
A 90-day rollout plan
This plan works for a new sensor, map service or machine option. Adjust the dates to your season.
Infographic
Rollout in five steps
- 1Days 1-10: name the problemWrite one goal, one field and the number you will measure.
- 2Days 11-30: price it fullyGet five-year quotes with fees, support and training.
- 3Days 31-45: check the contractConfirm data ownership, export and deletion terms.
- 4Days 46-80: run the trialUse the tool on one field and keep an untouched strip.
- 5Days 81-90: reviewCompare result with cost, then keep, change or drop it.
How to run each technology after you buy it
The first month decides whether a tool becomes routine. These notes cover what to set up for each of the seven types in the table.
GPS guidance
Check the signal source and correction service, and write down the yearly fee. Record the pass width for each implement. Have the operator drive one headland the old way and the new way so you can see the overlap difference.
Yield maps and variable rate
Calibrate the monitor each season and clean the data before you use it. A map made with a poorly calibrated sensor leads to wrong rates. Make one change from the map, for example a seeding rate in two zones, and keep one strip at the old rate for comparison.
Satellite imagery
Draw the field boundaries once, check them against your own records, and decide who looks at the maps each week. Cloud can hide a field for days, so keep a second way to check, such as a walk of the weak areas.
Soil and weather sensors
Place sensors where they represent the field, not at the easiest spot. Compare readings with a hand check at the start, then trust the sensor only for the decision it was bought for, such as when to irrigate.
AI analytics
Ask the provider what data feeds the advice, what it was tested on and who is responsible for the final call. Treat a forecast as input to your decision. The GAO found that analytical tools for turning farm data into decisions are limited, so keep your agronomist involved.
Drones
Check pilot licence rules, insurance and flight limits where you farm. Plan who flies, who processes the images and who acts on them. Spray drones carry extra rules for pesticides: follow the product label and local law.
Vertical farming and controlled environments
This is a separate business with its own energy, labour and market costs. If you are considering it, build a plan on its own numbers and do not borrow field-farm figures.
How to tell if a tool worked
Pick two or three measures before the season and record them the same way each year. Good measures are simple: passes per field, input quantity per acre, hours worked per acre, response time to a problem and the cost of the tool per acre. Compare against a field or strip that stayed on the old method.
Keep the comparison fair. Weather, crop, variety and field history all change results, so one season in one field is a test, not proof. A trial run by Texas A&M AgriLife with 11 cotton producers shows the right approach: the tools were put into commercial fields and their performance is being evaluated (AgriLife Today, April 2026). Do the same on a small scale before you spread a tool across the whole farm.
Questions to ask a seller
- What is the total cost over five years, including fees, updates and repairs?
- Does it work with the machines and software I already have?
- Which data does it collect, and can I export it in a common format?
- What happens if I stop paying the yearly fee?
- Who supports it near me, and how fast do they respond in planting season?
- Can I speak to a farm of similar size and crop that has used it for more than one season?
Write the answers down and compare two or three sellers side by side. A short written comparison also helps if you need a lender, a landlord or a partner to agree to the purchase.
Mistakes that waste the money
- Buying a package before naming the problem.
- Ignoring yearly fees when comparing quotes.
- Collecting maps with no plan to change a rate, a date or a route.
- Letting one person hold all the passwords and know-how.
- Skipping the end-of-season review.
If a tool guides pesticide or fertilizer rates, follow the product label and local rules, and speak to a qualified agronomist or crop adviser before you change a dose. For loans, leasing or tax treatment of equipment, get advice from a licensed professional.
Where satellite monitoring fits
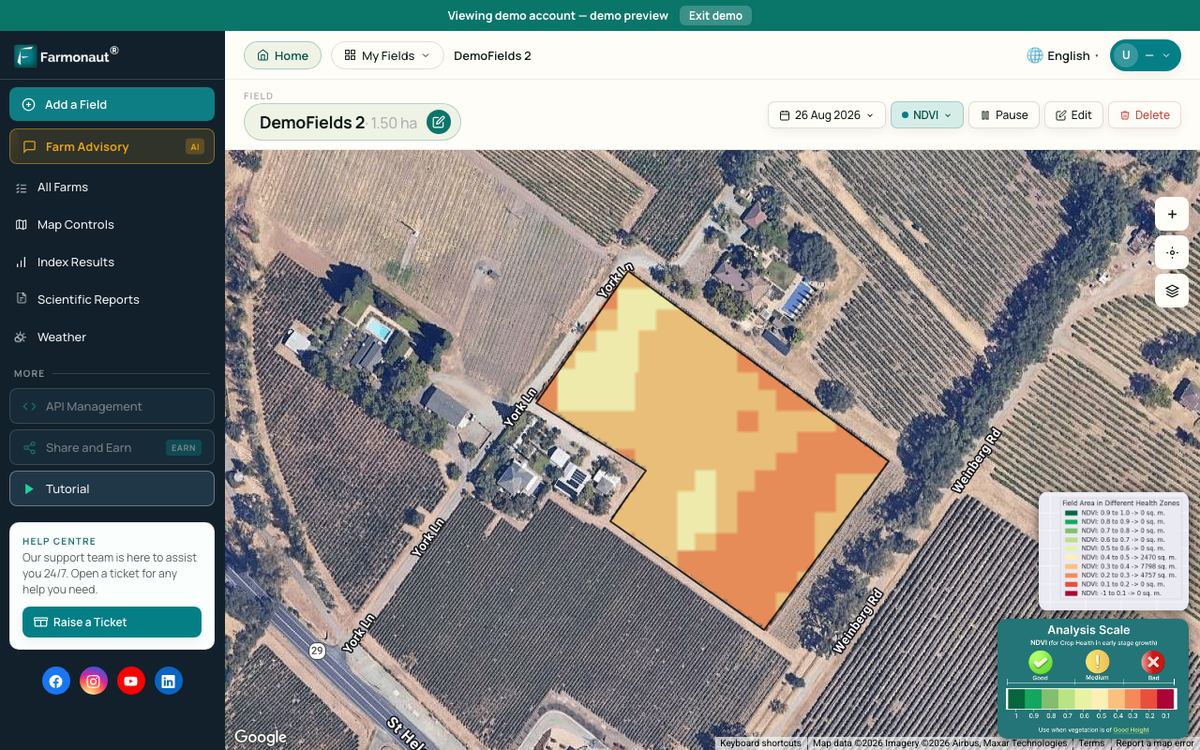
Satellite imagery needs no hardware in the field, so it can be one way to start, but compare the subscription price with other options. Farmonaut Satellite + AI Farm Monitoring System shows vegetation change on your fields through the season in a web, Android or iOS app. Satellites show that a field area changed, not why, so use the map to decide where to walk first. Teams that build their own tools can reach the data through the Farmonaut API and its developer documentation.
Related pages on our site: large-scale farm management, fleet management, product traceability, carbon footprinting, AI and big data in farming, nanotechnology in agriculture, vertical farming, soil and water management and mining claims guide (Alaska).
FAQ
What is agriculture technology management?
It is the process of choosing, funding, running and reviewing digital tools and machines on a farm so that each one pays its way. It covers purchase, data, training, repair and an end-of-season review.
How many US farms use precision agriculture?
USDA NASS reported 22% of farms in 2025 and 27% in 2023. The survey includes small farms, and ERS found adoption rises with farm size.
What does precision agriculture equipment cost?
USDA ERS survey averages from 2018 and 2019 put guidance replacement at about $20,000 to $25,000 and yield monitors at about $8,000 to $14,000, plus yearly fees. Prices differ by brand, so get current quotes.
Who owns the data a farm tool collects?
The Ag Data Transparent principles say farmers should own it. Your contract decides in practice, so read it, ask for an export and check deletion terms.
Do I need new staff to use farm technology?
Not always. Name one person per tool, plan training time and decide whether a dealer or adviser will support you. Service technicians are reported to be in short supply in the US.
Where should a small farm start?
Start with one problem on one field, using one tool you can price fully, such as satellite maps or guidance on your main tractor, and review it after one season.
Farmonaut API
Build field monitoring into your own tools
Teams that build farm software can reach satellite and weather data through the Farmonaut API.



Keep reading
Sources
- USDA ERS, Precision Agriculture in the Digital Era, EIB-248 (2023): ers.usda.gov
- USDA NASS, Technology Use (Farm Computer Usage and Ownership), August 2025: nass.usda.gov
- GAO, Precision Agriculture: Benefits and Challenges, GAO-24-105962 (2024): gao.gov
- Statistics Canada, 2021 Census of Agriculture, The Daily (2022): www150.statcan.gc.ca
- Iowa State University, Precision Ag Technology Savings (2012): crops.extension.iastate.edu
- USDA ARS, Ashworth and others, tractor guidance assessment (2022): ars.usda.gov
- Ag Data Transparent, Core Principles (2024): agdatatransparent.com
- Farm Policy News, University of Illinois, FTC settlement on right to repair (2026): farmpolicynews.illinois.edu
- farmdoc daily, Precision Agriculture and Farm Service Technician Demand (2026): farmdocdaily.illinois.edu
- Texas A&M AgriLife Today, Cotton precision digital tools tested (2026): agrilifetoday.tamu.edu
Discussion
Questions, corrections or field experience? Share them below. First-time comments are reviewed before they appear, and your email is never published.
No comments yet. Be the first to add a question or your experience.

 Bharat Krushi Seva
 Geno
 Hayleys Agriculture
 Linx Agritech
 Adinet
 Save Your Soils
 Grandstream Algérie
 XOS Realty
 Geospatial Lab Africa
 Agro La Gándara
 HIPSAC
 ZOL Zimbabwe
 Juligerm
 AdBio
 MISE Maroc
 NWNS

 Licence holder · Niger · Gold










