

Reviewed August 2026 against USDA Economic Research Service, the Association of Equipment Manufacturers (AEM), and DJI’s global adoption reporting.
Try it: Run your own numbers →
Intelligent agriculture is the use of sensors, satellite and drone imagery, and AI-driven analytics to guide farm decisions in place of fixed schedules and visual guesswork. It is not a future promise: USDA’s Economic Research Service found 70% of large-scale US crop farms and 52% of midsize crop farms already running guidance autosteering systems in 2023, and AEM’s field research puts measured yield gains from variable-rate technology at up to 62%. This article is a data check on where intelligent precision farming actually stands, what it costs, what it saves, and how to tell a real return from a marketing claim.
Table of Contents
- Adoption Data: Who Is Actually Using Intelligent Agriculture
- What “Intelligent Agriculture” Actually Means
- Precision Agriculture Robotics: Current Trends
- Comparison Table: Technology, Cost, and Measured Return
- Agriculture Automation Worldwide: Trends and Statistics
- Three Layers: Sensing, Analytics, Action
- Calculator: Estimate Your Variable-Rate Input Savings
- How Farmonaut Fits Into an Intelligent Agriculture Stack
- Implementation: Steps, Costs, and Payback
- Challenges and What the Data Doesn’t Cover
- Frequently Asked Questions
- Where This Goes Next
- Try it: Run your own numbers
Adoption Data: Who Is Actually Using Intelligent Agriculture
The clearest published US numbers come from USDA’s Economic Research Service, which breaks adoption down by farm size rather than reporting a single national average — a more honest picture than most market-report summaries. In 2023, 70% of large-scale crop farms used guidance autosteering systems, compared with 52% of midsize crop farms. The same ERS dataset found 68% of large-scale crop farms using yield monitors, yield maps, or soil maps to guide input decisions. There is no equivalent published figure for small operators in this dataset — ERS’s chart-of-note series covers midsize and large farms only, so if you run a smaller operation, the honest answer is that the national picture for your size class isn’t published; USDA NASS QuickStats is the tool to check for the closest regional proxy.
On the market side, precision farming software specifically — not hardware, not services — was sized at $2.11 billion in 2025 and is projected at $2.41 billion for 2026, per market research industry reporting. That’s a software-only figure; it excludes the robotics, sensor, and drone hardware markets, which are sized separately below. Treat any number that claims to be “the precision agriculture market” as a red flag unless it specifies which layer — software, hardware, or services — it’s measuring, because vendors routinely blend them to produce a bigger headline number.
What “Intelligent Agriculture” Actually Means
Intelligent agriculture solutions and intelligent agriculture as search terms both point to the same underlying stack, regardless of which word order a given source uses. It converges four components:
- ✔ IoT sensor networks — continuous readings on soil moisture, nutrient status, temperature, and canopy vigor, replacing periodic manual checks.
- 📊 AI-based analytics platforms — processing satellite imagery, drone photography, and weather data into field-level recommendations rather than raw data dumps.
- ⚠ Autonomous or guided machinery — autosteering tractors, spraying drones, and variable-rate applicators that execute a recommendation instead of a flat rate across the field.
- ✔ Digital management dashboards — remote monitoring and adjustment across one field or many, from a phone or a desktop.
The distinction that actually matters for buyers: a sensor network that reports data is not the same product as a system that closes the loop into an action. USDA’s own adoption categories separate “guidance autosteering” (an action-layer technology) from “yield monitors, yield maps, or soil maps” (a sensing/analytics-layer technology) precisely because farms adopt them at different rates and for different reasons — 70% vs. 68% among large farms, close but not identical, which tells you the two aren’t simply bundled together in practice.
Precision Agriculture Robotics: Current Trends
The United States agricultural robots market — autonomous tractors, robotic weeders, automated harvesters, and similar hardware — was sized at $3.43 billion in 2025, according to IMARC Group. That figure sits apart from the $2.11 billion precision farming software market cited above; robotics hardware and analytics software are tracked as separate markets, and conflating them overstates either one.
Drone adoption is the trend with the clearest global numbers attached. DJI reported 600,000 agricultural drones deployed worldwide by the end of 2025, with aggregate effects the company attributes to that fleet: 410 million tons of water saved and 51 million tons of CO2 emissions avoided through more targeted spraying and reduced pass count. Those are DJI’s own reported figures for its installed base, not an independent third-party audit, so treat them as a vendor-reported baseline rather than a regulatory statistic — useful for scale, not for precision.
On labor economics, the reason robotics and autosteering adoption keeps climbing is visible in USDA’s own wage data: the average wage for crop, nursery, and greenhouse workers in the US was $18.24 per hour in November 2025, and the average wage for agricultural equipment operators was $19.07 per hour in the same month. A robotic or autosteered system doesn’t need to eliminate a role to pencil out — it needs to make each labor-hour cover more acres, and at these wage levels the arithmetic on a multi-thousand-acre operation moves quickly.
Comparison Table: Technology, Cost, and Measured Return
The single most useful thing an AI summary can’t hand you in one line is a side-by-side of what’s actually measured versus what’s still a projection. Here’s what’s backed by a named source with a year attached, and what isn’t yet:
| Technology / Metric | Figure | Period | Source |
|---|---|---|---|
| Guidance autosteering, large crop farms | 70% adoption | 2023 | USDA ERS |
| Guidance autosteering, midsize crop farms | 52% adoption | 2023 | USDA ERS |
| Yield monitors / yield maps / soil maps, large farms | 68% adoption | 2023 | USDA ERS |
| Yield increase from variable-rate technology | Up to 62% | 2024–2025 study | AEM |
| Fertilizer reduction from variable-rate technology | Up to 60% | 2024–2025 study | AEM |
| Average annual production boost, current adoption levels | 5% per year | 2024–2025 | AEM |
| Precision farming software market | $2.11B → $2.41B | 2025 → 2026 (projected) | Market research industry reports |
| US agricultural robots market | $3.43 billion | 2025 | IMARC Group |
| Agricultural drones deployed globally | 600,000 units | End of 2025 | DJI |
Notice the AEM figures split into two different claims that get conflated elsewhere: “up to 62% yield increase” is the ceiling measured under variable-rate technology in specific field trials, while “5% average annual production boost” is what AEM attributes to precision agriculture adoption in aggregate across the sector. A vendor quoting the 62% figure as a typical, sector-wide outcome is misreading — or misrepresenting — their own source.

Agriculture Automation Worldwide: Trends and Statistics
Pulling the automation-specific figures together: the worldwide drone fleet (600,000 units, DJI, end of 2025) and the US robotics hardware market ($3.43 billion, IMARC Group, 2025) describe two different scopes — one is a unit count across the globe, the other is a dollar market confined to the United States. Neither maps directly onto “percentage of farms worldwide using automation,” and that figure — global adoption rate as a share of all farms — is not published in a form we could verify for this article. If you need it for a specific country or region, USDA NASS QuickStats covers the US in detail; Eurostat’s farm structure survey and Statistics Canada’s Census of Agriculture are the equivalent authoritative sources for the EU and Canada respectively.
What is durable here, independent of which year’s figures you’re reading: DJI’s report and USDA’s ERS chart-of-note series are both refreshed on a predictable cycle — DJI publishes an annual Agricultural Industry Insight Report (the fifth edition came out in April 2026), and USDA ERS updates its chart-of-note adoption figures as new Agricultural Resource Management Survey (ARMS) data becomes available. Bookmark the source, not the number, and you’ll always have the current figure rather than a stale one.
Three Layers: Sensing, Analytics, Action
Regardless of vendor, every credible intelligent agriculture system separates into the same three layers, and knowing which layer a product sits in is the fastest way to evaluate a sales pitch:
- Sensing Layer: Soil probes, canopy cameras, multispectral satellite passes, and drones collecting raw measurements — moisture, nutrient status, canopy vigor, pest pressure.
- Analytics Layer: Software that turns sensing-layer data into a recommendation — where AI and machine learning actually do the work, converting a moisture reading into an irrigation schedule or a canopy anomaly into a scouting alert.
- Action Layer: The equipment that executes the recommendation — variable-rate applicators, autosteered tractors, spray drones. This is the layer USDA’s 70%/52% autosteering figures and AEM’s 62% yield and 60% fertilizer-reduction figures are measuring.

Calculator: Estimate Your Variable-Rate Input Savings
AEM’s field data shows fertilizer reductions of up to 60% and yield gains of up to 62% under variable-rate technology — but “up to” is a ceiling, not your farm’s number. Enter your own acreage, current fertilizer spend, and expected yield to see what a partial version of that ceiling is worth on your operation.
Run your own numbers
Intensive Farming: Where Automation Concentrates
Automation adoption is not evenly spread across farm types. USDA’s ERS data shows the gap directly: 70% of large-scale crop farms versus 52% of midsize farms have adopted autosteering — an 18-point spread driven by the fixed cost of the hardware being easier to amortize over more acres. That’s the practical reason precision agriculture robotics coverage skews toward row-crop and large-acreage operations rather than specialty or diversified farms: the $3.43 billion US robotics market (IMARC Group, 2025) is concentrated on machinery built for scale.

Where Sensing Substitutes for Automation
Not every gain requires action-layer hardware. Yield monitors, yield maps, and soil maps — sensing and analytics only, no autosteering or robotics attached — reached 68% adoption among large-scale crop farms in 2023 (USDA ERS), nearly matching the 70% autosteering figure without the equipment cost of a guided or autonomous machine. For operations weighing where to spend first, the data suggests the sensing-and-analytics layer alone can close much of the adoption gap that automation gets the credit for.


How Farmonaut Fits Into an Intelligent Agriculture Stack
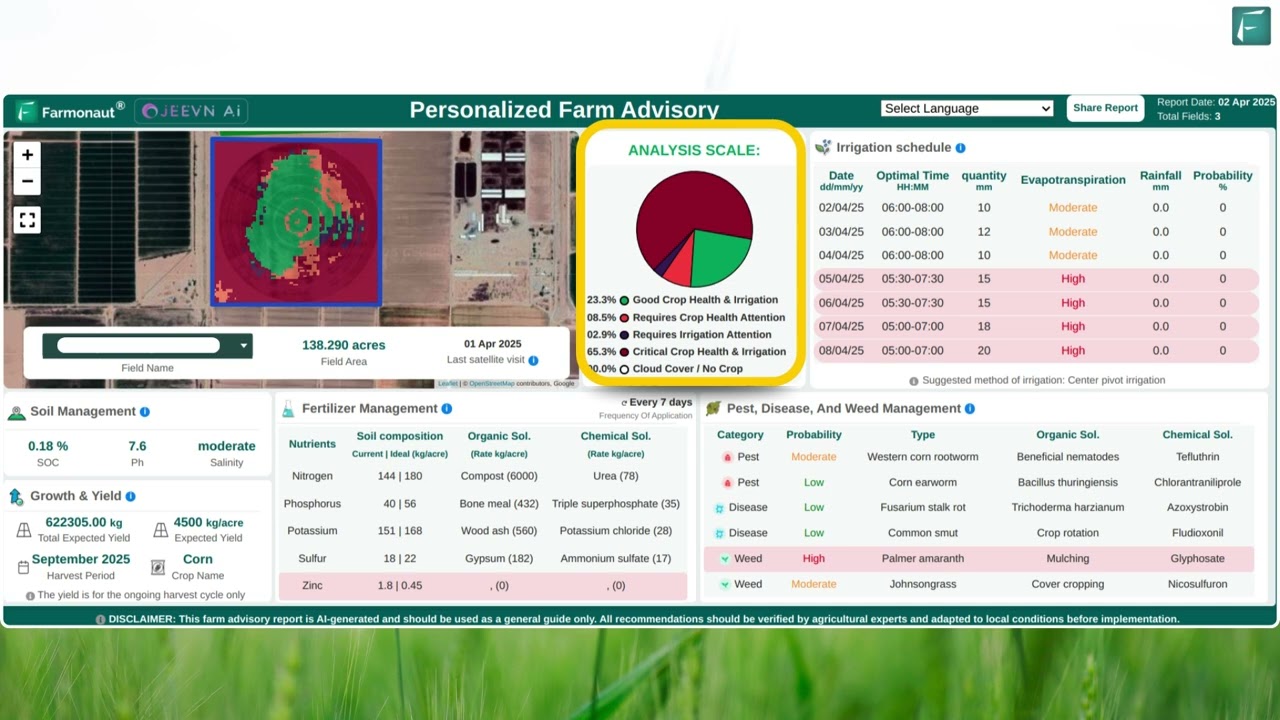
We at Farmonaut operate primarily at the sensing and analytics layers described above — the two layers where, per the ERS data, adoption is already close to parity with action-layer automation without requiring new machinery on the farm:
- ✔ Satellite-Based Monitoring: Multispectral satellite imagery for crop health, soil conditions, and land structure — delivered across Android, iOS, web, and API.
- 📊 Jeevn AI Advisory System: AI-driven analytics and advisory tailored to local climate and farming context.
- ✔ Blockchain Traceability: Crop and product traceability for supply chain transparency and market access.
- 🌱 Environmental Impact Monitoring: Carbon footprinting tools to track emissions and support carbon-market access.
- 🚛 Fleet Management: Fleet management solutions to raise machinery uptime without buying new automation hardware.
- 🏦 Crop Loan & Insurance: Satellite-verified documentation for loan and insurance access.



Developers integrating these data streams elsewhere can access our API — see the API documentation for implementation details, and read more on where these trends are heading in our farming trends analysis.
Implementation: Steps, Costs, and Payback
A stepwise approach grounded in the adoption data rather than a generic checklist:
- Benchmark against your farm size class: If you’re a large-scale operation, USDA’s 70% autosteering / 68% yield-mapping adoption figures mean you’re now behind a majority, not ahead of a trend. If you’re midsize, 52% adoption means you have more company than a vendor pitch might imply.
- Separate sensing/analytics spend from action-layer spend: The 68% yield-mapping adoption figure shows this layer alone drives most of the visible adoption without requiring new machinery. Our large-scale farm management systems are built for this layer specifically.
- Pilot before scaling: A free-trial period, such as the sap intelligent agriculture free trial, lets you test against your own acreage and cost structure before a full commitment.
- Model your own numbers, not the ceiling: AEM’s 62% yield and 60% fertilizer figures are field-study ceilings. Use the calculator above with your own inputs rather than assuming the ceiling applies to your operation.
- Track input savings and yield change for at least one full season before judging payback — commodity price swings and weather variability in any single season can mask or exaggerate a technology’s actual contribution.
- Scale by acreage economics, not by hype: the 18-point adoption gap between large and midsize farms tracks fixed-cost amortization, so re-run your payback math whenever you add or drop acreage.

Challenges and What the Data Doesn’t Cover
Being direct about what the published research does and doesn’t support avoids the overclaiming that undermines this category elsewhere online:
- ⚠ No verified US market-size total: the $2.11–2.41 billion figures are software-only and the $3.43 billion figure is robotics-only, both US-specific for the latter; no comprehensive combined US precision agriculture market figure was located for this article. If you need one, look for a report that explicitly states its scope (software vs. hardware vs. services) before citing it.
- ⚠ No small-farm adoption data: USDA ERS’s chart-of-note series covers midsize and large operations only. Small-farm adoption rates aren’t published in this dataset — check USDA NASS QuickStats directly for the closest available breakdown by your operation size.
- ⚠ No verified global adoption percentage: “X% of farms worldwide use precision agriculture” is a common claim online, but no source in this research turned up a verifiable figure for it. Treat any such claim you see elsewhere as unsourced until it names an origin.
- ⚠ No per-acre dollar savings figure: AEM’s 60% fertilizer reduction and 62% yield increase are percentages, not dollar amounts per acre by crop. Convert them to dollars using your own local input costs and yields — the calculator above does exactly this.
- ⚠ Data ownership and interoperability: unrelated to the market-size gaps above, this remains a genuine adoption barrier — confirm in writing who owns field data collected by any platform you adopt, and whether it exports in a format usable by other vendors.
- ⚠ Environmental compliance documentation: tools such as Farmonaut’s carbon footprinting reduce the manual burden of this, but requirements vary by state and by buyer contract — verify against your specific program rather than a general claim.

Frequently Asked Questions
What is intelligent agriculture?
Intelligent agriculture is the combination of IoT sensors, satellite and drone imagery, AI-driven analytics, and automated or guided machinery used to make field-level farm decisions. USDA ERS data shows 70% of large-scale US crop farms and 52% of midsize crop farms had adopted guidance autosteering — one component of this stack — as of 2023.
What is intelligent precision farming, specifically?
It’s the same technology stack applied at field or sub-field resolution — treating different zones of the same field differently based on sensor and imagery data, rather than applying one rate across the whole field. Variable-rate technology, the core mechanism, has measured yield gains of up to 62% and fertilizer reductions of up to 60% in AEM’s 2024–2025 field study.
What are the current trends in precision agriculture robotics?
The US agricultural robots market was $3.43 billion in 2025 (IMARC Group), and globally, 600,000 agricultural drones were deployed by the end of 2025 (DJI), attributed to saving an estimated 410 million tons of water and 51 million tons of CO2 emissions through more targeted application. These are the two clearest sized trends in robotics-adjacent automation currently published.
What is the ROI of adopting intelligent agriculture solutions?
AEM’s study found up to 62% yield increases and up to 60% fertilizer reductions from variable-rate technology specifically, and a 5% average annual production boost from precision agriculture adoption in aggregate across the sector. These are the ceiling and the average — your own result depends on your baseline practices, which is why modeling your own numbers (see the calculator above) matters more than quoting the ceiling.
How current are these adoption figures, and where do I get newer ones?
USDA ERS’s chart-of-note adoption figures are drawn from Agricultural Resource Management Survey (ARMS) data and refreshed as new survey rounds are analyzed — check USDA ERS’s chart of note directly for the current release. DJI’s Agricultural Industry Insight Report is published annually, with the fifth edition released in April 2026.
How can I try Farmonaut’s solutions?
Sign up for Farmonaut’s app on web, Android, or iOS, and access satellite-driven insights for crops, forestry, or reclamation projects. APIs are available for developers via the developer documentation.
Where This Goes Next
The durable pattern behind every number in this article, independent of which year you’re reading it in: adoption climbs fastest where fixed costs amortize over more acres (the 70% vs. 52% autosteering split by farm size), sensing-and-analytics adoption runs close behind action-layer automation without requiring new machinery (68% yield-mapping vs. 70% autosteering), and measured returns from variable-rate technology are reported as a range with a stated ceiling, not a flat guarantee (up to 62% yield, up to 60% fertilizer reduction). That structure — check your farm-size class against the adoption data, separate sensing spend from action spend, and model your own numbers against the study ceiling rather than assuming it — holds regardless of which year’s USDA ERS or AEM release you’re reading.
To keep this current yourself: re-check USDA ERS’s chart of note when new ARMS survey data is released, watch for DJI’s next annual Agricultural Industry Insight Report, and re-run the calculator above with your own current fertilizer and revenue figures each season rather than relying on last season’s inputs.

 Hiteshi Infotech
 Clubhouse OS
 Progenseed
 SkyHarvest
 Polaris Digitech
 Teledarbas
 Wild Oak Farm
 SFX
SFX BACF Africa
 Doodlakine
 Exurbia Geospatial
 FieldZero
 Indico Company
