

Soybeans · Irrigation guide
Soybean Crop Irrigation: 7 Methods, Costs and Timing
Soybean crop irrigation pays most at pod development and seed fill (R3-R6). A fully irrigated crop uses about 20 to 26 inches a season and peaks near 0.32 inches a day (University of Nebraska). Compare seven methods and test your own numbers.
Key takeaways
- A fully irrigated soybean crop uses about 20 to 26 inches a season, with a peak near 0.32 inches a day (University of Nebraska).
- In Nebraska trials, starting at pod elongation with 7.5 inches often matched full-season scheduling with 12.5 inches, but the guide warns it needs enough stored soil water and rain, and may often fall short in west-central Nebraska.
- Potential irrigation efficiency runs from 45-65% for conventional furrow to 75-90% for center pivot and 80-95% for drip (UC-adapted table).
- Texas A&M put gross investment at about US$209 an acre for furrow and US$1,200 for subsurface drip, in 2011 dollars, excluding the well and pump.
- Kansas State found no significant soybean yield gap between subsurface drip and a LEPA pivot at Colby in 2005.
In this article
- Soybean crop irrigation methods compared
- How much water soybeans need, and when
- What the Nebraska timing trials showed
- 1. Center pivot
- 2. Surface drip
- 3. Hand-move and side-roll sprinklers
- 4. Deficit irrigation
- 5. Furrow and basin irrigation
- 6. Subsurface drip
- 7. Flood irrigation
- How to choose an irrigation system
- Soybean crop irrigation scheduling, step by step
- Can variable-rate irrigation save water?
- Soybean irrigation and a changing climate
Soybean crop irrigation works best when water reaches the crop at pod development and seed fill, the R3 to R6 stages. A fully irrigated crop uses about 20 to 26 inches of water in a season and peaks near 0.32 inches a day, according to University of Nebraska NebGuide G1367. Rain and stored soil water cover part of that, so the irrigation you need is usually smaller.
This guide compares seven ways to water soybeans, with efficiency ranges, investment costs and field trial results. It also shows when to start and stop, and it has a calculator for your water need and break-even yield. If you only need a daily figure, see our separate page on soybean water per day.
Soybean crop irrigation methods compared
The table sums up the seven options. Six are ways to deliver water. Deficit irrigation is a schedule that you can run on most of the others. Efficiency here means potential irrigation efficiency, as the source table labels it. It covers general irrigation systems, not soybeans alone. The ranges come from a Sacramento Valley table adapted from University of California guidance, and they depend heavily on management.
| Method | Efficiency range | Gross investment (Texas, 2011 dollars) | Best for |
|---|---|---|---|
| Center pivot | 75-90% | US$338-556/acre | Large, fairly level fields |
| Surface drip | 80-95% | Not in the Texas study | Small or irregular plots; rare in field soybeans |
| Hand-move or side-roll sprinkler | 65-85% | Not in the Texas study | Small fields and odd shapes |
| Deficit schedule | Same as the system used | No extra hardware | Limited wells or water allocations |
| Furrow or basin | 45-80% | US$209/acre (furrow) | Evenly graded fields on heavier soils |
| Subsurface drip | 80-95% | US$1,200/acre | Fields where a pivot cannot fit |
| Flood (basin or precision level) | 60-80% | Not in the Texas study | Precision-leveled land with ample water |
The costs come from Texas A&M bulletin B-6113, published in October 2011. They exclude the well, pump and engine. Treat them as a guide to the gap between systems, not as a quote. Ask local dealers for current prices.
Chart
Potential irrigation efficiency by system
Percent, from low to high level of management
How much water soybeans need, and when
NebGuide G1367 reports that about 65% of seasonal water use falls in the reproductive stages, R1 to R6 and beyond. A well-watered crop can transpire up to 0.5 inches on a hot, windy day in late July or August. FAO’s Crop Yield Response to Water (2012) gives a wider world range of 300 to 800 mm of seasonal evapotranspiration and a peak near 8 to 9 mm a day. So the common 500 to 600 mm figure fits many fields, but it is not a rule.
Water matters most at pod development (R3-R4) and seed fill (R5-R6). Stress at these stages can cut yield sharply. Nebraska notes that good management on well-drained soils can reach 60 to 80 bushels per acre. Earlier water may still be needed on sandy soil or in very dry years.
What the Nebraska timing trials showed
Nebraska compared four programs at Tryon, North Platte, Clay Center and Mead. In most locations, waiting until pod elongation and applying 7.5 inches gave yields not significantly different from full-season scheduling with 12.5 inches. That saves water only if the system can catch up and stored soil water and early rain are enough. G1367 says this may fall short too often at the two west-central sites, and its support for delay is strongest for eastern Nebraska. Delaying past R3 can also fail where capacity is too low to meet demand.
Chart
Seasonal irrigation in Nebraska’s timing programs
Effective inches applied, adjusted for rainfall; rainfed got water only if needed for germination
G1367 warns against scheduling by growth stage alone if the soil is sandy loam or coarser, the soil water reservoir is small, or the system delivers under 1.5 inches a week. In those fields, schedule by crop water use and soil moisture instead.
1. Center pivot
A pivot carries sprinklers on wheeled towers around a central point. It suits large fields, needs little labor to run and can match applications closely to crop water use. Fitting low-pressure drops raises efficiency. The Sacramento Valley table puts LEPA, which delivers water directly into furrows, at 80 to 90%.
In the Texas study, a half-mile pivot cost 40% less per acre than four quarter-mile pivots, US$338 against US$556. LEPA pivots gave the highest benefits of the three pivot types at low, medium and high water needs.
Best for: large fields where the water supply justifies the investment. Watch for: corners left dry and wheel-track ruts.
Chart
Gross investment by irrigation system
US$ per acre, 2011 dollars, Texas study, excluding well, pump and engine
2. Surface drip
Drip lines deliver water at low pressure through emitters along the row. Foliage stays dry and less soil surface is wet, which limits weed growth. Lines laid on the surface need yearly handling, and that is hard to justify across a close-row grain crop. Published soybean results for surface drip are thin, so judge it on labor and water savings first.
Best for: small plots, seed production and research blocks. Watch for: clogging, rodent damage and labor to lay and collect the lines.
3. Hand-move and side-roll sprinklers
These sprinklers mimic rain and work on many soils and slopes. Side-roll and hand-move systems fall in the 65 to 85% range in the Sacramento Valley table. Wind and evaporation take a share, and labor is higher than with a pivot. The move schedule also limits how fast you can respond at peak demand.
Best for: small and irregular fields. Watch for: uneven patterns in wind.
4. Deficit irrigation
Deficit irrigation applies less than the crop could use. The aim is to protect pod set and seed fill and accept some stress at less sensitive stages. Nebraska advises that limited water brings the most benefit at R3 to R6, though dry years may need a rescue irrigation earlier.
In a Kansas State trial at Colby, replacing 60% to 100% of crop water use gave soybean yields of 4.2 to 5.0 Mg per hectare in 2005. That is roughly 62 to 74 bushels per acre, in one soybean season at one site.
Best for: limited wells and water allocations. Watch for: running short at seed fill, a stage when stress can cut yield.
Chart
Soybean yield at reduced water, SDI vs LEPA
Mg per hectare by share of crop water use replaced; Colby, Kansas, 2005 only
5. Furrow and basin irrigation
Gravity moves water down furrows or across basins. Investment is the lowest of the systems Texas A&M studied, but conventional furrow loses more water, at 45 to 65% in the Sacramento Valley table. Tailwater return lifts that to 60 to 80%. The Mississippi Delta bulletin from Mississippi State stresses that success depends on good decisions about when and how much to apply.
Nebraska notes a practical trap. In a dry July, furrow soil can crack, so an early irrigation that seals the furrow may be needed before R3. With adequate rain, its guidance says two 3-inch furrow irrigations can give optimum yields: one at full flowering or beginning pod, the other at beginning seed fill.
Best for: evenly graded fields on heavier soils. Watch for: runoff, erosion and uneven water from head to tail.
6. Subsurface drip
Subsurface drip (SDI) buries lines below the soil surface, so little water is lost from wet soil. At Colby, Kansas State found no significant soybean yield difference between SDI and a LEPA pivot in 2005. Dripline depth did not significantly change yields either. There was a trend toward SDI at reduced water and toward LEPA at full water.
Cost decides most cases. Texas A&M concluded that compared with a LEPA pivot, SDI was not economically feasible at any crop water-use level in its analysis, because investment was high and the efficiency gain small. It may fit land where a pivot cannot physically go. University of Missouri work reported by DTN in 2017 found higher soybean yields at one plot when SDI was paired with drainage water management on poorly drained flat soils, up to 14 bushels per acre over the previous year. K-State’s SDI pages are a useful start if you are pricing a system.
Best for: odd-shaped fields and scarce water, once the sums work. Watch for: clogging, filter upkeep and rodent damage.
7. Flood irrigation
Flooding covers the whole surface. Basin flooding runs from 60% with low management to 75% with high management in the Sacramento Valley table, and precision level basins reach up to 80%. Soybeans dislike long periods of standing water on poorly drained land, so get water on and off quickly.
Best for: precision-leveled fields with ample, low-cost water. Watch for: waterlogging, weeds and disease.
How to choose an irrigation system
Work through these five points before you price equipment. A quick check on capacity helps: at the 0.32-inch daily peak, a 130-acre pivot at 80% efficiency needs roughly 980 gallons a minute running all day. If your well gives much less, plan on stored soil water or a deficit schedule.
- Field shape and slope. Pivots need open, fairly level ground. Furrows need a planned, even grade.
- Water supply. Compare well output with peak demand. Limited supply points to a deficit schedule and low-loss delivery.
- Soil. Sandy soil holds little and needs frequent, light applications, which suits a pivot. Heavy soils can suit furrows.
- Crop mix. Texas A&M found advanced systems pay best on crops with high water needs and deep pumping lifts. If soybeans rotate with corn, judge the system on the whole rotation.
- Labor and energy. Pumping costs can change the answer, so price your own fuel and lift.
Try the numbers for your own farm below.
Calculator
How much irrigation do your soybeans need, and does it pay?
Enter your own field, water and price numbers.
- Water cost per acre (US$): $100
- Break-even yield gain: 10.0 bu/acre
- Net return per acre (US$): $0
- Flow to meet peak use, pumping 24 hours: 982 gpm
Example values only, set near break-even; not a benchmark or forecast. All inputs are yours. Peak flow uses a fixed 0.32 inches a day (University of Nebraska, G1367) and 453 gpm per acre-inch an hour. It ignores rain during the peak and fixed system costs. Get professional advice before investing.
Soybean crop irrigation scheduling, step by step
- Check soil water before flowering. Probe to 3 feet. Most water extraction comes from the top 2 to 3 feet, according to G1367.
- Use sensors at several depths. University of Arkansas fact sheet FSA58 recommends sensors at 6, 12, 18 and 30 inches for soybeans.
- Set a trigger. At peak use, the University of Nebraska suggests keeping soil water above 50% of plant-available water in the top 3 feet.
- Limit each application. Keep water within about 3 feet of depth to avoid leaching nitrates toward groundwater.
- Plan the last irrigation. Use the Nebraska CropWatch late-season table, which lists soybean water use remaining to maturity: about 9 inches at R4, 6.5 at R5, 3.5 at R6 and 1.9 at R6.5, when leaves begin to yellow. Subtract the soil water you can count on, and irrigate only for the gap.
- Record what you applied. Compare water, rain and yield by field each year.

▶ A tutorial on monitoring crops with satellite imagery in the Farmonaut web app. · 8:43
Water quality and equipment checks
Test irrigation water for salts before the season. FAO’s water quality guide lists full soybean yield potential up to a water salinity of about 3.3 dS/m under its assumptions. Filter and flush drip lines, inspect nozzles and hoses, and check pressure so coverage stays even. Follow local water rules and permit limits, and get local advice before major investment.
Can variable-rate irrigation save water?
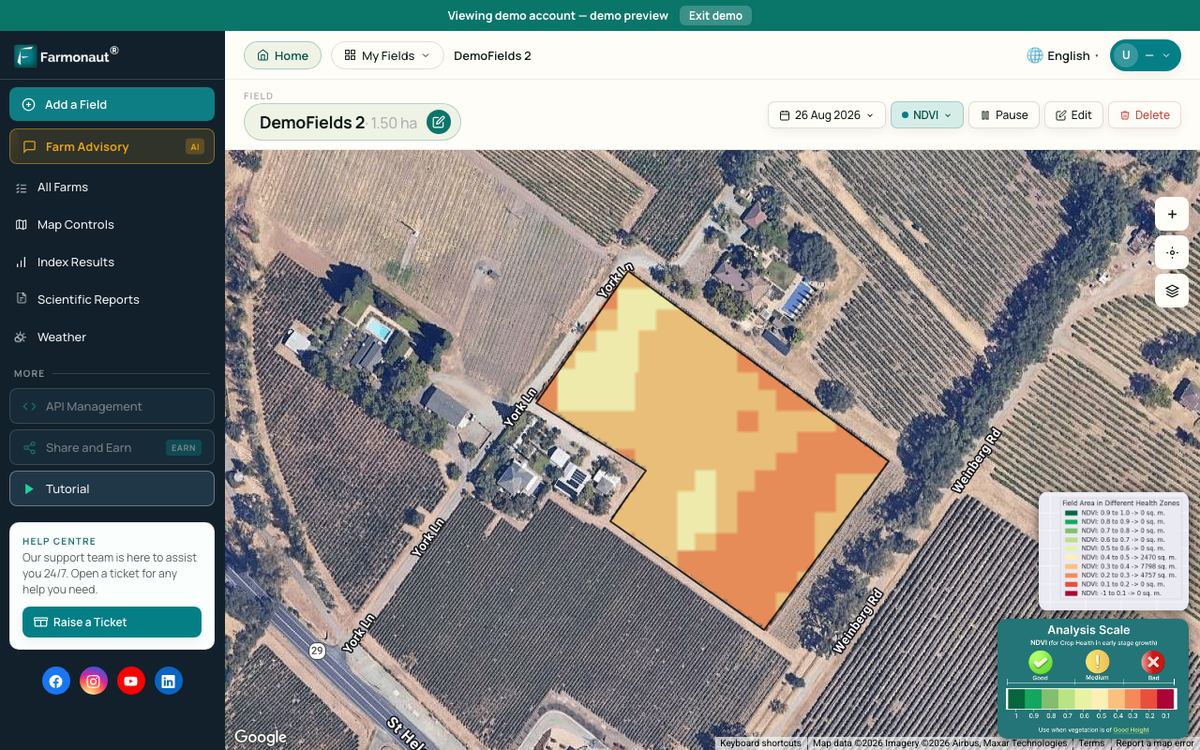
Variable-rate pivots change the amount applied across a field. A west-central Nebraska study of maize and soybean found that variable rate did not significantly change grain yield, though it did reduce prescribed water in one year, 2018. So weigh the hardware cost against your own field variation. Satellite vegetation maps can help you see which parts of a field lag and need a closer look on the ground. Monitoring systems such as Farmonaut show those patterns, but they do not replace a soil probe. Maps show where plant growth differs, not why.

▶ How satellite NDVI maps show crop stress across a large farm. · 4:09
Soybean irrigation and a changing climate
Water supply and heat both affect planning. USDA’s 2023 Irrigation and Water Management Survey counted 53.1 million irrigated acres on 212,714 US farms, with 81 million acre-feet applied, down 2.8% from 2018. On all crops, the average was 1.5 acre-feet per acre. Hotter, drier spells raise crop water demand, so check that your system can keep up at peak, and keep soil water in reserve before flowering where you can. Cover, residue and reduced tillage can also help hold water in the soil.

▶ Simple farming practices that protect soil and water. · 4:34
FAQ
How much water does a soybean crop need?
A fully irrigated crop uses about 20 to 26 inches over the season in Nebraska’s guidance. Irrigation supplies only the gap left by rain and stored soil water.
What is the best irrigation method for soybeans?
No method wins everywhere. On large fields, a low-pressure center pivot is often a practical balance of cost and efficiency. Furrow costs less up front but loses more water. In the Texas A&M analysis, subsurface drip did not pay compared with a LEPA pivot.
When should I start irrigating soybeans?
On medium and fine soils with good stored water, Nebraska trials found that waiting until R3 often matched full-season yields, with the strongest support in eastern Nebraska. Start earlier on sandy soil, in very dry years or if system capacity is below 1.5 inches a week.
When can I stop irrigating soybeans?
Keep soil water adequate through seed fill, then compare remaining crop use with the soil water you have. The Nebraska CropWatch table lists water to maturity by stage.
Does drip irrigation raise soybean yield?
Results vary. At Colby, Kansas, subsurface drip and a LEPA pivot were not significantly different in soybean yield. Missouri work reported gains when drip was paired with drainage water management on poorly drained soils.
Related pages on our site
Crop monitoring apps · large-scale farm management · farm fleet management · product traceability · carbon footprinting · crop loans and insurance verification · satellite weather API · API developer docs
Farmonaut crop monitoring
See your soybean fields from space
Draw your fields once and Farmonaut shows satellite vegetation maps for them through the season, on web, Android or iOS.



Keep reading


Sources
- University of Nebraska Extension, NebGuide G1367, Irrigating Soybean (revised December 2012): extensionpubs.unl.edu
- Sacramento Valley Water Quality Coalition, Irrigation Efficiency Table (adapted from UC ANR Publication 8571): svwqc.org
- Texas A&M AgriLife Extension, bulletin B-6113 on irrigation system costs and benefits (2011): agecoext.tamu.edu
- FAO, Crop Yield Response to Water, Paper 66, soybean chapter (2012): fao.org
- Kansas State University, ASABE paper 09-5923 on subsurface drip research at Colby (2009): milab.ksu.edu
- Mississippi State University MAFES, Bulletin 1143: mafes.msstate.edu
- DTN/Progressive Farmer, University of Missouri subsurface drip research (2017): dtnpf.com
- Kansas State University, Subsurface Drip Irrigation FAQ: ksre.k-state.edu
- University of Arkansas Extension, FSA58 Watermark soil moisture sensors: uaex.uada.edu
- University of Nebraska CropWatch, Scheduling the Last Few Irrigations of the Season (2022): cropwatch.unl.edu
- FAO, Water Quality for Agriculture, Paper 29: fao.org
- Variable Rate Irrigation of Maize and Soybean in West-Central Nebraska, Frontiers in Big Data via PMC: pmc.ncbi.nlm.nih.gov
- USDA NASS, 2023 Irrigation and Water Management data release (31 October 2024): nass.usda.gov
Discussion
Questions, corrections or field experience? Share them below. First-time comments are reviewed before they appear, and your email is never published.
No comments yet. Be the first to add a question or your experience.

 FFBS
 Jontra
 Yaduka Agrotech
 Kalustyan
 Tucor
 Geno
 Hayleys Agriculture
 Linx Agritech
 Adinet
 Save Your Soils
 Grandstream Algérie
 XOS Realty
 Geospatial Lab Africa
 Agro La Gándara
 HIPSAC
 ZOL Zimbabwe
 Juligerm

 Licence holder · Niger · Gold
 Client · Tanzania · Gold










