

US farming states · Data guide
Best Farming States in the US: Sales, Land and Practices
California leads on farm sales (US$61.9 billion in 2024), Texas on farmland area, and cover crops were on 4.7% of US cropland in 2022. See the states ranked by USDA data and test what a conservation practice costs on your farm.
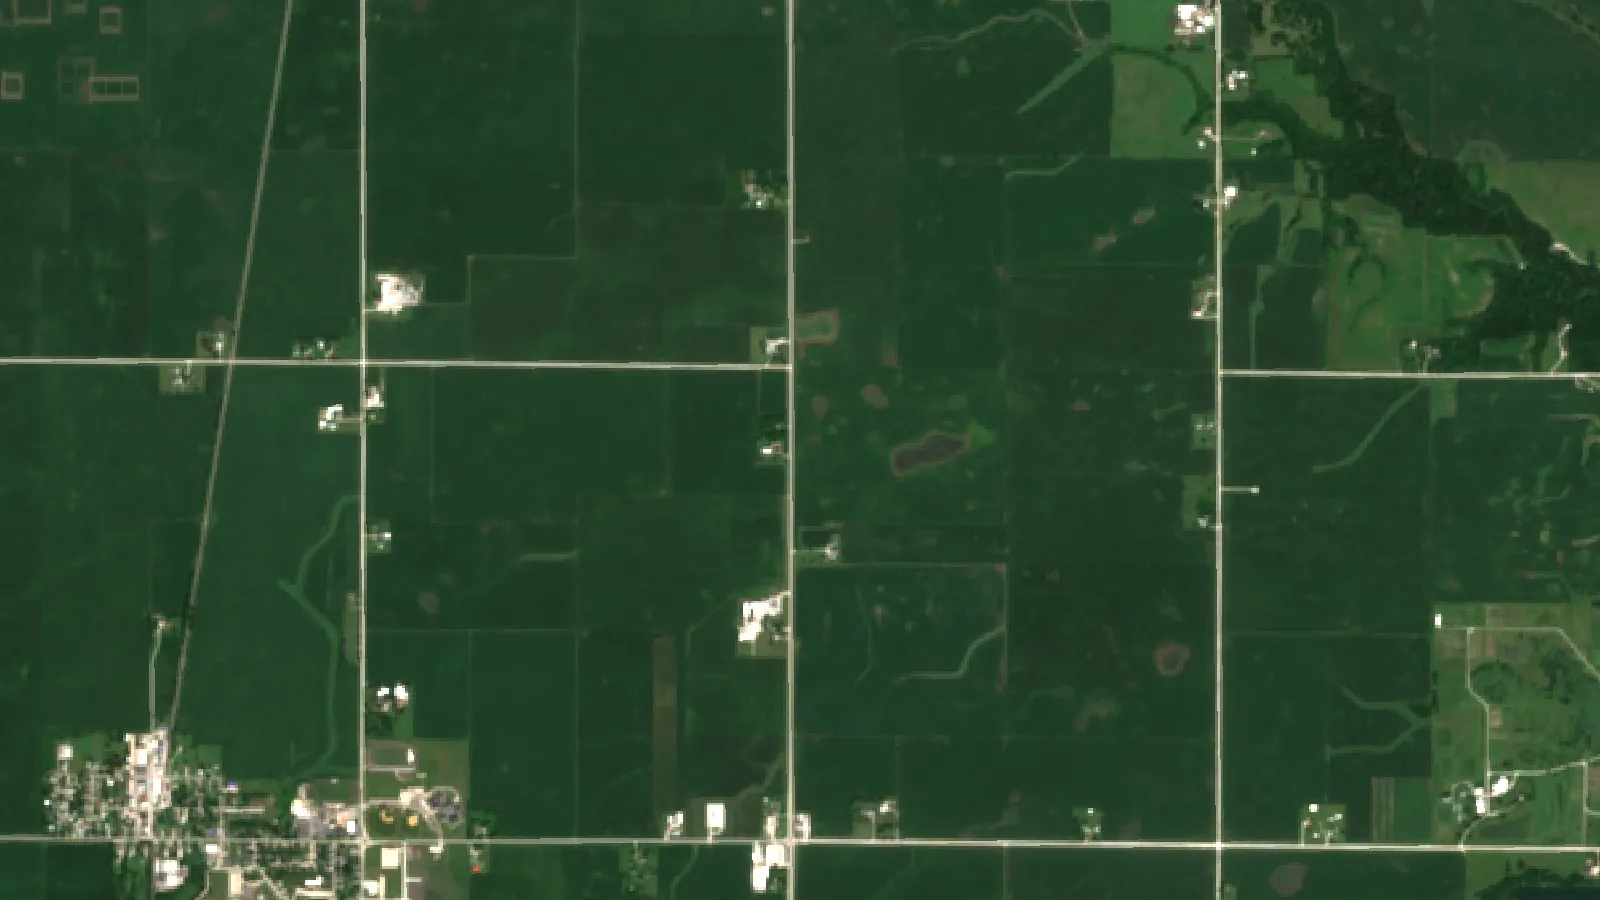
Key takeaways
- Top 10 by 2024 cash receipts (USDA ERS): California, Iowa, Nebraska, Texas, Kansas, Illinois, Minnesota, Wisconsin, Indiana, North Carolina; US total US$515.3 billion.
- Texas had 125 million of the 873.95 million acres in US farms in 2025 (NASS), but ranks fourth on sales, partly because much of it is range.
- Average cropland cost US$6,020 per acre in 2026 (NASS): California US$18,430, Iowa US$10,700, Kansas US$3,540, Texas US$2,790.
- Cover crops were on 4.7% of cropland in 2022, up from 2.7% in 2012; Texas (1.55 million acres) and Iowa (1.28 million) had the most.
- One Corn Belt study put cover crop costs at US$33 to US$70 per acre and benefits at US$37 to US$78 (Penn State Extension), so test on your own fields.
In this article
- Best farming states in the US by farm sales
- What the top states grow and raise
- The farm economy behind the ranking
- Which states have the most farmland
- What farmland costs by state
- Water: where irrigation matters
- Best sustainable farming practices across the top states
- How to choose a state: five checks
- Which state is best for your type of farm
- Use satellite monitoring in any state
- How we checked the numbers
- FAQ
- Conclusion
California leads US farm sales with US$61.9 billion in cash receipts in 2024, ahead of Iowa (US$38.3 billion) and Nebraska (US$31.9 billion), according to the USDA Economic Research Service (ERS) state data. Which of the best farming states suits you depends on what you grow. For sustainable farming practices, the two with national Census of Agriculture data are cover crops and no-till, and in the 2022 Census of Agriculture cover crops were on 4.7% of US cropland.
This guide ranks states by sales, land, farmland price and irrigated area, then shows where conservation practices are used and what they cost. It ends with a cover crop calculator you can fill in with your own numbers.
Best farming states in the US by farm sales
A common way to rank farming states is by cash receipts: the money farms earn from selling crops, livestock and animal products. ERS lists the same top 10 for 2024 in its state data: California, Iowa, Nebraska, Texas, Kansas, Illinois, Minnesota, Wisconsin, Indiana and North Carolina. The US total was US$515.3 billion in 2024, so California alone made up about 12%.
Chart
Farm cash receipts by state, 2024
US$ billion, crops plus livestock and products, the eight largest states
| State | 2024 receipts, US$ bn | Crops share | Largest items, US$ bn |
|---|---|---|---|
| California | 61.9 | 73% | Dairy 8.6, almonds 6.2, grapes 5.6 |
| Iowa | 38.3 | 49% | Corn 11.7, hogs 9.0, soybeans 6.8 |
| Nebraska | 31.9 | 38% | Cattle 17.7, corn 7.9 |
| Texas | 30.7 | 23% | Cattle 13.8, dairy 4.0, broilers 3.7 |
| Kansas | 24.2 | 32% | Cattle 14.7, corn 3.3, wheat 1.7 |
| Illinois | 23.2 | 83% | Corn 10.3, soybeans 7.7 |
| Minnesota | 22.0 | 55% | Corn 5.9, soybeans 3.4, hogs 3.3 |
| Wisconsin | 15.4 | 29% | Dairy 7.0 |
| Indiana | 15.3 | 59% | Corn 4.5, soybeans 3.9, eggs 2.0 |
| North Carolina | 14.9 | 27% | Broilers 6.0, hogs 2.5 |
Source: USDA ERS, Farm Income and Wealth Statistics, data as of 3 September 2026, calendar-year 2024 cash receipts. Crops share is crop receipts divided by total receipts. These are sales, not profit.
What the top states grow and raise
Sales by state hide two different farm types. Illinois earns 83% of its receipts from crops, and California 73%. Texas earns 23% from crops, and North Carolina 27%, because livestock and poultry dominate there. The Corn Belt states of Iowa and Minnesota sit in the middle, with crops and animals each close to half.
Chart
Crop and livestock receipts, 2024
US$ billion, eight largest states by total receipts
The same data show where single products matter. Washington sold US$1.89 billion of apples in 2024, about two thirds of the US$2.84 billion national apple total. Wisconsin sold US$6.96 billion of dairy products, behind only California at US$8.62 billion. Kansas earned US$14.71 billion from cattle and calves, nearly twice what it earned from all its crops together (US$7.7 billion).
Crop-heavy states are exposed to grain prices and weather in one season. Livestock states are exposed to feed costs and herd cycles. A state with both, such as Iowa or Minnesota, can spread that risk, but it does not remove it.
The farm economy behind the ranking
The ranking sits on a changing sector. ERS reports 1.88 million US farms in 2024, down 8% from 2.04 million in the 2017 Census of Agriculture, and says total farm output nearly tripled between 1948 and 2023 on steady land and labour. For 2026 it forecasts inflation-adjusted net farm income to fall 5.5% from 2025 to US$158.4 billion (ERS, September 2026). A state at the top of the sales table can still have thin margins in a weak year, so look at costs as well as receipts.
In the ERS chart collection on farming and farm income, corn and soybeans made up 44% of US crop cash receipts in 2025. That is why the Corn Belt appears so often in the table above.
Which states have the most farmland
A ranking by land gives another answer. The USDA National Agricultural Statistics Service (NASS) estimated 873.95 million acres in farms across the US in 2025, on 1.865 million farms with an average size of 469 acres. Texas had 125 million acres, about 14% of the total and far ahead of any other state. Much of it is range and pasture, which helps explain why Texas ranks fourth on sales.
| State | Land in farms, million acres | Average farm, acres |
|---|---|---|
| Texas | 125.0 | 546 |
| Montana | 57.3 | 2,459 |
| Kansas | 44.6 | 814 |
| Nebraska | 43.9 | 995 |
| South Dakota | 42.2 | 1,496 |
| New Mexico | 38.6 | 1,874 |
| North Dakota | 38.5 | 1,571 |
Source: USDA NASS, Farms and Land in Farms, 2025 summary. Iowa has 29.9 million acres and California 23.6 million, so they rank high on sales per acre, not on area.
What farmland costs by state
If you plan to buy land, price per acre changes the picture. NASS reported that US cropland averaged US$6,020 per acre in 2026, up 3.3% from 2025. California cropland averaged US$18,430 per acre and Iowa US$10,700. Kansas averaged US$3,540, Texas US$2,790 and North Dakota US$2,800. These are survey averages for the whole state. A single field can sell far above or below them, and irrigated land sells for more than dryland.
Chart
Average cropland value per acre, 2026
US$ per acre, selected states; US average US$6,020
Land is a large financial decision. Get a local appraisal, check lease and tax rules, and ask a lawyer and a lender before you buy.
Water: where irrigation matters
Dry-season water decides which farm types a state can support. The NASS 2023 Irrigation and Water Management Survey counted 54.9 million irrigated acres in the US in 2022. California had 8.16 million, Nebraska 7.97 million, Arkansas 4.75 million, Texas 3.77 million and Idaho 3.17 million. Those five states hold about 51% of the total.
Irrigated acres explain part of the sales ranking. California and Nebraska are first and second on irrigated acres, and first and third on sales. For a grower, the questions are water rights, pumping cost and local limits on groundwater. These vary by state and by district, so check with your state water agency before you plan.
▶ Seven green farming technologies that save water, fuel and fertilizer. · 2:24
Best sustainable farming practices across the top states
Conservation practices are not spread evenly. The 2022 Census of Agriculture counted 18.0 million acres of cover crops in the US, 17% more than in 2017, according to a farmdoc daily analysis from the University of Illinois and Ohio State. Texas had the most (1.55 million acres) and Iowa was second (1.28 million). Thirteen states had more than 0.5 million acres each, and together they held 65% of the national total.
Chart
Cover crops as a share of US cropland
Percent of cropland in the 48 contiguous states, each year as a share of 2022 cropland
As a share of cropland, adoption is still low. Researchers writing in Choices magazine found cover crops on 4.7% of cropland in the 48 contiguous states in 2022, up from 4.0% in 2017 and 2.7% in 2012. By farm region the highest rates were in the Southern Seaboard (11.0%), the Northern Crescent (9.0%) and the Heartland (5.1%). The authors say the high rates are likely due to state cost-share programs for water quality in Delaware, Maryland, Virginia, Pennsylvania and Ohio.
The same paper reports that no-till barely grew: it rose by only 0.2% of 2022 cropland between 2017 and 2022. The authors counted counties where area fell between 2017 and 2022: 1,279 counties lost a total of 2.3 million acres of cover crops, and 1,261 counties lost 10.4 million acres of no-till.
What each practice does
Cover crops. The Sustainable Agriculture Research and Education program (SARE) describes them as plants grown mainly to slow erosion, improve soil health, hold water and smother weeds. Legume covers such as red clover or vetch can fix about 50 to 150 pounds of nitrogen per acre, depending on growing conditions, according to SARE.
No-till and reduced tillage. These leave residue on the surface and avoid turning the soil. The Choices authors cite research that one tillage pass can release carbon the soil stored over several years of no-till. They also report that cover crops and no-till are central to voluntary carbon farming programs in the US.
Other practices with US evidence
- Crop rotation. In a long-term rainfed no-till study in eastern Nebraska by USDA researchers, fertilized corn yielded 29% more in a two-year rotation than in continuous corn, and up to 48% more in a four-year rotation with a legume winter cover crop. It is one site, so test it locally.
- Windbreaks and buffers. The 2022 Census of Agriculture found 32,717 farms with agroforestry, such as windbreaks and riparian forest buffers, up 6% from 2017 (USDA Forest Service). Vermont had the highest share of farms (7.8%).
- Integrated pest management (IPM). The US EPA describes IPM as setting action thresholds, monitoring and identifying pests, and acting only when needed. Always follow the product label and local rules for any pesticide.
- Reduced tillage. No-till covered about 27.5% of US cropland in 2022 (Choices, from Census data), and stopped growing after 2017. Tillage can release stored carbon, so a return to tillage undoes years of work.
Choose practices to fit the problem on your own farm: erosion, nitrogen loss, weeds, pests, compaction or water.
What cover crops cost and return
A Penn State Extension article on cover crop economics cites one Corn Belt study where costs ranged from US$33 to US$70 per acre and economic benefits from US$37 to US$78 per acre. That is a close race. The article gives the lack of clear economic payback as probably the major reason adoption is only about 5% of US cropland. SARE says cover crops can pay off in year one when used for grazing or to manage herbicide-resistant weeds, while a payoff for compaction or nutrient management is more likely in the second or third year. If you change fertilizer or herbicide plans, follow the product label and local rules, and talk to your extension office or crop adviser first.
Public money can help. The Environmental Quality Incentives Program (EQIP) and the Conservation Stewardship Program (CSP) give farmers technical and financial help with land management practices, according to a Congressional Research Service comparison of the 2026 farm bill proposals. Rules and payment rates change by state and year, so check with your local USDA service center.
▶ Seven plain-English ways to protect soil and water on the farm, from cover crops onward. · 4:34
How to choose a state: five checks
- Name the product you will sell and find the top states for it in the ERS data. Buyers, processors and advice are close to where a product is grown.
- Check the farmland price for the state and compare it with the income per acre you expect, using the calculator below to test a change in practices.
- Ask about water. Look up irrigation limits, well rules and drought history for the county, not only the state.
- Look at conservation programs. EQIP, CSP and state cost-share schemes differ by state, so ask the local USDA service center what is open.
- Visit in more than one season. Talk to two or three farmers and an extension agent before you sign anything.
Starting a practice on your own fields
SARE advises choosing cover crops by your main goal first: nitrogen, organic matter, erosion control, weed control or nutrient scavenging. Then find the time in your rotation when the crop can grow, such as after small grains or before spring planting. Start on one field, record seed, planting and termination costs, and compare it with a field you manage the usual way. Keep photos and dated notes. After two or three seasons you will have your own numbers, which matter more than a state average.
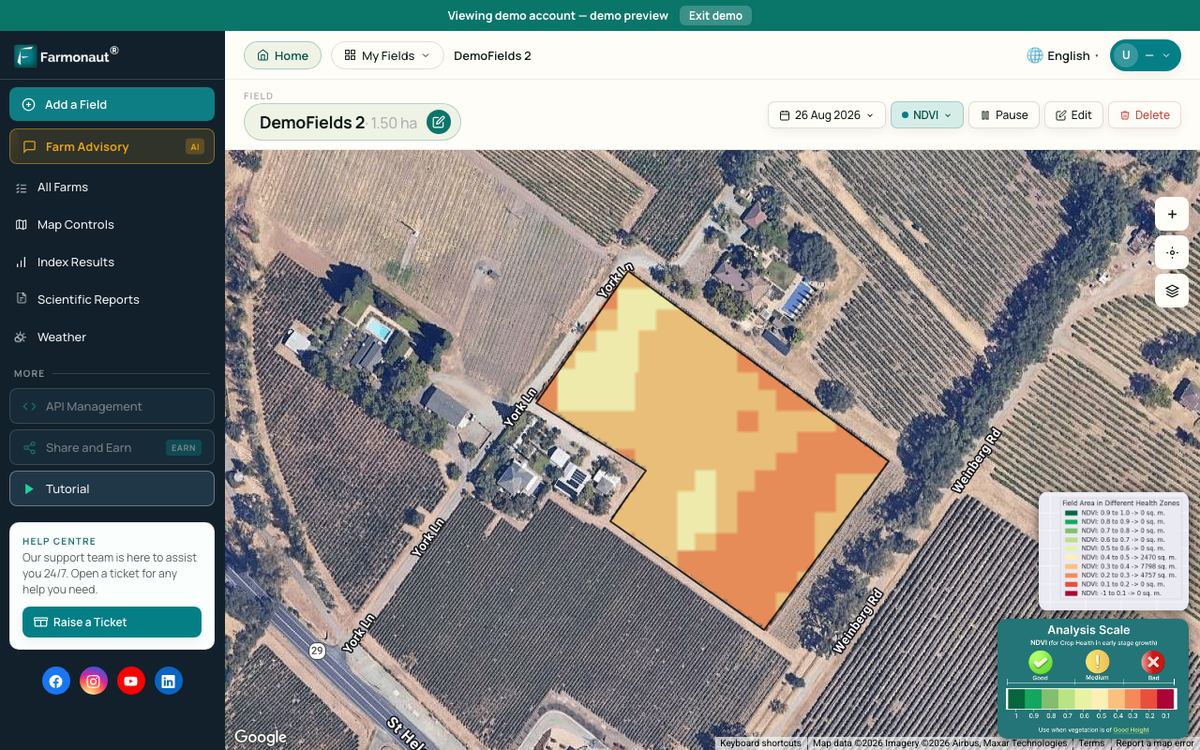
A satellite vegetation map of both fields during the season can show whether the covered field greens up earlier or more evenly. It does not replace soil tests or a field walk, but it gives you a dated record.
Try the numbers for your own farm below.
Calculator
Would a cover crop pay on my fields?
Enter your own costs, savings and yield. Add up only what you expect to see.
- Net result for the whole area (US$): -$2,500
- Savings and payments per acre (US$): $35
- Yield effect per acre (US$): $0
- Yield change needed to break even: 0.6 %
Example values only, not benchmarks or forecasts; they sit near break-even so you can see how each line moves the result. Costs and savings vary by farm and season. Penn State Extension cites one Corn Belt study with costs of US$33 to US$70 per acre and benefits of US$37 to US$78 per acre. Cost-share can come from EQIP, CSP or state programs; check what is open locally.
Which state is best for your type of farm
No state is best for everything. Use the data above to match the state to your goal.
- Row crops (corn, soybeans, wheat): Iowa, Illinois, Minnesota, Nebraska and Indiana lead on crop receipts in the Corn Belt. Land costs US$6,960 to US$10,700 per acre on cropland in Iowa, Nebraska and Illinois (NASS, 2026).
- High-value specialty crops: California (almonds, grapes) and Washington (apples) lead on their products. Cropland averaged US$18,430 per acre in California in 2026 (NASS).
- Cattle: Nebraska, Kansas and Texas earn US$13.8 to US$17.7 billion each from cattle and calves. Pasture averaged US$2,000 per acre nationally in 2026, against US$6,020 for cropland (NASS), so grazing land costs less than cropland.
- Dairy: California and Wisconsin lead, followed by Texas.
- Poultry and hogs: Iowa leads on hogs (US$9.0 billion), followed by Minnesota and North Carolina. Georgia (US$6.1 billion) and North Carolina (US$6.0 billion) lead on broilers.
- Starting small on low land cost: Plains states such as North Dakota and Kansas have lower cropland prices, but farms are larger: 1,571 acres on average in North Dakota and 814 in Kansas (NASS, 2025).
Markets, local rules and climate change from county to county. Visit farms in the area you are considering before you decide.
Use satellite monitoring in any state
Whatever state you farm in, regular field checks help you act earlier. Satellite vegetation maps show where crops grow unevenly, so you can walk those areas first. Farmonaut offers this through its web and mobile apps. A map shows a change in plant growth, not its cause, so confirm the cause in the field.

▶ Six plain steps to start precision farming with satellite field maps. · 4:18
How we checked the numbers
State sales come from the USDA ERS state-level data file released on 3 September 2026, using calendar-year 2024. Land in farms comes from the NASS 2025 summary, farmland prices from the NASS Land Values 2026 summary, and irrigated acres from the NASS 2023 Irrigation and Water Management Survey. Conservation practice data come from the 2022 Census of Agriculture as analysed by university economists. Each source is listed at the end of the article. Sales are ERS estimates and can be revised.
FAQ
What is the best farming state in the US?
By farm cash receipts, California is first with US$61.9 billion in 2024, followed by Iowa and Nebraska. By farmland area, Texas is first with 125 million acres. The best state for you depends on your crop, budget and climate.
What are the best sustainable farming practices?
The practices with national adoption data in this guide are cover crops and no-till; the 2022 Census of Agriculture counted both. Cover crops were planted on 4.7% of cropland in the 48 contiguous states in 2022. Costs and returns vary by farm, so test on a small area first and check local advice.
Which states have the most cover crops?
Texas had 1.55 million acres and Iowa 1.28 million in the 2022 Census of Agriculture, the two largest. By share of cropland, the Southern Seaboard (11.0%) and Northern Crescent (9.0%) farm regions had the highest rates.
Which state has the cheapest farmland?
Among the states shown in this guide, Texas (US$2,790 per acre), North Dakota (US$2,800) and Kansas (US$3,540) had the lowest average cropland values in 2026 (NASS). Price depends on soil, water and location, so compare real listings.
Which state irrigates the most land?
California, with 8.16 million irrigated acres in 2022, followed by Nebraska with 7.97 million (NASS irrigation survey).
Conclusion
California, Iowa and Nebraska lead on sales, Texas on land, and California on price per acre and irrigated area. Conservation practices are growing slowly, and the payback can take a few seasons. Choose the state for the product you want to sell, then pick the practices that fix the problems on your own fields.
Related pages on our site: corn yield by state, agricultural land use types, organic farming methods, crop loan and insurance page, farm admin app, carbon footprinting, product traceability, fleet management, satellite and weather API docs and the satellite API.
Farmonaut crop monitoring
See your own fields from space
Draw your fields once and view satellite vegetation maps for them through the season, on web, Android or iOS.



Keep reading

Sources
- USDA ERS, Farm Income and Wealth Statistics: US and state-level data files (September 2026 release): ers.usda.gov
- USDA ERS, Ag and Food Statistics: Charting the Essentials, Farming and Farm Income (September 2026): ers.usda.gov
- USDA NASS, Land Values 2026 Summary (July 2026): nass.usda.gov
- USDA NASS, Farms and Land in Farms 2025 Summary: nass.usda.gov
- USDA NASS, 2023 Irrigation and Water Management Survey (2022 Census of Agriculture, Volume 3): nass.usda.gov
- USDA NASS, 2022 Census of Agriculture, list of reports and publications: nass.usda.gov
- Zulauf, Schnitkey, Paulson and Coppess, Cover Crops and Covered Cropland, 2022 US Census of Agriculture, farmdoc daily (University of Illinois, 2024): farmdocdaily.illinois.edu
- Plastina, Sawadgo and Okonkwo, Pervasive Disadoption Substantially Offsets New Adoption of Cover Crops and No-Till, Choices (2024): choicesmagazine.org
- SARE, Cover Crops for Sustainable Crop Rotations: sare.org
- Penn State Extension, Economics of Cover Crops (updated October 2023): extension.psu.edu
- Congressional Research Service, The 2026 Farm Bill: Comparison of the House and Senate Bills with Current Law (R48918): everycrsreport.com
- University of Nebraska-Lincoln CropWatch, More Diverse Crop Rotations Improve Yield, Yield Stability and Soil Health (USDA ARS authors, 2021): cropwatch.unl.edu
- Kellerman et al., Agroforestry across the United States: Results of the 2022 Census of Agriculture, Agroforestry Systems (USDA Forest Service, 2025): research.fs.usda.gov
- US EPA, Integrated Pest Management (IPM) Principles: epa.gov
Discussion
Questions, corrections or field experience? Share them below. First-time comments are reviewed before they appear, and your email is never published.
No comments yet. Be the first to add a question or your experience.

 Sun Palm Australia
 Grandstream Algérie
 XOS Realty
 Geospatial Lab Africa
 KhetiBuddy
 Agro La Gándara
 HIPSAC
 ZOL Zimbabwe
 Juligerm
 AdBio
 MISE Maroc
 NWNS
 Red August Group
 Farm Inc
 WeMe Global
 Agrotoken
 Blue BearX
 Insignito
 Croptimum
 DnCubed

 Licence holder · Niger · Gold
 Licence holder · Nigeria · Gold + lithium










