

Precision farming · Guide for agronomists
Digital Agronomy: What It Is, Tools, Costs and Evidence
Digital agronomy means managing crops and soil from measured data such as satellite images, soil sensors and yield maps. In 2025, 22% of US farms used precision agriculture practices (USDA NASS). USDA estimates of the profit gains on corn farms are modest, at 1.1% to almost 3%.
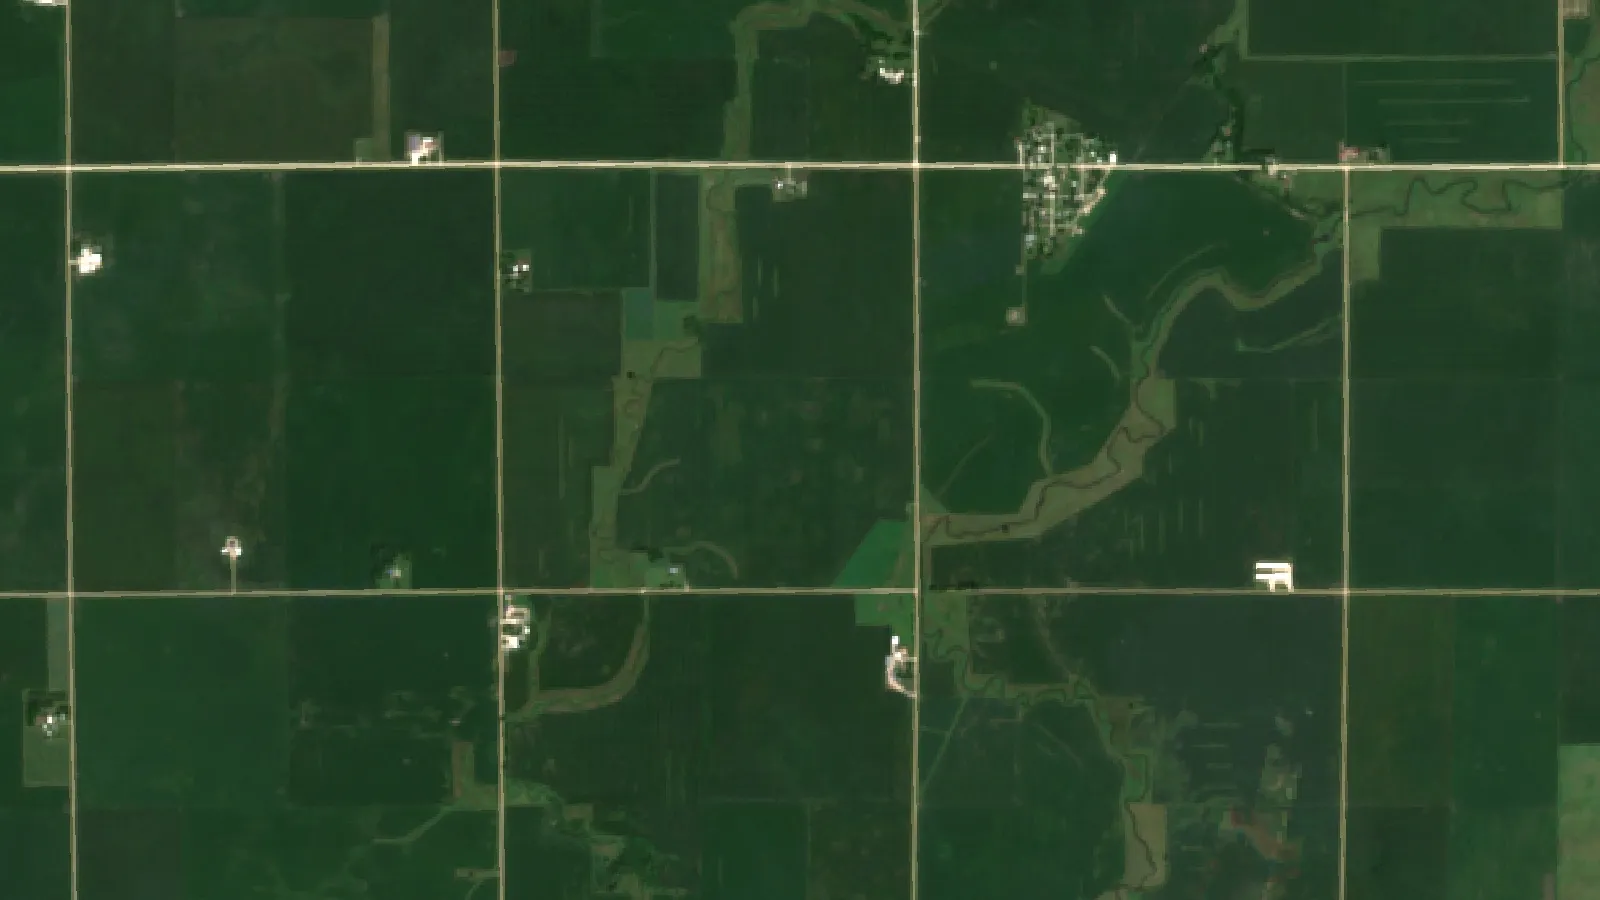
Key takeaways
- Digital agronomy is the crop and soil part of digital farming; digital farming also covers machinery, business records and supply chains.
- 22% of US farms reported precision agriculture practices in 2025, against 27% in 2023, with 50% in North Dakota and 14% in Texas (USDA NASS).
- USDA ERS estimated operating profit gains on average-sized corn farms of almost 3% for GPS mapping, 2.5% for guidance and 1.1% for VRT (2016 study).
- Satellite images show that part of a field differs, not why, so a field visit and a strip trial remain part of the method.
In this article
Digital agronomy is crop and soil management based on measured data: satellite and drone images, soil sensors, yield maps and weather records, read in software to decide what to apply, where and when. In the USDA NASS Technology Use report of August 2025, 22% of US farms said they used precision agriculture practices, down from 27% in 2023.
This guide is written for agronomists, crop consultants and farm managers. It separates the term from digital farming, lists seven uses with what the evidence shows, gives dated equipment costs from USDA, and includes a calculator to test whether a tool pays on your own acres.
What is digital agronomy?
Agronomy is the science and practice of crop production and soil management. It draws on biology, chemistry, ecology and economics to improve soil health, plan rotations, manage pests and diseases, schedule irrigation and time the harvest. An agronomist has always worked from evidence, but much of that evidence came from field walks and soil tests taken at intervals.
Digital agronomy keeps the science and adds more frequent, mapped measurements. The agronomy question stays the same: why is this part of the field different, and what should we do about it? The change is that the agronomist can see the difference across every field, compare it with past seasons and direct a field visit to the right spot.
Most systems have four layers:
- Collect. Satellites, drones, soil probes, weather stations and yield monitors record what is happening.
- Combine. Software lines the records up by location and date, usually on a field map (GIS).
- Interpret. Models or an agronomist turn the layers into a likely cause and a proposed action. AI can help sort images and flag unusual areas.
- Act and check. A person scouts the area, changes a rate or a schedule, and then checks the result against yield data.
The last layer is the one people skip. A map on its own changes nothing. It earns its cost when it alters a decision, and the only way to know that is to compare treated and untreated strips at harvest.
A digital agronomist’s job in plain terms
A digital agronomist is an agronomist or crop adviser who works with these data layers. Typical tasks include building management zones, writing variable-rate prescriptions, checking yield data for errors, running on-farm trials and explaining the results to the grower. The title varies by employer, and the agronomy knowledge still matters more than any one software package.
Digital agronomy vs digital farming
The two terms overlap, and vendors often use them as if they were the same. A useful split is by scope. Digital agronomy concerns the crop and soil. Digital farming covers the whole business, including machinery, records, finance and sales. Precision agriculture sits between them and refers mainly to location-based tools on machinery.
| Term | Main question | Typical tools | Usual user |
|---|---|---|---|
| Agronomy | How do we grow this crop well on this soil? | Soil tests, scouting, trials, rotations | Agronomist, grower |
| Digital agronomy | What does the data say this part of the field needs? | Satellite images, soil sensors, yield maps, zone software | Agronomist, consultant, grower |
| Precision agriculture | How do we apply it in the right place? | GPS guidance, section control, variable-rate equipment | Operator, farm manager |
| Digital farming | How do we run the whole farm from data? | Farm records, fleet tracking, traceability, automation | Owner, manager, buyer |
The terms “digital farm” and “agronomy farm” follow the same logic. A digital farm relies on connected tools and records. An agronomy farm is run around sound soil and crop science. These are not rival camps: a farm with good data and poor agronomy will simply make its mistakes more precisely.
Much of the machine side depends on satellite positioning, and our guide to GPS systems for agriculture covers what the main receivers do.
How widely are these tools used?
Use is uneven. The NASS survey asks whether a farm used precision agriculture practices to manage crops or livestock in the past 12 months. The national share was 27% in 2023 and 22% in 2025, while North Dakota, Iowa, Illinois, Nebraska and South Dakota report about twice the national share or more (41% to 50% in 2025). That survey counts all farms, including many small ones, so it reads lower than acreage-based numbers.
Chart
Farms using precision agriculture practices
Percent of all farms, selected states and US total
Acre-based figures tell a different story. The USDA Economic Research Service report on digital agriculture adoption (2023) found guidance systems on 58% of planted corn acres in 2016, up from 5.3% in 2001. Its most recent crop surveys ran from 2013 to 2019, so these are the last detailed crop figures it provides, not a picture of today.
The same report found that at least half of relatively large row crop farms used yield maps, soil maps, variable-rate technology (VRT) or guidance. Below that, in the smallest fifth of farms by acreage, fewer than 25% used any of the four, cotton aside. Soil maps stayed under 25% of planted acres in every crop surveyed.
Connection is not the main gap, though it is not solved, and the internet share did not change between surveys (85% in both 2023 and 2025). NASS found 85% of farms had internet access in 2025, 82% had a smartphone and 55% used broadband. The share buying farm inputs online rose from 32% in 2023 to 50% in 2025.
Outside the US, comparable surveys ask different questions. In England, Defra’s Farm Practices Survey (October 2019) found the most common reasons for using precision techniques were higher productivity or performance (78%), better accuracy (59%) and lower input costs (55%).
Chart
How US farms connect and use technology
Percent of all farms, 2025
Seven uses of digital agronomy, with the evidence
The list runs from the cheapest place to start to the uses that need the most data or outside demand. Each entry says what the tool is good for and where to be careful.
Chart
Variable-rate technology by crop
Percent of planted acres, latest USDA survey for each crop (2016 to 2019)
1. Crop monitoring from satellite images
Best for: consultants and managers covering many fields.
The European Sentinel-2 mission samples 13 spectral bands, four of them at 10 m resolution, and is designed to revisit every five days at the Equator. A 10 m pixel is too coarse to see one plant, but it does show patterns across a field. Clouds can still block any given pass.
The common layer is NDVI. The US Geological Survey explains NDVI as a measure of vegetation greenness, useful for understanding density and changes in plant health. It shows that something differs, not why. Water stress, a nutrient shortage, disease, a planter fault and a soil change can look alike, so an image should send someone to the field, not replace the visit. Our piece on satellite NDVI explains the index further.
2. Irrigation scheduling and variable-rate water
Best for: irrigated farms with uneven soils and a real water or energy cost.
Soil moisture probes, weather data and crop models can estimate when and how much to irrigate. Sensors need care. University of Arizona Extension guidance says soil texture and salinity should be considered, and that capacitance sensors should be calibrated for specific soil types.
Results depend on the season. In a West-Central Nebraska center pivot study (2017 and 2018), satellite-driven variable-rate irrigation showed no significant difference in planned water in 2017 (351 mm against 344 mm for uniform). In 2018 it prescribed less (265 mm against 282 mm at full irrigation). Yield did not differ significantly between treatments in either year. That is one site, but it is a fair reminder to measure the gain before paying for it.
3. Variable-rate fertilizer and seed
Best for: fields with mapped, repeatable differences in soil or yield.
VRT applies different rates in different zones. The zones usually come from soil tests, yield maps, soil electrical conductivity or several years of imagery. USDA data show use varies a lot by crop, from 37.4% of corn acres in 2016 to 13.9% of sorghum acres in 2019 among the five crops shown.
Prescriptions are only as good as the soil data behind them. Any fertilizer rate should follow local soil tests, crop adviser guidance and local nutrient rules, including any limits near water.
4. Pest and disease scouting
Best for: directing scouts to the right part of a large field.
Disease models use weather records to estimate infection risk, and images can flag areas that are falling behind the rest of the field. Neither identifies a pest with certainty. The decision still rests on someone looking at the plant and comparing the count with a local treatment threshold. Check the product label and local rules before any application, and take professional advice where resistance is a concern.
5. Field records and farm management platforms
Best for: teams, consultants with many clients and farms facing record-keeping demands.
A farm management platform holds field boundaries, inputs, operations and yields in one place. This is less exciting than AI, but it is what makes every other use possible. Without clean records of what was applied and where, a yield map cannot tell you whether a change worked. Consultants also gain from a shared record, because the grower and adviser see the same history.
Check who controls the data before signing. In Australia, the National Farmers’ Federation Farm Data Code gives growers a yardstick for judging how providers collect, use and share farm data. It is also a useful checklist for readers elsewhere.
6. Traceability for buyers
Best for: growers selling into contracts or markets that ask for proof of origin or practice.
Traceability systems log where a batch came from and how it was handled. Some use blockchain, while many buyers simply need well-kept digital records. Start with what your buyer asks for. The tool is worth paying for when it opens a market or protects a premium, and it adds little when no buyer will ever check it.
7. Environmental and carbon records
Best for: farms in a sustainability program or carbon scheme, or reporting to a buyer.
Fuel, fertilizer and water records can be turned into an estimate of a farm’s footprint. The figures are estimates, and each program sets its own method and proof. Read the rules before collecting data, because a scheme may require records you cannot rebuild afterward. Legal and tax questions about any credit payment need professional advice.

▶ A step-by-step tutorial on monitoring a farm with satellite images and crop health indices in a web app. · 8:43
Does digital agronomy pay?
A USDA study estimated modest gains, and they vary by farm. The USDA ERS study of corn farms (2016) estimated these effects for a farm of average size:
| Technology | Operating profit | Net returns |
|---|---|---|
| GPS mapping | Almost +3% | Almost +2% |
| Guidance systems | +2.5% | +1.5% |
| Variable-rate technology | +1.1% | +1.1% |
These are small but positive numbers, and they are worth more on a large area. The study also found hired labor costs 60 to 70% lower with any of the three technologies on small corn farms (140 to 400 cropland acres), while hired labor costs were higher on large farms using mapping and guidance. It uses 2010 survey data on corn, so treat it as a guide and not a promise for your crop.
Costs are the other side of the sum. These USDA figures are farm-level averages from 2018 and 2019 survey data, in US dollars. They are survey averages, not list prices, and today’s prices will differ.
| Technology | Cost type | Soybeans, 2018 | Cotton, 2019 |
|---|---|---|---|
| Yield monitor | Equipment replacement | US$8,051 | US$13,775 |
| Yield monitor | Annual fee | US$1,041 | US$1,772 |
| VRT | Equipment premium | US$5,630 | US$10,319 |
| Guidance | Equipment replacement | US$20,165 | US$25,168 |
| Guidance | Annual fee | US$1,154 | Not surveyed |
| Drone, aircraft or satellite | Equipment replacement | US$2,610 | Sample too small |
The barriers are well documented. The Government Accountability Office report of January 2024 names high up-front costs, unresolved data sharing and ownership questions, and a lack of standards. A DTN summary of that report adds that farmers said easy tools spread faster than those that need a lot of data handling. Use the calculator below to run your own numbers.
Try the numbers for your own farm below.
Calculator
Would a digital agronomy tool pay on your acres?
Enter your own numbers. The result is what the tool would add or lose each year.
- Benefit per acre (US$): 2.90
- Net per acre (US$): -0.10
- Revenue gain needed to break even, with these savings: 0.21 %
Example values only, set near break-even. They are not benchmarks or forecasts. All costs and percentages are your own inputs; check them with a strip trial and your adviser.
How to start with digital agronomy
Begin with one decision you already make, then add data only where it changes that decision.
- Name the decision. For example: where to scout first, what nitrogen rate to use in the poor corner, or when to run the pivot.
- Draw accurate field boundaries. Almost every tool depends on them.
- Gather what you own. Old soil tests, yield files and application records often go unused.
- Add a low-hardware layer. Satellite monitoring needs no equipment on the farm, so it is a low-risk way to look for patterns across seasons.
- Ground-truth every signal. Visit flagged areas, take photos and note the true cause. This builds trust and trains your eye.
- Run a strip trial. Leave a check strip whenever you change a practice, then compare yield at harvest.
- Review the sum each year. Keep tools that changed a decision and paid for themselves, and drop the rest.
Questions to ask any software provider
- Which data sources does it use, and how often do they update for my area?
- Can I export my raw data and boundaries in a standard format if I leave?
- Who else can see or use my data, and can I withdraw it?
- Does it work with the monitors and controllers I already own?
- Has its advice been tested for my crop and region, and by whom?
- What is the full yearly cost per acre, including support and any hardware?
▶ Six plain steps to start precision farming, with no robot needed. · 4:18
What is changing in digital agronomy
Four changes matter more than the headlines about robots.
- Regular imagery. Sentinel-2’s design revisit of five days at the Equator gives farms and advisers a regular view at field scale with no equipment on the farm.
- Better sorting by AI. AI is useful for ranking fields and flagging outliers. Its advice still needs checking against local conditions and trials.
- Combined technology. USDA found that precision tools are often used together, so compatibility between systems matters when you buy.
- Data rules. Standards and data ownership remain open issues in the GAO report, so contracts deserve a careful read.
Rural connections, training and standards remain real limits. Adoption also does not rise in a straight line, as the 2023 and 2025 NASS results show, so a sensible plan assumes gradual, tested change.
▶ An overview of how precision technology and AI are used in farming. · 23:42
Where Farmonaut fits
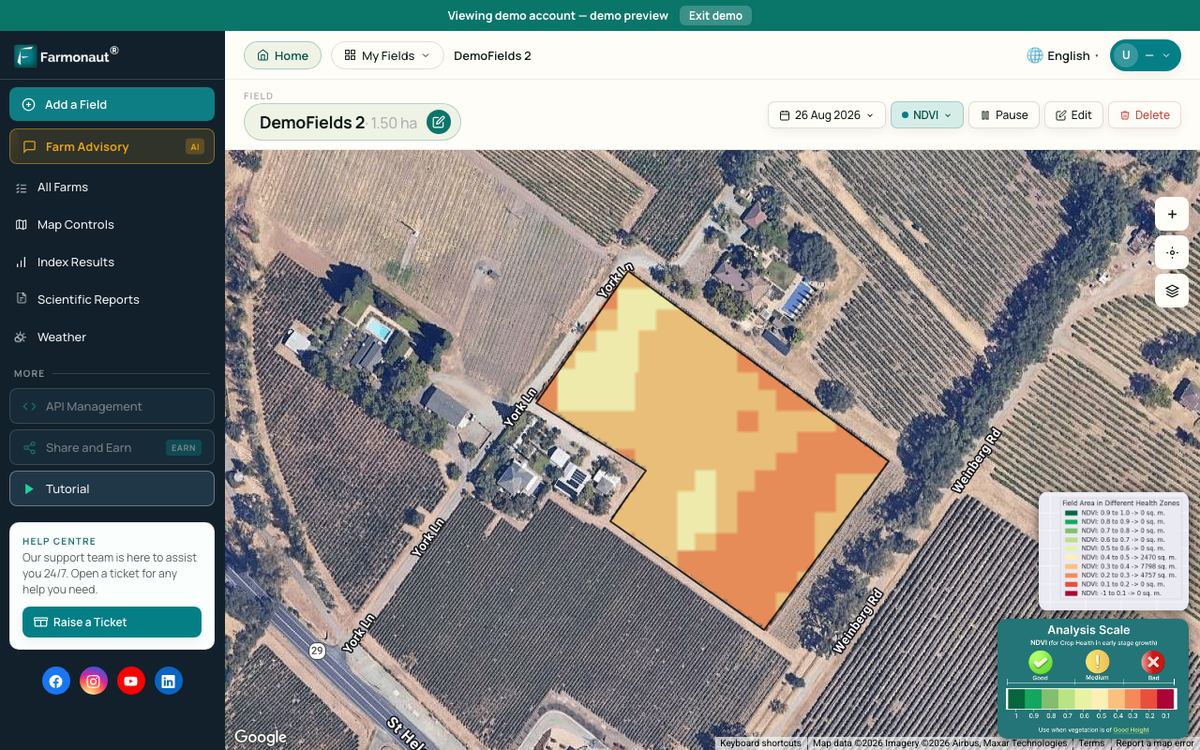
Farmonaut Satellite + AI Farm Monitoring System is one option for the monitoring layer: it shows satellite vegetation maps of the fields you draw, on web, Android and iOS, with no hardware on the farm. Developers can bring the same data into their own tools through the satellite and weather API documentation. Like any image-based tool, it points to where to look, and the agronomist decides what is wrong and what to do.
Related pages on our site: product traceability; carbon footprint tracking; farm machinery tracking; sustainable resource management steps; field team management for agribusinesses; satellite checks for crop loans and insurance; crop monitoring market and technology; crop monitoring web app.
FAQ
What is the difference between digital agronomy and digital farming?
Digital agronomy is about data-based decisions on crops and soil. Digital farming is wider and also covers machinery, business records, supply chains and automation. A digital farm usually includes digital agronomy, but the reverse need not be true.
What does a digital agronomist do?
A digital agronomist uses imagery, soil data and yield maps alongside normal crop knowledge. Common tasks are building management zones, writing variable-rate prescriptions, cleaning yield data, running trials and explaining results to growers.
Is digital agronomy only for large farms?
No, but large farms use it more. USDA ERS found fewer than 25% of the smallest row crop farms used yield maps, soil maps, VRT or guidance, cotton aside, possibly because the returns are greater on larger farms. Tools with no on-farm hardware lower the entry cost for smaller farms.
Which crops can use digital agronomy?
Satellite and record tools can be used on row crops, orchards, vineyards, vegetables and pasture. The evidence is uneven, though. USDA’s adoption data cover row crops, and it reports no national adoption data for specialty crops or livestock.
How much does digital agronomy increase yield?
No single figure holds across crops and regions. USDA ERS estimated profit gains of 1.1% to almost 3% on corn farms, and a Nebraska pivot study found no significant yield change from variable-rate irrigation. A strip trial on your own field is the fairest test.
Farmonaut crop monitoring
Check your fields or your clients' fields from space
Draw your fields once and Farmonaut shows satellite vegetation maps through the season, on web, Android or iOS, so you can plan where to scout.


Keep reading

Sources
- USDA NASS, Technology Use (Farm Computer Usage and Ownership), August 2025: esmis.nal.usda.gov
- USDA ERS, Precision Agriculture in the Digital Era, EIB-248 (2023): ers.usda.gov
- USDA ERS, Farm Profits and Adoption of Precision Agriculture, ERR-217 (2016): ers.usda.gov
- US GAO, Precision Agriculture: Benefits and Challenges, GAO-24-105962 (January 2024): gao.gov
- DTN, These 5 States Top List of Those That Embrace Precision Ag (2024): dtnpf.com
- Defra, Farm Practices Survey, October 2019, general statistics notice: assets.publishing.service.gov.uk
- Copernicus SentiWiki, Sentinel-2 mission: sentiwiki.copernicus.eu
- USGS, Landsat Normalized Difference Vegetation Index: usgs.gov
- University of Arizona Extension, Guidance on soil moisture sensor selection: extension.arizona.edu
- Variable Rate Irrigation of Maize and Soybean in West-Central Nebraska (peer-reviewed study, PMC): pmc.ncbi.nlm.nih.gov
- National Farmers’ Federation, Australian Farm Data Code: nff.org.au
Discussion
Questions, corrections or field experience? Share them below. First-time comments are reviewed before they appear, and your email is never published.
No comments yet. Be the first to add a question or your experience.

 SFX
 BACF Africa
 Nivia
 Doodlakine
 Exurbia Geospatial
 FieldZero
 Indico Company
 Kubota
 FFBS
 Jontra
 Tucor
 Hayleys Agriculture

 Licence holder · Niger · Gold
 Licence holder · Nigeria · Gold + lithium
 Client · Tanzania · Gold










