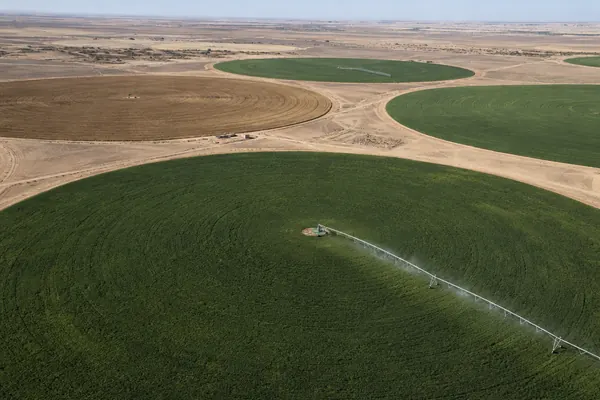
less water than running the sprinklers every day, on a 190-acre wheat, barley, oats and alfalfa farm.

Satellite Crop Monitoring & AI Farm Advisory
975,000+ acres monitored. 107,000+ fields mapped by customers in 135 countries.
Satellite crop monitoring that sees every field, every few days.
Farmonaut turns satellite imagery into actionable insights for every field. It reads what satellites see and tells you, field by field, how much water your crops need, which nutrients are lacking, and where pests or diseases may be emerging. It is agriculture software for remote crop monitoring, a crop monitoring app and precision agriculture software in one: map your fields once, from a phone or a browser, and the advice arrives every few days.
- No sensors in the ground.
- No drones to fly.
- No field visits.
Just satellite data, turned into decisions.


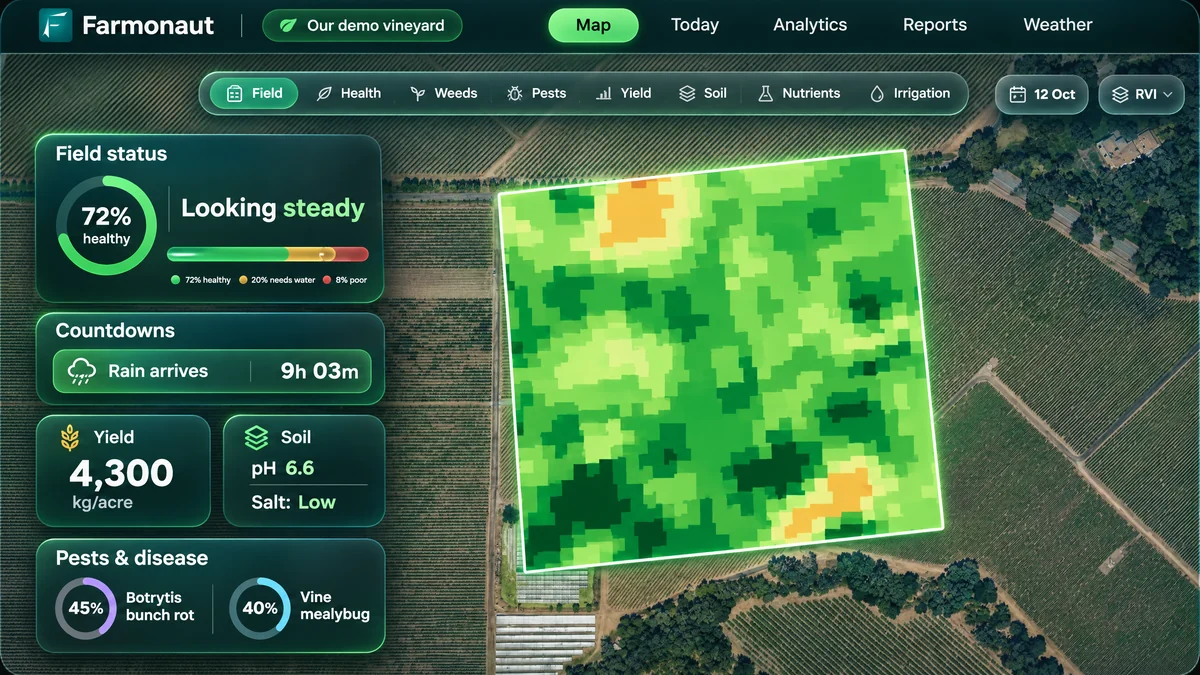
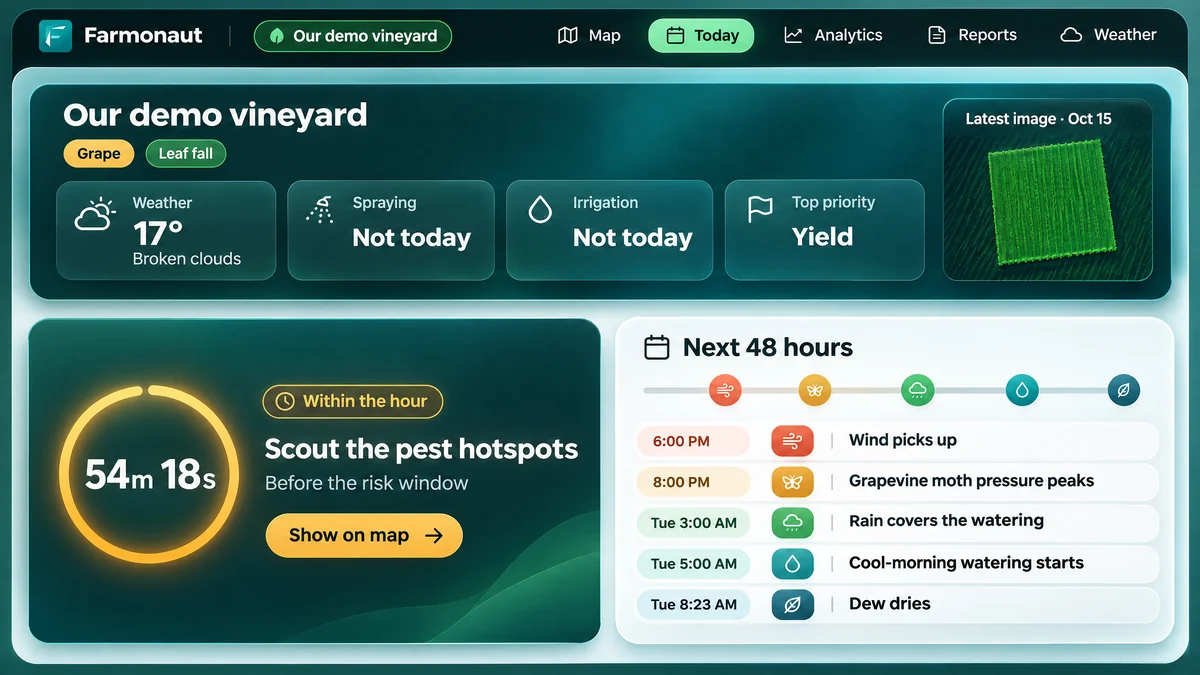
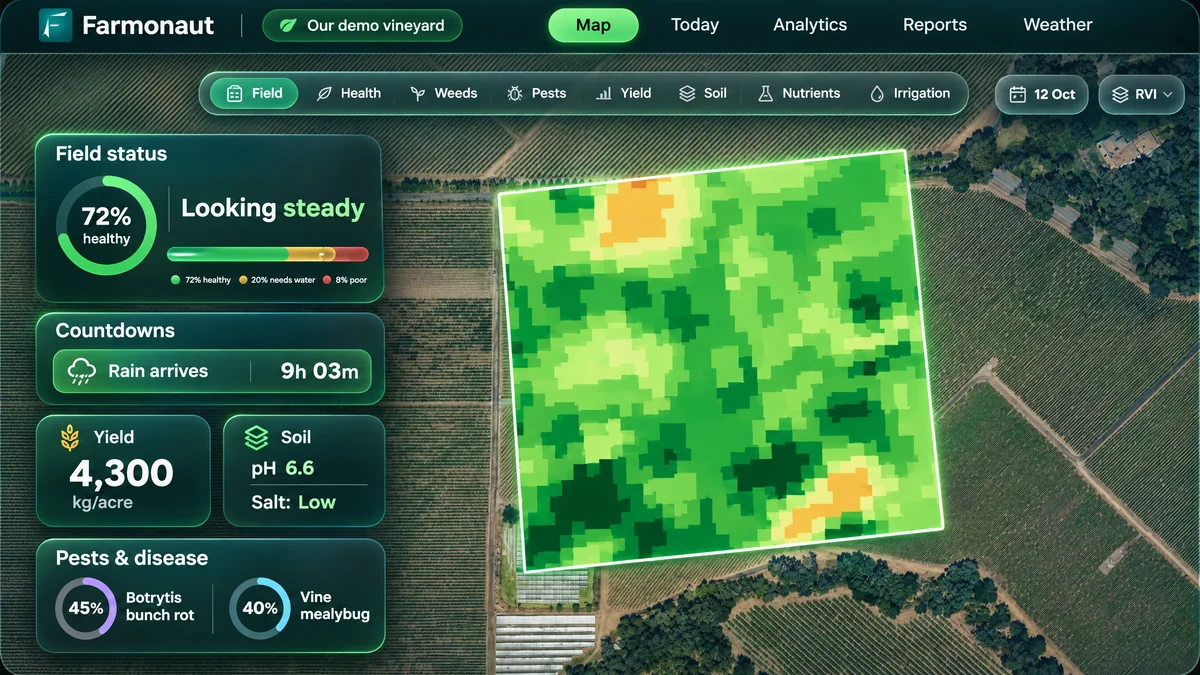
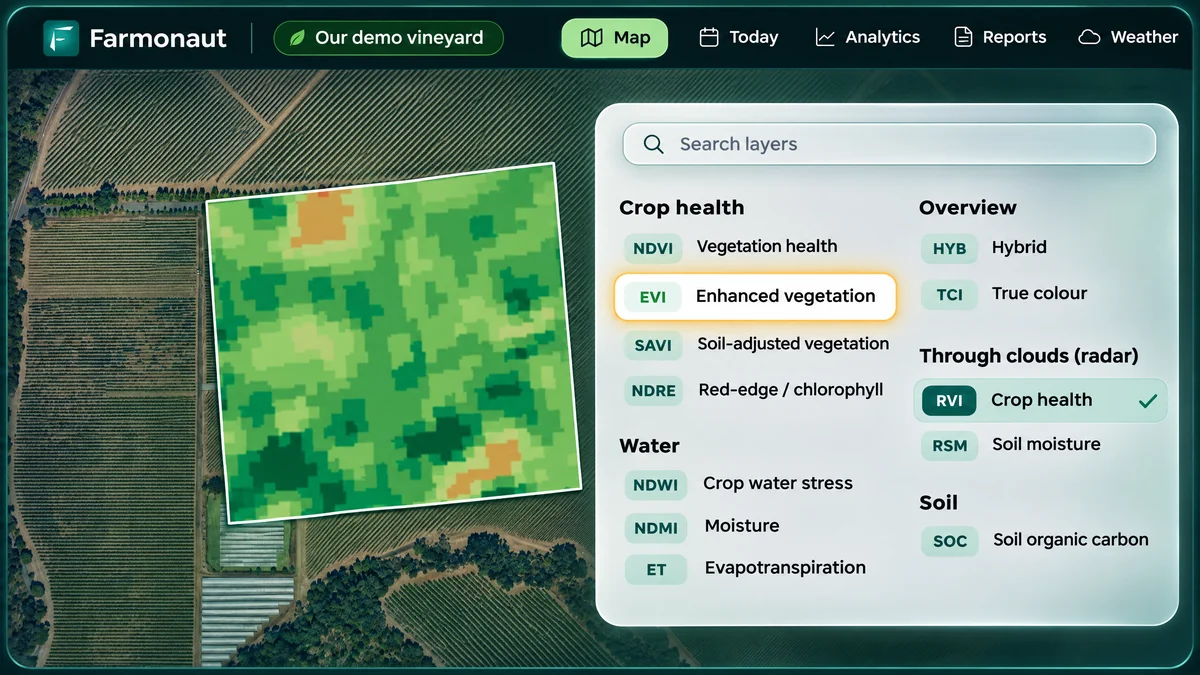
The real product, redrawn for clarity from our demo field: the map you draw a field on with its farm advisory, and the Today page that turns it into what to do next.
They watered less, and fed only what the crop needed.
Their own estimates, checked against what their reports recommended.
- 50โ70%better irrigation decisionsMaize grower ยท northern Kenya
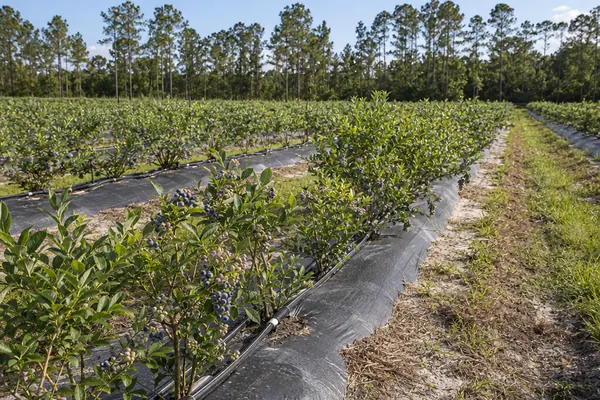
- 30โ50%less water and fertilizerJohn Vansickle ยท blueberries, Florida
- 70%+better fertilizer useAGROEX Consultancy, and the Kenyan maize grower
- 43%less water than daily wateringAgroGreen Dynamics ยท Nigeria
- 34%less fertilizer spent in the wrong placeAgroGreen Dynamics ยท Nigeria
Water, feed, protect โ and the money is in the days it says stop.
Four fields, four crops, four different answers. Teal squares are millimeters of water; cream squares say do not water.
17 of 28 field-days say stop โ 51% less water than running the sprinklers every day.
In their words
Every percentage is the customerโs own estimate, shared through the appโs feedback form โ then checked against what their reports actually recommended.
โGreat app helps me in the field.โโ 5-star app-store review
- 124 acres ยท 25 blocks
- No water on 78 of 175 block-days
- No fertilizer on 8 of 25 blocks
โFarmonautโs report helped me optimize my irrigation.โโ From his feedback-form answers
- 190 acres ยท 4 crops
- 51% less water than daily watering
- 40 acres switched off for the week
โWith Farmonautโs reports we optimized irrigation by 30โ50% and fertilizer use by more than 70% โ and acted on pests, disease and weeds.โโ From their feedback-form answers
- 10 crops ยท 15 fields ยท 630 acres
- 181 reports in 75 days
- 39 crop-correct pest warnings
โFarmonautโs reports helped us optimize both irrigation and fertilizer by 30โ50% โ and act on pests, disease and weeds.โโ From their feedback-form answers
- Maize, sesame, groundnut, okra
- 43% less water than daily watering
- 34% less fertilizer in the wrong place
โI check my cropโs general health and irrigation status with the reports. The Farm Advisoryโs Organic Fertilizer Management has helped me a lot โ Iโve seen improvement since using Farmonaut!โ
- Lucerne + French bean pivots
- 88.7 acres under pivot
- 564 advisories since Nov 2024
โFarmonaut helped me optimize irrigation by 50โ70% and fertilizer by more than 70% โ and act on pests, disease and weeds.โโ From their feedback-form answers
- Irrigation decisions 50โ70% better
- Fertilizer decisions over 70% better
- 4 satellite visits, before emergence
The line under each card is what we found. Where a customer answered our feedback form rather than writing a review, their comment is written from those answers and says so โ read every full write-up at farmonaut.com/case-study.
These farmers started with one field each. See what the same reading says about yours.
Analyze your farm โWe turn every field into clear instructions, every few days โ water in millimeters, fertilizer in kilograms, pest risk with a probability โ using satellite data and AI, with no sensors, drones or field visits.
One farmer. 25 blocks of blueberries. One consultancy. 10 crops across 3 countries.
Different farms need different answers. Here are two real examples of how Farmonaut is being used to make those decisions clearer. Both are published in full at farmonaut.com/case-study.

He could have watered every day. The report told him not to.
This 190-acre farm grows durum wheat, barley, oats and alfalfa. Each field was monitored separately, taking into account the crop, its stage of growth, soil conditions and weather. Over one week, the recommendations were different for every field. Some needed water. Others needed less as harvest approached. Fields that were already finished were told not to water at all.
The result was simple: instead of running the sprinklers every day, the farmer had a schedule showing exactly how much water each field needed โ and which days to leave the sprinklers off.
This is the case that reads across to anywhere water is pumped and expensive โ California, Spain, Australia, the Texas High Plains.
This is what field-level monitoring changes: you donโt get one irrigation recommendation for the farm. You get the right recommendation for each field, on each day.
He confirmed in our in-app feedback form (May 2026) that the report helped him water better. The 51% figure comes from his own seven-day schedule compared against watering every day.
Read the full case study โ20 more case studies from six continents.
Customer feedback, monthly renewals and what the advisories found โ from Kenyan maize and Illinois corn to Greek olives, Western Cape avocados and a 93-field farm in Tajikistan. Every card links to the full case study at farmonaut.com/case-study.
Three plots, a plan before emergence
Maize
Read the case studyCorn first โ then an apple orchard in Canada
Corn, soybean, apple
Read the case studyThree mango blocks under watch
Mango
Read the case studyA grower-to-grower referral
Blueberry
Read the case study18 avocado fields on one account
Avocado
Read the case studyA cool-climate Pinot vineyard
Wine grapes
Read the case studyWater planned where it rains 8 mm a year
Mango, table grapes
Read the case studyWater planned for a dry-country orchard
Almond, pistachio
Read the case studyYoung oil palm, beetle risk scored every time
Oil palm, durian
Read the case studySeven groves, three growers
Olive
Read the case studyDisease caught when nobody was looking
Blueberry
Read the case studyDisease risk read from the stubble
Winter wheat
Read the case studyTurf watched like a crop
Turf
Read the case studyOne orchard at harvest, nine in bloom
Apple
Read the case studyA large farm, triaged weekly
9 crops
Read the case studyWhen to harvest, from orbit
Corn
Read the case studyRadar saw the canopy through cloud
Pine
Read the case studyA blueberry group on one platform
Blueberry
Read the case studyAn Amazon palm nursery, pass by pass
Oil palm nursery
Read the case studyA multi-crop Tunisian farm
Almond, pistachio, olive, lemon
Read the case studyBy the time a field looks unhealthy, yield loss may have already begun.
Healthy crops absorb red light for photosynthesis and reflect near-infrared light โ a part of the spectrum our eyes cannot see. When plants come under stress, their near-infrared response changes before visible signs appear.
Satellite crop health monitoring reads that change across every 10 meters of every field, on the same schedule, whether or not anyone had time to walk it this week โ when there is still time to act.
A healthy leaf
Soaks up red light to feed itself, and throws almost all the hidden light straight back.
A struggling leaf
Stops feeding, so it reflects more red and much less hidden light. This change shows first.
The fortnight you lose
A scout walks one line across a block. The satellite reads the whole field. The hidden-light reading falls about two weeks before the color changes โ that gap is where yield is saved or lost.
Schematic, to show the idea โ not measured data.
Watch the fortnight on a real field
What the hidden-light reading does in the two weeks before the color changes โ and why walking the field cannot close that gap on its own.
Crop monitoring software that tells you what to do โ for every field.
Every few days, Farmonaut turns satellite imagery, field history and local conditions into clear answers. You see whatโs changing, how much it matters and what needs your attention โ precision agriculture without precision-farming equipment. No GPS kit, soil probes or drones.
Add a field by searching its address, drawing the boundary yourself, or uploading an existing map file.
- 01
A satellite photographs your field
Two kinds of satellites pass overhead. One captures color and hidden wavelengths that reveal crop stress. The other sees through cloud, smoke and haze โ keeping your field record moving.
- 02
We turn every image into readings
Greenness. Early stress. Water inside the plant. Soil moisture. Organic matter. Slope. Each reading answers a different question about the same field.
GreennessEarly stressPlant waterSoil moistureOrganic matterSlopeRadar - 03
We add what satellites canโt see
We combine satellite data with your soil history, local weather and your cropโs normal calendar โ specific to your field and the date.
Soil historyLocal weatherCrop calendarGrowth stageField date - 04
You get answers you can act on
Water requirements in millimeters, fertilizer in kilograms, pest risks with probabilities โ and the reason behind every recommendation.
4.5 mmwater today12 kgper nutrient, per acre82%pest riskYieldper acre

Map โ the field map with its farm advisory alongside โ field status, countdowns, yield, soil and pest risk
How the crop is doing
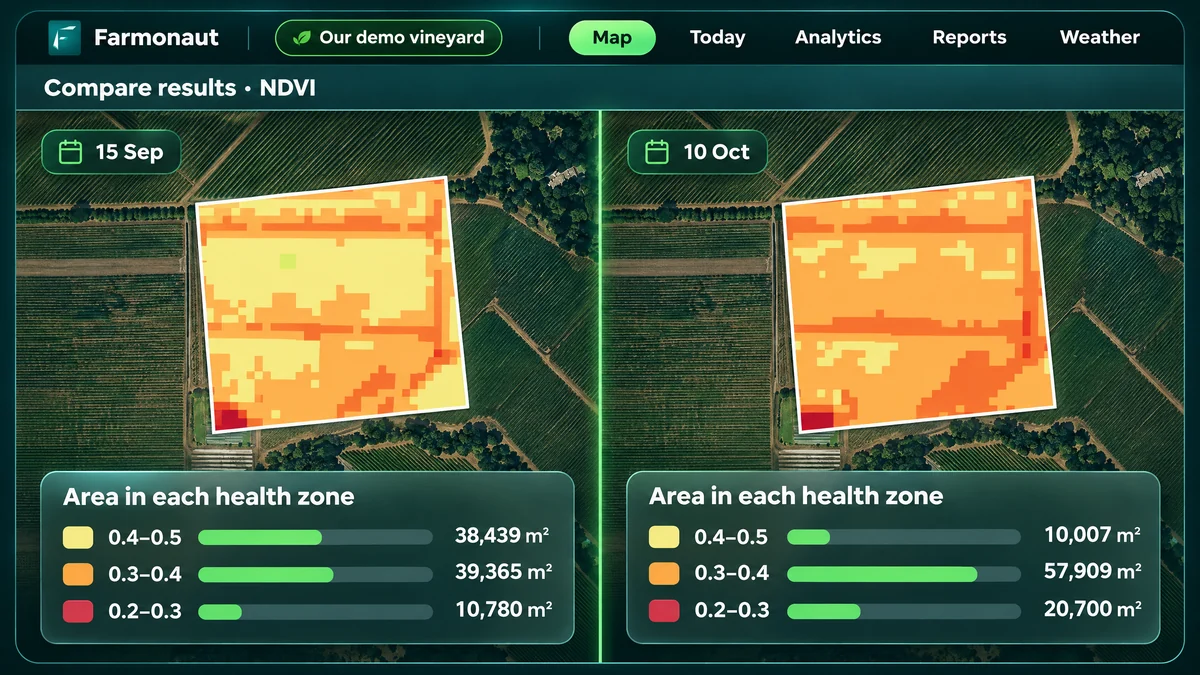
A clear health map of your field in five levels โ healthy, light, moderate, high and very high stress. Zoom in to any area.
Acres in each health levelHow much water, and when
The exact water requirement for your field and the best time to irrigate, based on the crop stage and weather โ irrigation scheduling, field by field.
Millimeters per day, next 7 daysWhat the soil is like
Soil acidity, salinity and organic matter, with simple field-level insights for each reading.
A reading per soil parameterWhat you will harvest
An updated yield estimate as the season progresses, with the reason behind every change.
Yield per acre + expected harvest dateWhat is about to attack
The pest or disease risk for your crop, with a probability score and the key conditions behind it.
Risk probability + two control optionsWhat fertilizer is short
Which nutrients your crop needs, how much to apply and when, based on your fieldโs current condition.
Dose for each of 5 nutrientsIf the right recommendation is apply nothing, weโll tell you that too. Across the fields weโve analyzed, some of the biggest savings came from avoiding unnecessary applications.
Analyze your farm โ
One real report, panel by panel
A real customer field, opened end to end: the health map, the water schedule, the fertilizer doses, the pest warning โ including the moment it flagged a fall in yield the farmer had not seen coming.
Analyze your farm โ16 satellite views of every field โ young crop, mature crop, water, the ground itself, through cloud โ plus nutrients and pests+
Young crop
See early crop growth clearly, even when exposed soil makes standard satellite readings misleading.
Mature crop
See differences within a dense canopy and spot early signs of stress, including potential nitrogen shortage.
Water
Know how much water your crop and soil hold, how quickly it is being used, and where the field needs attention.
The ground itself
Organic matter, elevation, slope and what is growing where โ the fundamentals of the field.
Through cloud
Keep monitoring through monsoon, fog and smoke with radar imagery, so the field record stays continuous.
Feed only what the crop needs
See where each nutrient stands against the cropโs requirement, with the dose for each one. On one Florida farm, 8 of 25 blocks were told to apply nothing; on a Nigerian groundnut field, the advice was to skip nitrogen completely โ the crop makes its own.
Protect what needs protecting
Know which pest, disease or weed puts the crop at risk, why it was flagged and two treatment options โ organic and chemical. On one account the apple field was flagged for one scab fungus and the pear field for a different one.


One platform. 166 crops. From oil palm to blueberries.
From broad-acre crops to specialized fruit and tree crops, the same satellite crop monitoring system works across 166 crops. The figures count only fields where the farmer has named the crop, so real coverage is likely higher โ and adding a new crop doesnโt mean building a new system.

The largest crops after oil palm
The acre figure beside each bar shows the actual area monitored, with the number of countries growing each.
The next twelve
Beyond these twenty: coffee, potato, blueberry, banana, mango, olive, groundnut, cassava and around 130 more.
Growing a crop that isnโt on the list? Tell us the crop and where it is โ the system is not limited to these 166.
Contact us โSatellite crop monitoring in 135 countries
Farmers in 135 countries use satellite data to monitor their fields. The darker the map, the more acres we monitor there. The same technology works across crops, climates and countries โ in the language you choose.
Hover a shaded country to see the acreage monitored there, or click it to open the platform โ
Countries with farms, most acres first
India460,677
Uzbekistan273,945
Algeria20,533
Egypt18,398
United States17,757
Australia15,193
Nigeria15,008
Brazil9,677
Tajikistan7,547
Sri Lanka7,464
United Kingdom7,416
Peru5,172
United Arab Emirates5,082
Taiwan5,025
Uruguay5,006
Argentina4,683
South Africa4,605
South Korea4,532
Indonesia4,472
Tanzania4,396
Vietnam4,318
Kenya4,234
Namibia4,222
Iran4,125
Zambia3,015
Zimbabwe2,966
Ivory Coast2,804
Israel2,644
Kazakhstan2,227
Malaysia2,031
Nepal1,832
Morocco1,747
Canada1,580
Italy1,193
Republic of Serbia1,004
Cameroon1,001
Rwanda988
Spain943
Lebanon940
Colombia937
Mexico908
Bolivia863
Venezuela841
Chile836
Lesotho804
Austria791
Ukraine782
Panama779
Turkey742
Iraq725
Greece719
Germany719
Libya658
Philippines638
Somaliland604
Paraguay568
Azerbaijan546
Czechia523
Tunisia513
New Zealand466
Romania432
Saudi Arabia427
Senegal421
Jordan397
Botswana368
Bangladesh351
Benin344
Lithuania339
Dominican Republic333
Poland329
Ghana321
Sierra Leone305
Yemen292
Cambodia281
Ethiopia272
Uganda270
Georgia258
China256
Angola206
Nicaragua179
Ecuador170
France169
Thailand140
Portugal126
Sweden114
Mauritania98
Liberia93
Denmark87
Honduras86
Croatia74
Bulgaria68
Costa Rica60
Sudan55
Turkmenistan47
Madagascar46
Hungary45
Norway44
Puerto Rico44
Laos43
Oman39
Mali38
Slovakia34
Syria33
Niger33
Fiji32
Chad31
Bosnia and Herzegovina30
Kyrgyzstan18
Palestine16
Slovenia15
Democratic Republic of the Congo14
Jamaica12
Malawi11
Finland9
Qatar9
Ireland7
Latvia6
Togo5
Moldova5
Japan5
East Timor4
Cyprus4
Guatemala3
Myanmar3
Burundi2
South Sudan1
Cuba1
Farms, plantations and agribusinesses โ plus universities that teach on it.
From farmers and plantations to co-operatives, agri-input companies, farm-management services and food buyers, businesses across the agricultural value chain use the platform as their farm management software. Businesses are counted by trading name; universities and colleges are shown separately, as their accounts are used for teaching and research.
Teaching crop intelligence in 20 countries
Students and faculty are already using Farmonaut to work with real fields and real satellite data โ giving the next generation of agricultural professionals hands-on experience with modern crop monitoring.
It matters commercially in one plain way: farm-science graduates who learned to read a crop-health map on this platform turn up at their first job already knowing how to use it.
Evidence beyond our own case studies
Independent researchers with no commercial relationship with Farmonaut have examined how farmers adopt the system, how the technology is built and its measured impact on water use.
Springer ยท A book chapter on how AI is changing crop farming. It names our tools and the situations they suit.
Int. Journal of ICT Development & Communication ยท How farmers in two districts actually took up our system โ and where they struggled. Critical, not friendly, and the one to read first.
Journal of Enterprise Information Management ยท Describes us as an implementation partner for verified, ethical sourcing.
Springer ยท Reports systems supported by us and local NGOs saving up to 50% of water.
Circularity Letters ยท Lists our services as reachable both by phone app and by API.
Google Scholar ยท Run the same search we ran and read the rest, including the parts we would not have chosen.
Bring satellite crop monitoring into your own software.
An agriculture data API that gives your product access to satellite imagery, field readings, reports and recommendations. Build it into your own platform and give your users crop intelligence without building the remote sensing technology yourself.
Send us your field
Share the field boundary in a single API call.
We analyze it
We process the satellite data and generate the readings, report and recommendations for that field.
Get the results in your product
Receive everything as structured JSON, ready to display in your own software.
Authorization: Bearer <YOUR_API_KEY>
โ pictures, readings and advice, as JSON
Sell it as your own
Your brand on the reports. Seven partners already do.
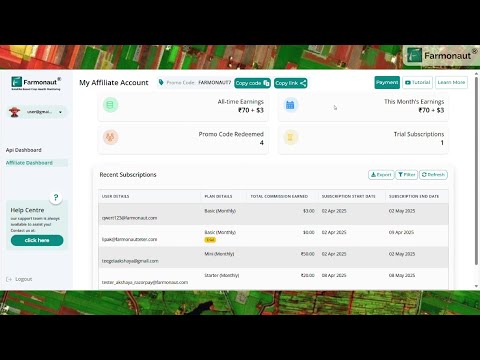
Refer farmers and earn
Your code, your commission, a dashboard that tracks it.
Credits that roll over
Keep 2,470 acres or more under watch and unused credits carry to next month.

Try a real call in Postman before you write any code. The public workspace sends one request with your key and shows exactly what comes back.
Choose a field that matters and see what the data says.
Map one field you already manage and get a fresh crop health report after the next satellite pass. No pilot project or long-term commitment โ just real precision agriculture technology, priced per field.
Satellite crop monitoring: questions before you start
Short answers on how it works, what it costs and how it fits with the tools you already use.
What is satellite crop monitoring?
+
Satellite crop monitoring uses images taken from space every few days to measure crop health, water stress and growth on each of your fields. Farmonaut turns those readings into field-level advice: how much water in millimeters, how much fertilizer in kilograms and which pests or diseases are a risk, with a probability.
How often are my fields updated?
+
Every few days. New satellite passes are processed as they arrive, and radar data keeps readings coming when clouds block the optical images.
How much does satellite crop monitoring cost?
+
Farm monitoring is a subscription priced by the area of the fields you monitor, and you can choose and pay for a plan online at sat.farmonaut.com. See pricing for the plans.
Do I need sensors, drones or field visits?
+
No. Everything comes from satellite data, so there is nothing to install. You draw or upload your field boundaries and the monitoring starts from the next satellite pass.
Which crops and countries does it work for?
+
166 crops so far, from corn, wheat and soybeans to vineyards, orchards, blueberries and oil palm, on fields in 135 countries, including the United States, Canada, Australia and across Europe.
Is it precision agriculture software or a farm management system?
+
It is precision agriculture software for crop monitoring and field advice. It works alongside the farm management software you use for records and accounting, and the data can be pulled into those tools through the Agriculture Data API.
What is the best crop monitoring app?
+
The best crop monitoring app is the one that tells you what to do on each field, not just how green it looks. Check for field-by-field updates every few days, water and fertilizer advice in real units, pest and disease risk, mapping of your own field boundaries, coverage of your crops and an API if you run your own software. Farmonaut covers all six; the Crop monitoring software section above shows the screens.
Can I use the data in my own software?
+
Yes. The Agriculture Data API returns the same field views the platform draws (crop health, water stress and the other indices), the values behind each picture and the full field report, so agribusinesses, insurers and software teams can build it into their own products.
Advising farmers, or running a business? Refer them and earn.
Share your code with the growers you already work with. When they monitor their fields with Farmonaut, you earn a share of what they spend โ tracked on your own dashboard.
- Your code, your commission
- A dashboard that tracks every referral
- Sell it as your own โ seven partners already do
- No technical background needed

- 1You share your code with a grower
- 2They monitor their fields with Farmonaut
- 3You earn a share of what they spend
Customer percentages are their own estimates, checked against their own reports. Real product screens, captured September 2026. Areas in acres, rounded down.